
|
|||||
|
 | |
| |
| |
| |
| |
| |
|
Gene: IL1B |
Gene summary for IL1B |
| Gene information | Species | Human | Gene symbol | IL1B | Gene ID | 3553 |
| Gene name | interleukin 1 beta | |
| Gene Alias | IL-1 | |
| Cytomap | 2q14.1 | |
| Gene Type | protein-coding | GO ID | GO:0000003 | UniProtAcc | P01584 |
Top |
Malignant transformation analysis |
| Identification of the aberrant gene expression in precancerous and cancerous lesions by comparing the gene expression of stem-like cells in diseased tissues with normal stem cells |
| Entrez ID | Symbol | Replicates | Species | Organ | Tissue | Adj P-value | Log2FC | Malignancy |
| 3553 | IL1B | LZE24T | Human | Esophagus | ESCC | 2.37e-02 | -8.50e-02 | 0.0596 |
| 3553 | IL1B | P5T-E | Human | Esophagus | ESCC | 2.88e-17 | 9.39e-01 | 0.1327 |
| 3553 | IL1B | P11T-E | Human | Esophagus | ESCC | 1.15e-05 | 1.15e+00 | 0.1426 |
| 3553 | IL1B | P21T-E | Human | Esophagus | ESCC | 2.10e-13 | 1.12e+00 | 0.1617 |
| 3553 | IL1B | P38T-E | Human | Esophagus | ESCC | 4.43e-06 | 1.46e+00 | 0.127 |
| 3553 | IL1B | P47T-E | Human | Esophagus | ESCC | 1.83e-07 | 4.18e-01 | 0.1067 |
| 3553 | IL1B | P89T-E | Human | Esophagus | ESCC | 4.52e-19 | 3.63e+00 | 0.1752 |
| 3553 | IL1B | P130T-E | Human | Esophagus | ESCC | 1.01e-36 | 2.56e+00 | 0.1676 |
| 3553 | IL1B | C04 | Human | Oral cavity | OSCC | 4.22e-10 | 2.13e+00 | 0.2633 |
| 3553 | IL1B | C21 | Human | Oral cavity | OSCC | 2.18e-60 | 2.83e+00 | 0.2678 |
| 3553 | IL1B | C30 | Human | Oral cavity | OSCC | 7.86e-32 | 1.39e+00 | 0.3055 |
| 3553 | IL1B | C43 | Human | Oral cavity | OSCC | 2.50e-02 | 4.06e-01 | 0.1704 |
| 3553 | IL1B | C51 | Human | Oral cavity | OSCC | 3.82e-14 | 4.84e-01 | 0.2674 |
| 3553 | IL1B | C57 | Human | Oral cavity | OSCC | 8.32e-08 | 4.99e-01 | 0.1679 |
| 3553 | IL1B | C06 | Human | Oral cavity | OSCC | 2.94e-06 | 1.59e+00 | 0.2699 |
| 3553 | IL1B | C07 | Human | Oral cavity | OSCC | 7.37e-05 | 7.16e-01 | 0.2491 |
| 3553 | IL1B | C08 | Human | Oral cavity | OSCC | 2.91e-08 | 3.52e-01 | 0.1919 |
| 3553 | IL1B | C09 | Human | Oral cavity | OSCC | 4.96e-02 | 3.10e-02 | 0.1431 |
| 3553 | IL1B | PTCwithHT_1 | Human | Thyroid | HT | 5.71e-22 | 1.41e+00 | 0.0238 |
| 3553 | IL1B | PTCwithHT_8 | Human | Thyroid | HT | 4.31e-16 | 8.93e-01 | 0.0351 |
| Page: 1 2 |
| Tissue | Expression Dynamics | Abbreviation |
| Esophagus | 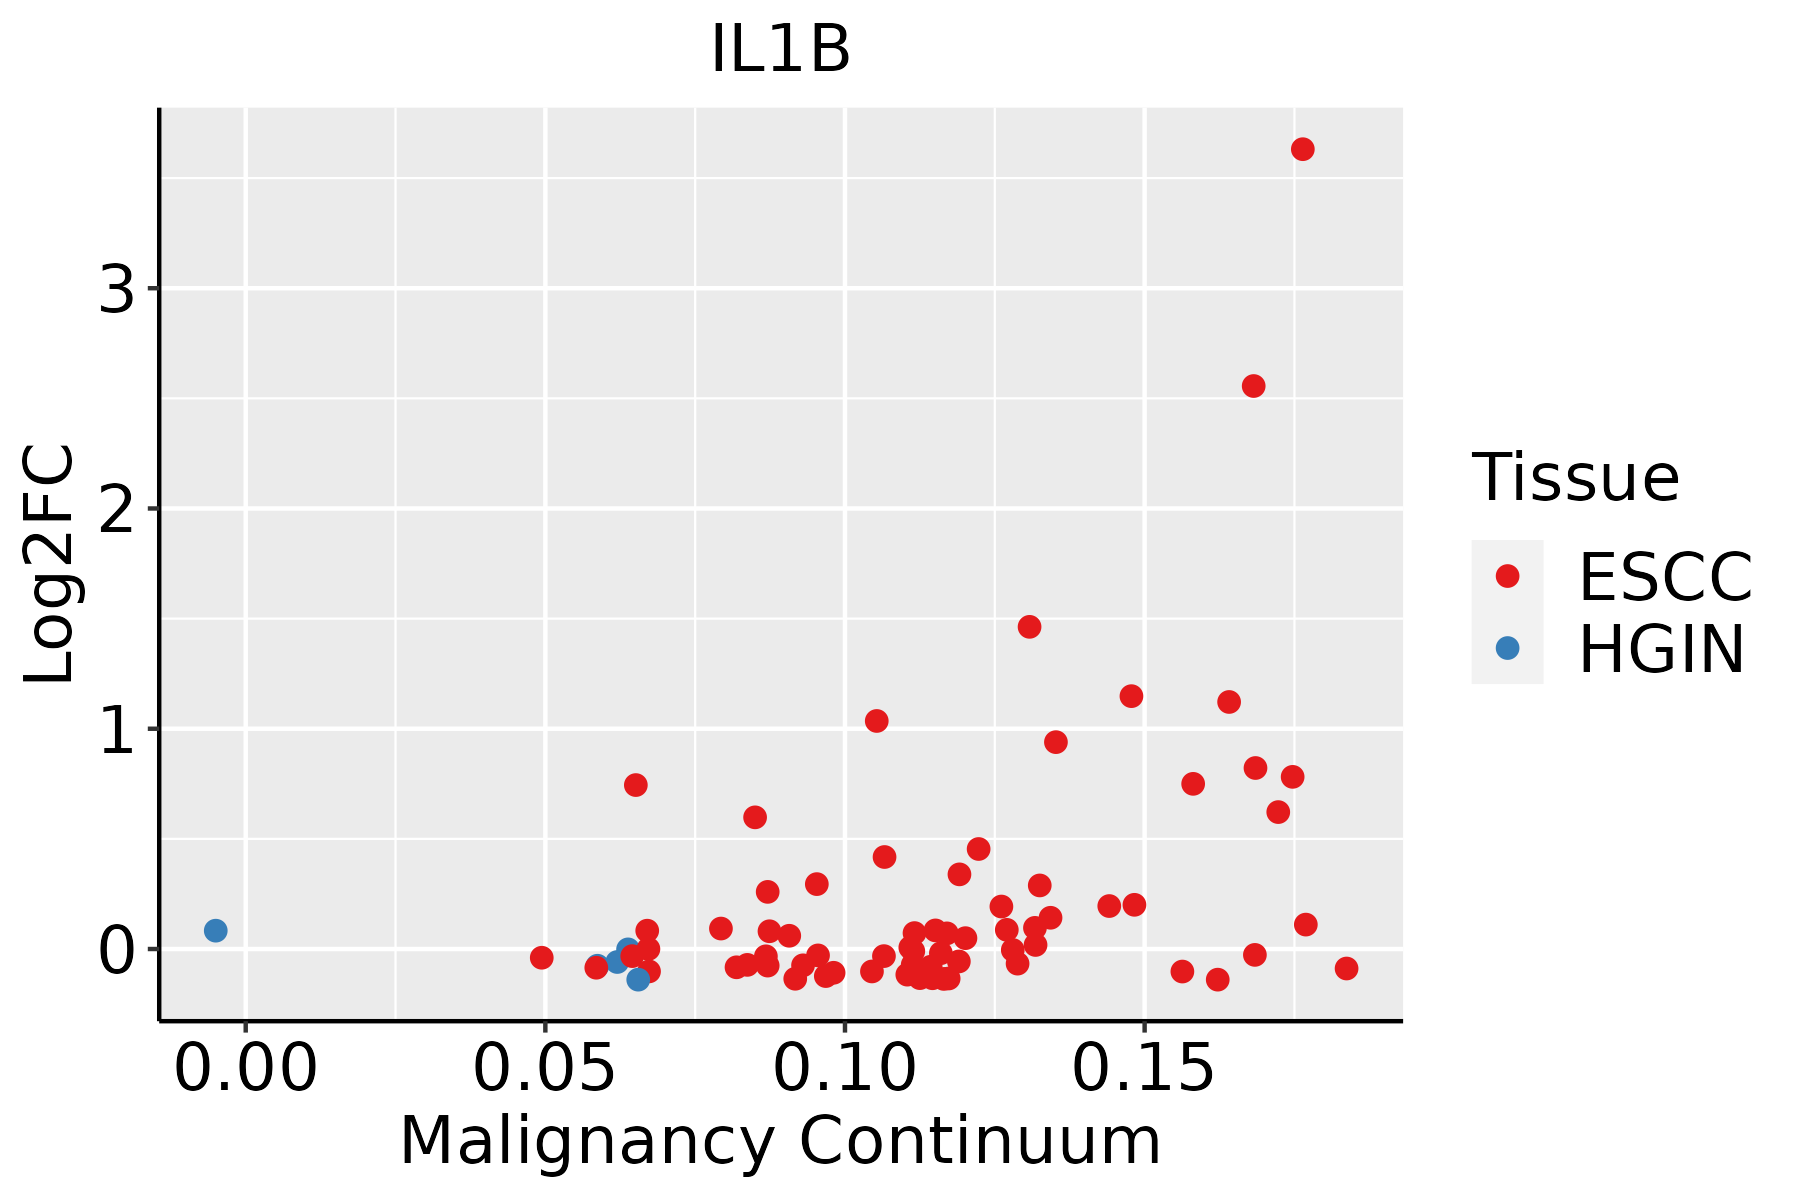 | ESCC: Esophageal squamous cell carcinoma |
| HGIN: High-grade intraepithelial neoplasias | ||
| LGIN: Low-grade intraepithelial neoplasias | ||
| Oral Cavity |  | EOLP: Erosive Oral lichen planus |
| LP: leukoplakia | ||
| NEOLP: Non-erosive oral lichen planus | ||
| OSCC: Oral squamous cell carcinoma | ||
| Thyroid |  | ATC: Anaplastic thyroid cancer |
| HT: Hashimoto's thyroiditis | ||
| PTC: Papillary thyroid cancer |
| ∗log2FC in expression of this searched gene in stem-like cells from each diseased tissue sample relative to stem-like cells in normal samples in each tissue plotted against the malignancy continuum. Samples are colored based on if they are from different disease stage. |
Top |
Malignant transformation related pathway analysis |
| Find out the enriched GO biological processes and KEGG pathways involved in transition from healthy to precancer to cancer |
| Tissue | Disease Stage | Enriched GO biological Processes |
| Colorectum | AD |  |
| Colorectum | SER |  |
| Colorectum | MSS |  |
| Colorectum | MSI-H |  |
| Colorectum | FAP |  |
| ∗Top 15 enriched GO BP terms are showed in the bar plot of each disease state in each tissue. Each row represents a significant GO biological process which is colored according to the -log10(p.adjust). |
| Page: 1 2 3 4 5 6 7 8 9 |
| GO ID | Tissue | Disease Stage | Description | Gene Ratio | Bg Ratio | pvalue | p.adjust | Count |
| GO:0006913110 | Esophagus | ESCC | nucleocytoplasmic transport | 230/8552 | 301/18723 | 6.04e-28 | 2.02e-25 | 230 |
| GO:0051169110 | Esophagus | ESCC | nuclear transport | 230/8552 | 301/18723 | 6.04e-28 | 2.02e-25 | 230 |
| GO:001657015 | Esophagus | ESCC | histone modification | 323/8552 | 463/18723 | 2.61e-26 | 7.88e-24 | 323 |
| GO:014001414 | Esophagus | ESCC | mitotic nuclear division | 218/8552 | 287/18723 | 6.17e-26 | 1.78e-23 | 218 |
| GO:0042176111 | Esophagus | ESCC | regulation of protein catabolic process | 280/8552 | 391/18723 | 8.65e-26 | 2.39e-23 | 280 |
| GO:2001233111 | Esophagus | ESCC | regulation of apoptotic signaling pathway | 256/8552 | 356/18723 | 4.11e-24 | 1.04e-21 | 256 |
| GO:003238618 | Esophagus | ESCC | regulation of intracellular transport | 243/8552 | 337/18723 | 3.20e-23 | 7.25e-21 | 243 |
| GO:0009896111 | Esophagus | ESCC | positive regulation of catabolic process | 332/8552 | 492/18723 | 4.36e-23 | 9.22e-21 | 332 |
| GO:0031331111 | Esophagus | ESCC | positive regulation of cellular catabolic process | 292/8552 | 427/18723 | 8.67e-22 | 1.53e-19 | 292 |
| GO:0051168110 | Esophagus | ESCC | nuclear export | 126/8552 | 154/18723 | 1.88e-20 | 2.65e-18 | 126 |
| GO:001820514 | Esophagus | ESCC | peptidyl-lysine modification | 259/8552 | 376/18723 | 3.90e-20 | 5.26e-18 | 259 |
| GO:0045862111 | Esophagus | ESCC | positive regulation of proteolysis | 256/8552 | 372/18723 | 7.88e-20 | 9.43e-18 | 256 |
| GO:0033157110 | Esophagus | ESCC | regulation of intracellular protein transport | 169/8552 | 229/18723 | 3.31e-18 | 3.23e-16 | 169 |
| GO:0032388110 | Esophagus | ESCC | positive regulation of intracellular transport | 152/8552 | 202/18723 | 7.89e-18 | 7.36e-16 | 152 |
| GO:0045732111 | Esophagus | ESCC | positive regulation of protein catabolic process | 167/8552 | 231/18723 | 1.47e-16 | 1.14e-14 | 167 |
| GO:0097191111 | Esophagus | ESCC | extrinsic apoptotic signaling pathway | 159/8552 | 219/18723 | 4.12e-16 | 2.94e-14 | 159 |
| GO:000734615 | Esophagus | ESCC | regulation of mitotic cell cycle | 293/8552 | 457/18723 | 8.00e-16 | 5.64e-14 | 293 |
| GO:1904951111 | Esophagus | ESCC | positive regulation of establishment of protein localization | 216/8552 | 319/18723 | 1.01e-15 | 6.86e-14 | 216 |
| GO:2001234111 | Esophagus | ESCC | negative regulation of apoptotic signaling pathway | 161/8552 | 224/18723 | 1.24e-15 | 8.09e-14 | 161 |
| GO:0046822110 | Esophagus | ESCC | regulation of nucleocytoplasmic transport | 88/8552 | 106/18723 | 1.88e-15 | 1.19e-13 | 88 |
| Page: 1 2 3 4 5 6 7 8 9 10 11 12 13 14 15 16 17 18 19 20 21 22 23 24 25 26 27 28 29 30 31 32 33 |
| Pathway ID | Tissue | Disease Stage | Description | Gene Ratio | Bg Ratio | pvalue | p.adjust | qvalue | Count |
| hsa05132211 | Esophagus | ESCC | Salmonella infection | 191/4205 | 249/8465 | 6.51e-19 | 5.45e-17 | 2.79e-17 | 191 |
| hsa05022210 | Esophagus | ESCC | Pathways of neurodegeneration - multiple diseases | 318/4205 | 476/8465 | 6.10e-15 | 2.04e-13 | 1.05e-13 | 318 |
| hsa05010210 | Esophagus | ESCC | Alzheimer disease | 263/4205 | 384/8465 | 1.80e-14 | 5.47e-13 | 2.80e-13 | 263 |
| hsa04932210 | Esophagus | ESCC | Non-alcoholic fatty liver disease | 122/4205 | 155/8465 | 5.69e-14 | 1.59e-12 | 8.14e-13 | 122 |
| hsa05020210 | Esophagus | ESCC | Prion disease | 193/4205 | 273/8465 | 6.42e-13 | 1.34e-11 | 6.89e-12 | 193 |
| hsa05418211 | Esophagus | ESCC | Fluid shear stress and atherosclerosis | 109/4205 | 139/8465 | 2.00e-12 | 3.72e-11 | 1.90e-11 | 109 |
| hsa05131211 | Esophagus | ESCC | Shigellosis | 176/4205 | 247/8465 | 2.27e-12 | 4.01e-11 | 2.05e-11 | 176 |
| hsa05130211 | Esophagus | ESCC | Pathogenic Escherichia coli infection | 142/4205 | 197/8465 | 8.21e-11 | 1.06e-09 | 5.42e-10 | 142 |
| hsa0466810 | Esophagus | ESCC | TNF signaling pathway | 89/4205 | 114/8465 | 3.36e-10 | 4.01e-09 | 2.06e-09 | 89 |
| hsa0516425 | Esophagus | ESCC | Influenza A | 122/4205 | 171/8465 | 5.01e-09 | 4.79e-08 | 2.45e-08 | 122 |
| hsa0513526 | Esophagus | ESCC | Yersinia infection | 100/4205 | 137/8465 | 1.80e-08 | 1.59e-07 | 8.12e-08 | 100 |
| hsa05171211 | Esophagus | ESCC | Coronavirus disease - COVID-19 | 156/4205 | 232/8465 | 3.18e-08 | 2.68e-07 | 1.37e-07 | 156 |
| hsa05417211 | Esophagus | ESCC | Lipid and atherosclerosis | 143/4205 | 215/8465 | 3.30e-07 | 2.45e-06 | 1.26e-06 | 143 |
| hsa05163210 | Esophagus | ESCC | Human cytomegalovirus infection | 148/4205 | 225/8465 | 5.73e-07 | 4.00e-06 | 2.05e-06 | 148 |
| hsa0493310 | Esophagus | ESCC | AGE-RAGE signaling pathway in diabetic complications | 72/4205 | 100/8465 | 4.15e-06 | 2.28e-05 | 1.17e-05 | 72 |
| hsa046259 | Esophagus | ESCC | C-type lectin receptor signaling pathway | 73/4205 | 104/8465 | 1.57e-05 | 7.98e-05 | 4.09e-05 | 73 |
| hsa0465727 | Esophagus | ESCC | IL-17 signaling pathway | 66/4205 | 94/8465 | 3.93e-05 | 1.75e-04 | 8.99e-05 | 66 |
| hsa0513428 | Esophagus | ESCC | Legionellosis | 42/4205 | 57/8465 | 1.83e-04 | 6.90e-04 | 3.53e-04 | 42 |
| hsa051629 | Esophagus | ESCC | Measles | 90/4205 | 139/8465 | 2.16e-04 | 7.87e-04 | 4.03e-04 | 90 |
| hsa0462122 | Esophagus | ESCC | NOD-like receptor signaling pathway | 116/4205 | 186/8465 | 2.90e-04 | 1.03e-03 | 5.30e-04 | 116 |
| Page: 1 2 3 4 5 6 |
Top |
Cell-cell communication analysis |
| Identification of potential cell-cell interactions between two cell types and their ligand-receptor pairs for different disease states |
| Ligand | Receptor | LRpair | Pathway | Tissue | Disease Stage |
| IL1B | IL1R1_IL1RAP | IL1B_IL1R1_IL1RAP | IL1 | Breast | DCIS |
| IL1B | IL1R2 | IL1B_IL1R2 | IL1 | Breast | DCIS |
| IL1B | IL1R2 | IL1B_IL1R2 | IL1 | Cervix | ADJ |
| IL1B | IL1R1_IL1RAP | IL1B_IL1R1_IL1RAP | IL1 | Cervix | CC |
| IL1B | IL1R2 | IL1B_IL1R2 | IL1 | CRC | MSI-H |
| IL1B | IL1R2 | IL1B_IL1R2 | IL1 | CRC | MSS |
| IL1B | IL1R2 | IL1B_IL1R2 | IL1 | Endometrium | AEH |
| IL1B | IL1R2 | IL1B_IL1R2 | IL1 | Endometrium | EEC |
| IL1B | IL1R2 | IL1B_IL1R2 | IL1 | Esophagus | Healthy |
| IL1B | IL1R2 | IL1B_IL1R2 | IL1 | GC | ADJ |
| IL1B | IL1R2 | IL1B_IL1R2 | IL1 | GC | GC |
| IL1B | IL1R2 | IL1B_IL1R2 | IL1 | HNSCC | ADJ |
| IL1B | IL1R2 | IL1B_IL1R2 | IL1 | HNSCC | Healthy |
| IL1B | IL1R2 | IL1B_IL1R2 | IL1 | HNSCC | OSCC |
| IL1B | IL1R1_IL1RAP | IL1B_IL1R1_IL1RAP | IL1 | HNSCC | Precancer |
| IL1B | IL1R2 | IL1B_IL1R2 | IL1 | HNSCC | Precancer |
| IL1B | IL1R1_IL1RAP | IL1B_IL1R1_IL1RAP | IL1 | Liver | Healthy |
| IL1B | IL1R1_IL1RAP | IL1B_IL1R1_IL1RAP | IL1 | Liver | Precancer |
| IL1B | IL1R2 | IL1B_IL1R2 | IL1 | Lung | AAH |
| IL1B | IL1R2 | IL1B_IL1R2 | IL1 | Lung | ADJ |
| Page: 1 2 3 |
Top |
Single-cell gene regulatory network inference analysis |
| Find out the significant the regulons (TFs) and the target genes of each regulon across cell types for different disease states |
| TF | Cell Type | Tissue | Disease Stage | Target Gene | RSS | Regulon Activity |
| ∗The dot plots of a searched regulon are shown for all cell subpopulations in each disease state of each tissue based on the regulon specific score inferred using pySCENIC and by calculating the average expression. |
| Page: 1 |
Top |
Somatic mutation of malignant transformation related genes |
| Annotation of somatic variants for genes involved in malignant transformation |
| Hugo Symbol | Variant Class | Variant Classification | dbSNP RS | HGVSc | HGVSp | HGVSp Short | SWISSPROT | BIOTYPE | SIFT | PolyPhen | Tumor Sample Barcode | Tissue | Histology | Sex | Age | Stage | Therapy Types | Drugs | Outcome |
| IL1B | SNV | Missense_Mutation | c.33N>T | p.Met11Ile | p.M11I | P01584 | protein_coding | tolerated(0.17) | benign(0.026) | TCGA-CA-6717-01 | Colorectum | colon adenocarcinoma | Male | <65 | I/II | Chemotherapy | oxaliplatin | CR | |
| IL1B | SNV | Missense_Mutation | rs766684369 | c.374C>T | p.Thr125Met | p.T125M | P01584 | protein_coding | tolerated(0.06) | probably_damaging(0.984) | TCGA-CK-5916-01 | Colorectum | colon adenocarcinoma | Female | >=65 | I/II | Unknown | Unknown | PD |
| IL1B | SNV | Missense_Mutation | c.738N>A | p.Met246Ile | p.M246I | P01584 | protein_coding | tolerated(0.07) | benign(0.154) | TCGA-D5-6928-01 | Colorectum | colon adenocarcinoma | Male | >=65 | I/II | Unknown | Unknown | SD | |
| IL1B | SNV | Missense_Mutation | rs762704392 | c.22N>A | p.Ala8Thr | p.A8T | P01584 | protein_coding | tolerated(1) | benign(0.001) | TCGA-G4-6309-01 | Colorectum | colon adenocarcinoma | Female | <65 | III/IV | Chemotherapy | xeloda | PD |
| IL1B | SNV | Missense_Mutation | rs144433180 | c.562N>A | p.Val188Met | p.V188M | P01584 | protein_coding | deleterious(0.02) | possibly_damaging(0.646) | TCGA-WS-AB45-01 | Colorectum | colon adenocarcinoma | Female | <65 | I/II | Unknown | Unknown | SD |
| IL1B | SNV | Missense_Mutation | novel | c.261N>T | p.Glu87Asp | p.E87D | P01584 | protein_coding | tolerated(1) | benign(0) | TCGA-A5-A2K5-01 | Endometrium | uterine corpus endometrioid carcinoma | Female | >=65 | I/II | Unknown | Unknown | SD |
| IL1B | SNV | Missense_Mutation | rs755957216 | c.193N>A | p.Ala65Thr | p.A65T | P01584 | protein_coding | deleterious(0.01) | benign(0.081) | TCGA-AJ-A3BH-01 | Endometrium | uterine corpus endometrioid carcinoma | Female | Unknown | I/II | Unknown | Unknown | SD |
| IL1B | SNV | Missense_Mutation | novel | c.734N>G | p.Asn245Ser | p.N245S | P01584 | protein_coding | tolerated(0.49) | benign(0) | TCGA-AJ-A3EL-01 | Endometrium | uterine corpus endometrioid carcinoma | Female | <65 | I/II | Unknown | Unknown | SD |
| IL1B | SNV | Missense_Mutation | rs144640380 | c.423N>C | p.Glu141Asp | p.E141D | P01584 | protein_coding | tolerated(0.05) | possibly_damaging(0.641) | TCGA-AJ-A3EL-01 | Endometrium | uterine corpus endometrioid carcinoma | Female | <65 | I/II | Unknown | Unknown | SD |
| IL1B | SNV | Missense_Mutation | rs775562734 | c.152N>A | p.Arg51Gln | p.R51Q | P01584 | protein_coding | tolerated(1) | benign(0.001) | TCGA-AJ-A3EL-01 | Endometrium | uterine corpus endometrioid carcinoma | Female | <65 | I/II | Unknown | Unknown | SD |
| Page: 1 2 3 |
Top |
Related drugs of malignant transformation related genes |
| Identification of chemicals and drugs interact with genes involved in malignant transfromation |
| (DGIdb 4.0) |
| Entrez ID | Symbol | Category | Interaction Types | Drug Claim Name | Drug Name | PMIDs |
| 3553 | IL1B | KINASE, DRUGGABLE GENOME | VERAPAMIL | VERAPAMIL | 2686646 | |
| 3553 | IL1B | KINASE, DRUGGABLE GENOME | ERYTHROMYCIN | ERYTHROMYCIN | 2534682 | |
| 3553 | IL1B | KINASE, DRUGGABLE GENOME | BECLOMETHASONE DIPROPIONATE | 9176529 | ||
| 3553 | IL1B | KINASE, DRUGGABLE GENOME | RESVERATROL | RESVERATROL | 16389574 | |
| 3553 | IL1B | KINASE, DRUGGABLE GENOME | AC-201 | DIACEREIN | ||
| 3553 | IL1B | KINASE, DRUGGABLE GENOME | XOMA 052 | |||
| 3553 | IL1B | KINASE, DRUGGABLE GENOME | CHINESE HERBS | 8871284 | ||
| 3553 | IL1B | KINASE, DRUGGABLE GENOME | aspirin | ASPIRIN | 19448967 | |
| 3553 | IL1B | KINASE, DRUGGABLE GENOME | ACITRETIN | ACITRETIN | 1431212 | |
| 3553 | IL1B | KINASE, DRUGGABLE GENOME | risedronate | RISEDRONIC ACID | 16257277 |
| Page: 1 2 3 4 5 6 7 |

Copyright 2023-Present -The University of Texas Health Science Center at Houston |