
|
|||||
|
 | |
| |
| |
| |
| |
| |
|
Gene: IL1A |
Gene summary for IL1A |
| Gene information | Species | Human | Gene symbol | IL1A | Gene ID | 3552 |
| Gene name | interleukin 1 alpha | |
| Gene Alias | IL-1 alpha | |
| Cytomap | 2q14.1 | |
| Gene Type | protein-coding | GO ID | GO:0000003 | UniProtAcc | P01583 |
Top |
Malignant transformation analysis |
| Identification of the aberrant gene expression in precancerous and cancerous lesions by comparing the gene expression of stem-like cells in diseased tissues with normal stem cells |
| Entrez ID | Symbol | Replicates | Species | Organ | Tissue | Adj P-value | Log2FC | Malignancy |
| 3552 | IL1A | P5T-E | Human | Esophagus | ESCC | 8.48e-04 | 2.39e-01 | 0.1327 |
| 3552 | IL1A | P11T-E | Human | Esophagus | ESCC | 4.13e-14 | 1.49e+00 | 0.1426 |
| 3552 | IL1A | P21T-E | Human | Esophagus | ESCC | 8.76e-25 | 1.39e+00 | 0.1617 |
| 3552 | IL1A | P32T-E | Human | Esophagus | ESCC | 3.44e-03 | 3.70e-01 | 0.1666 |
| 3552 | IL1A | P37T-E | Human | Esophagus | ESCC | 4.06e-12 | 6.08e-01 | 0.1371 |
| 3552 | IL1A | P38T-E | Human | Esophagus | ESCC | 6.13e-18 | 1.93e+00 | 0.127 |
| 3552 | IL1A | P47T-E | Human | Esophagus | ESCC | 1.55e-03 | 1.83e-01 | 0.1067 |
| 3552 | IL1A | P49T-E | Human | Esophagus | ESCC | 4.56e-02 | 5.41e-01 | 0.1768 |
| 3552 | IL1A | P52T-E | Human | Esophagus | ESCC | 4.53e-17 | 8.23e-01 | 0.1555 |
| 3552 | IL1A | P83T-E | Human | Esophagus | ESCC | 1.05e-21 | 1.59e+00 | 0.1738 |
| 3552 | IL1A | P89T-E | Human | Esophagus | ESCC | 8.57e-15 | 1.79e+00 | 0.1752 |
| 3552 | IL1A | P107T-E | Human | Esophagus | ESCC | 2.02e-03 | 3.01e-01 | 0.171 |
| 3552 | IL1A | P126T-E | Human | Esophagus | ESCC | 5.59e-03 | 5.29e-01 | 0.1125 |
| 3552 | IL1A | P130T-E | Human | Esophagus | ESCC | 7.86e-32 | 1.40e+00 | 0.1676 |
| 3552 | IL1A | C04 | Human | Oral cavity | OSCC | 1.61e-22 | 1.59e+00 | 0.2633 |
| 3552 | IL1A | C21 | Human | Oral cavity | OSCC | 8.04e-35 | 2.02e+00 | 0.2678 |
| 3552 | IL1A | C43 | Human | Oral cavity | OSCC | 5.78e-05 | 4.08e-01 | 0.1704 |
| 3552 | IL1A | C57 | Human | Oral cavity | OSCC | 2.48e-10 | 7.67e-01 | 0.1679 |
| 3552 | IL1A | C06 | Human | Oral cavity | OSCC | 5.61e-04 | 1.31e+00 | 0.2699 |
| 3552 | IL1A | SYSMH2 | Human | Oral cavity | OSCC | 1.17e-03 | 5.55e-01 | 0.2326 |
| Page: 1 |
| Tissue | Expression Dynamics | Abbreviation |
| Esophagus |  | ESCC: Esophageal squamous cell carcinoma |
| HGIN: High-grade intraepithelial neoplasias | ||
| LGIN: Low-grade intraepithelial neoplasias | ||
| Oral Cavity | 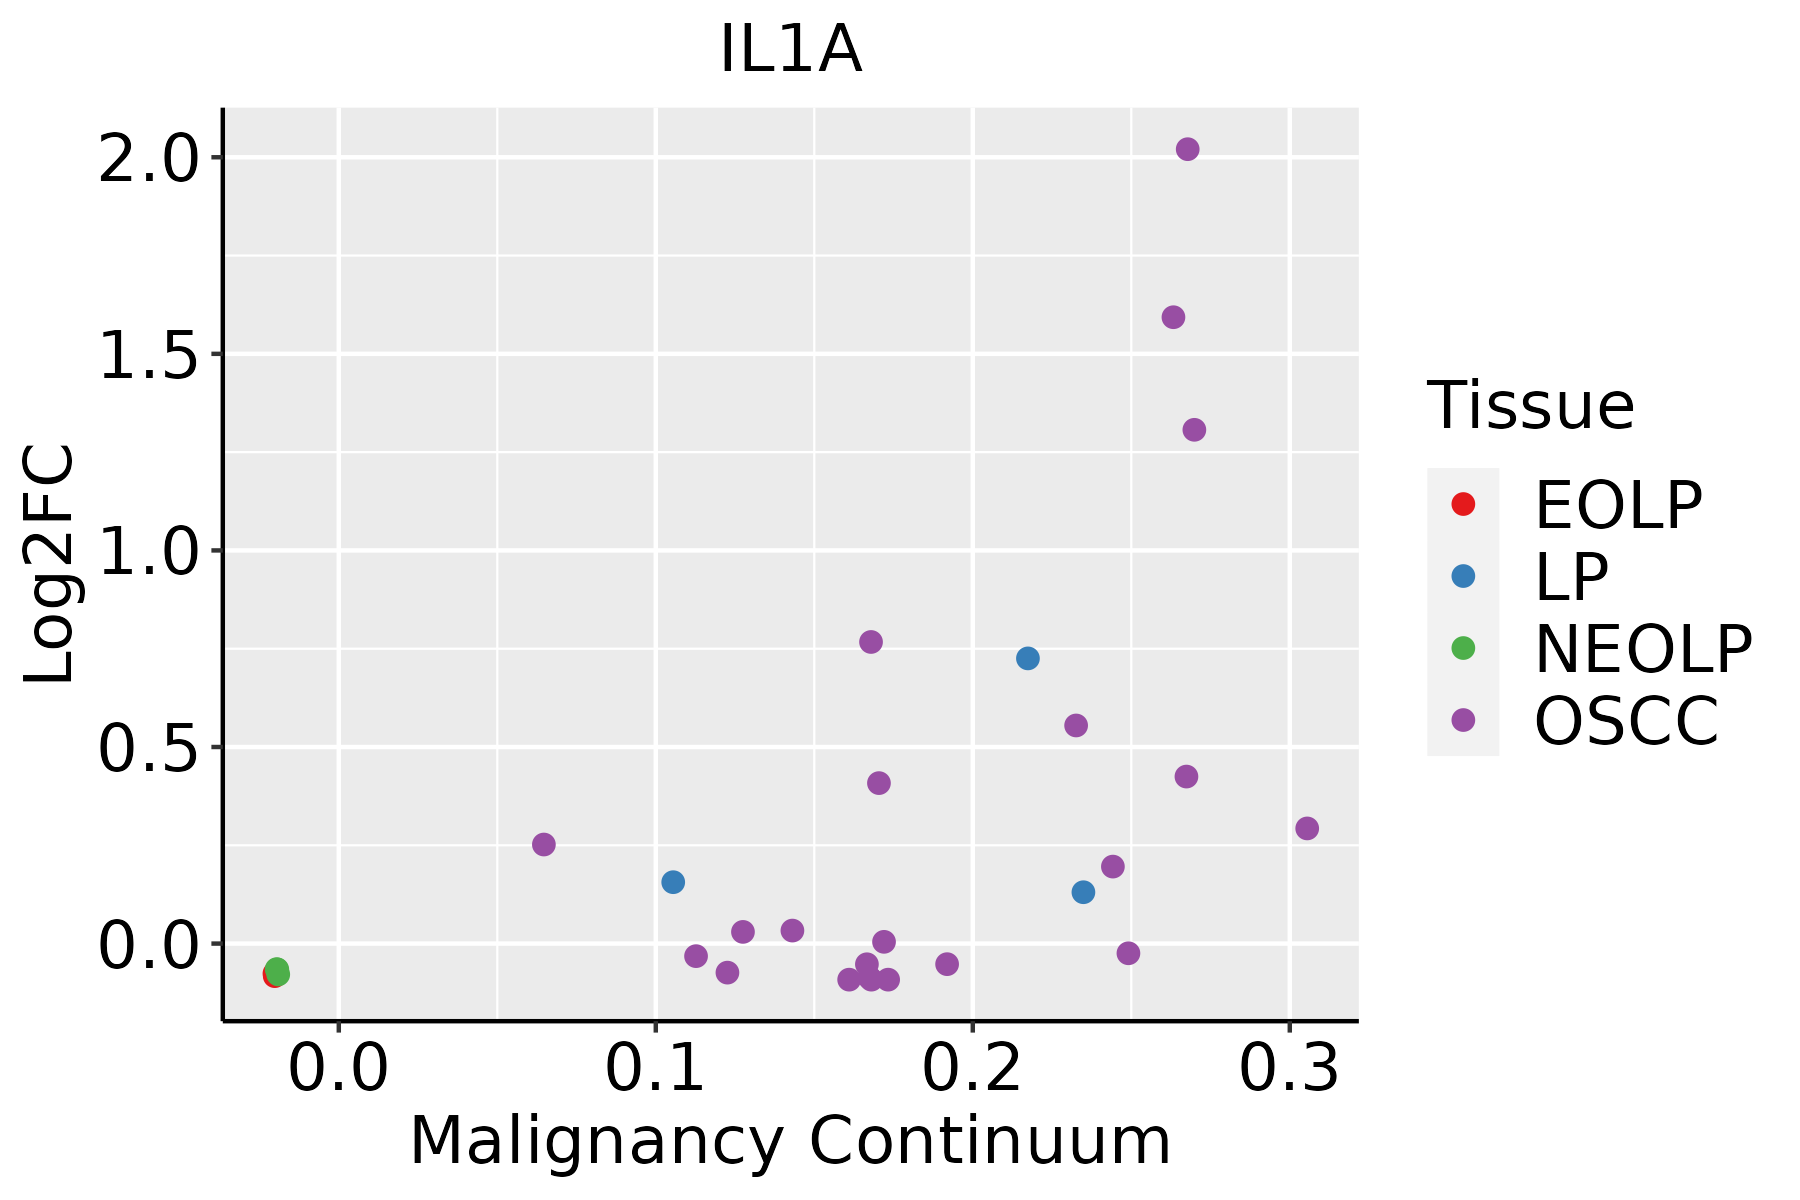 | EOLP: Erosive Oral lichen planus |
| LP: leukoplakia | ||
| NEOLP: Non-erosive oral lichen planus | ||
| OSCC: Oral squamous cell carcinoma |
| ∗log2FC in expression of this searched gene in stem-like cells from each diseased tissue sample relative to stem-like cells in normal samples in each tissue plotted against the malignancy continuum. Samples are colored based on if they are from different disease stage. |
Top |
Malignant transformation related pathway analysis |
| Find out the enriched GO biological processes and KEGG pathways involved in transition from healthy to precancer to cancer |
| Tissue | Disease Stage | Enriched GO biological Processes |
| Colorectum | AD |  |
| Colorectum | SER |  |
| Colorectum | MSS |  |
| Colorectum | MSI-H |  |
| Colorectum | FAP |  |
| ∗Top 15 enriched GO BP terms are showed in the bar plot of each disease state in each tissue. Each row represents a significant GO biological process which is colored according to the -log10(p.adjust). |
| Page: 1 2 3 4 5 6 7 8 9 |
| GO ID | Tissue | Disease Stage | Description | Gene Ratio | Bg Ratio | pvalue | p.adjust | Count |
| GO:014001414 | Esophagus | ESCC | mitotic nuclear division | 218/8552 | 287/18723 | 6.17e-26 | 1.78e-23 | 218 |
| GO:2001233111 | Esophagus | ESCC | regulation of apoptotic signaling pathway | 256/8552 | 356/18723 | 4.11e-24 | 1.04e-21 | 256 |
| GO:0097191111 | Esophagus | ESCC | extrinsic apoptotic signaling pathway | 159/8552 | 219/18723 | 4.12e-16 | 2.94e-14 | 159 |
| GO:000734615 | Esophagus | ESCC | regulation of mitotic cell cycle | 293/8552 | 457/18723 | 8.00e-16 | 5.64e-14 | 293 |
| GO:1904951111 | Esophagus | ESCC | positive regulation of establishment of protein localization | 216/8552 | 319/18723 | 1.01e-15 | 6.86e-14 | 216 |
| GO:2001234111 | Esophagus | ESCC | negative regulation of apoptotic signaling pathway | 161/8552 | 224/18723 | 1.24e-15 | 8.09e-14 | 161 |
| GO:0051222111 | Esophagus | ESCC | positive regulation of protein transport | 204/8552 | 303/18723 | 1.56e-14 | 8.38e-13 | 204 |
| GO:00482853 | Esophagus | ESCC | organelle fission | 301/8552 | 488/18723 | 4.64e-13 | 2.12e-11 | 301 |
| GO:2001236111 | Esophagus | ESCC | regulation of extrinsic apoptotic signaling pathway | 111/8552 | 151/18723 | 2.97e-12 | 1.18e-10 | 111 |
| GO:00002802 | Esophagus | ESCC | nuclear division | 270/8552 | 439/18723 | 1.17e-11 | 4.24e-10 | 270 |
| GO:004578710 | Esophagus | ESCC | positive regulation of cell cycle | 196/8552 | 313/18723 | 9.27e-10 | 2.24e-08 | 196 |
| GO:004578527 | Esophagus | ESCC | positive regulation of cell adhesion | 255/8552 | 437/18723 | 5.07e-08 | 9.11e-07 | 255 |
| GO:00070883 | Esophagus | ESCC | regulation of mitotic nuclear division | 78/8552 | 110/18723 | 6.96e-08 | 1.21e-06 | 78 |
| GO:0009408110 | Esophagus | ESCC | response to heat | 77/8552 | 110/18723 | 2.01e-07 | 3.11e-06 | 77 |
| GO:2001237111 | Esophagus | ESCC | negative regulation of extrinsic apoptotic signaling pathway | 69/8552 | 97/18723 | 3.23e-07 | 4.55e-06 | 69 |
| GO:004206027 | Esophagus | ESCC | wound healing | 243/8552 | 422/18723 | 4.62e-07 | 6.25e-06 | 243 |
| GO:0034605111 | Esophagus | ESCC | cellular response to heat | 52/8552 | 69/18723 | 4.87e-07 | 6.53e-06 | 52 |
| GO:00380347 | Esophagus | ESCC | signal transduction in absence of ligand | 48/8552 | 65/18723 | 3.63e-06 | 3.97e-05 | 48 |
| GO:00971927 | Esophagus | ESCC | extrinsic apoptotic signaling pathway in absence of ligand | 48/8552 | 65/18723 | 3.63e-06 | 3.97e-05 | 48 |
| GO:00517831 | Esophagus | ESCC | regulation of nuclear division | 90/8552 | 139/18723 | 4.30e-06 | 4.60e-05 | 90 |
| Page: 1 2 3 4 5 6 |
| Pathway ID | Tissue | Disease Stage | Description | Gene Ratio | Bg Ratio | pvalue | p.adjust | qvalue | Count |
| hsa05022210 | Esophagus | ESCC | Pathways of neurodegeneration - multiple diseases | 318/4205 | 476/8465 | 6.10e-15 | 2.04e-13 | 1.05e-13 | 318 |
| hsa05010210 | Esophagus | ESCC | Alzheimer disease | 263/4205 | 384/8465 | 1.80e-14 | 5.47e-13 | 2.80e-13 | 263 |
| hsa04932210 | Esophagus | ESCC | Non-alcoholic fatty liver disease | 122/4205 | 155/8465 | 5.69e-14 | 1.59e-12 | 8.14e-13 | 122 |
| hsa05020210 | Esophagus | ESCC | Prion disease | 193/4205 | 273/8465 | 6.42e-13 | 1.34e-11 | 6.89e-12 | 193 |
| hsa05418211 | Esophagus | ESCC | Fluid shear stress and atherosclerosis | 109/4205 | 139/8465 | 2.00e-12 | 3.72e-11 | 1.90e-11 | 109 |
| hsa0421829 | Esophagus | ESCC | Cellular senescence | 119/4205 | 156/8465 | 5.89e-12 | 9.40e-11 | 4.81e-11 | 119 |
| hsa0516425 | Esophagus | ESCC | Influenza A | 122/4205 | 171/8465 | 5.01e-09 | 4.79e-08 | 2.45e-08 | 122 |
| hsa0493310 | Esophagus | ESCC | AGE-RAGE signaling pathway in diabetic complications | 72/4205 | 100/8465 | 4.15e-06 | 2.28e-05 | 1.17e-05 | 72 |
| hsa051629 | Esophagus | ESCC | Measles | 90/4205 | 139/8465 | 2.16e-04 | 7.87e-04 | 4.03e-04 | 90 |
| hsa051527 | Esophagus | ESCC | Tuberculosis | 111/4205 | 180/8465 | 7.14e-04 | 2.32e-03 | 1.19e-03 | 111 |
| hsa0532320 | Esophagus | ESCC | Rheumatoid arthritis | 59/4205 | 93/8465 | 4.98e-03 | 1.27e-02 | 6.52e-03 | 59 |
| hsa051339 | Esophagus | ESCC | Pertussis | 48/4205 | 76/8465 | 1.21e-02 | 2.77e-02 | 1.42e-02 | 48 |
| hsa0502238 | Esophagus | ESCC | Pathways of neurodegeneration - multiple diseases | 318/4205 | 476/8465 | 6.10e-15 | 2.04e-13 | 1.05e-13 | 318 |
| hsa0501038 | Esophagus | ESCC | Alzheimer disease | 263/4205 | 384/8465 | 1.80e-14 | 5.47e-13 | 2.80e-13 | 263 |
| hsa0493238 | Esophagus | ESCC | Non-alcoholic fatty liver disease | 122/4205 | 155/8465 | 5.69e-14 | 1.59e-12 | 8.14e-13 | 122 |
| hsa0502038 | Esophagus | ESCC | Prion disease | 193/4205 | 273/8465 | 6.42e-13 | 1.34e-11 | 6.89e-12 | 193 |
| hsa05418310 | Esophagus | ESCC | Fluid shear stress and atherosclerosis | 109/4205 | 139/8465 | 2.00e-12 | 3.72e-11 | 1.90e-11 | 109 |
| hsa0421838 | Esophagus | ESCC | Cellular senescence | 119/4205 | 156/8465 | 5.89e-12 | 9.40e-11 | 4.81e-11 | 119 |
| hsa0516435 | Esophagus | ESCC | Influenza A | 122/4205 | 171/8465 | 5.01e-09 | 4.79e-08 | 2.45e-08 | 122 |
| hsa0493317 | Esophagus | ESCC | AGE-RAGE signaling pathway in diabetic complications | 72/4205 | 100/8465 | 4.15e-06 | 2.28e-05 | 1.17e-05 | 72 |
| Page: 1 2 3 |
Top |
Cell-cell communication analysis |
| Identification of potential cell-cell interactions between two cell types and their ligand-receptor pairs for different disease states |
| Ligand | Receptor | LRpair | Pathway | Tissue | Disease Stage |
| IL1A | IL1R1_IL1RAP | IL1A_IL1R1_IL1RAP | IL1 | Cervix | CC |
| IL1A | IL1R2 | IL1A_IL1R2 | IL1 | Endometrium | AEH |
| IL1A | IL1R2 | IL1A_IL1R2 | IL1 | Endometrium | EEC |
| IL1A | IL1R2 | IL1A_IL1R2 | IL1 | HNSCC | ADJ |
| IL1A | IL1R2 | IL1A_IL1R2 | IL1 | HNSCC | OSCC |
| IL1A | IL1R1_IL1RAP | IL1A_IL1R1_IL1RAP | IL1 | HNSCC | Precancer |
| IL1A | IL1R2 | IL1A_IL1R2 | IL1 | HNSCC | Precancer |
| IL1A | IL1R2 | IL1A_IL1R2 | IL1 | Lung | AAH |
| IL1A | IL1R1_IL1RAP | IL1A_IL1R1_IL1RAP | IL1 | Lung | IAC |
| IL1A | IL1R2 | IL1A_IL1R2 | IL1 | Lung | IAC |
| IL1A | IL1R1_IL1RAP | IL1A_IL1R1_IL1RAP | IL1 | Lung | MIAC |
| IL1A | IL1R2 | IL1A_IL1R2 | IL1 | Lung | MIAC |
| IL1A | IL1R2 | IL1A_IL1R2 | IL1 | THCA | ADJ |
| Page: 1 |
Top |
Single-cell gene regulatory network inference analysis |
| Find out the significant the regulons (TFs) and the target genes of each regulon across cell types for different disease states |
| TF | Cell Type | Tissue | Disease Stage | Target Gene | RSS | Regulon Activity |
| ∗The dot plots of a searched regulon are shown for all cell subpopulations in each disease state of each tissue based on the regulon specific score inferred using pySCENIC and by calculating the average expression. |
| Page: 1 |
Top |
Somatic mutation of malignant transformation related genes |
| Annotation of somatic variants for genes involved in malignant transformation |
| Hugo Symbol | Variant Class | Variant Classification | dbSNP RS | HGVSc | HGVSp | HGVSp Short | SWISSPROT | BIOTYPE | SIFT | PolyPhen | Tumor Sample Barcode | Tissue | Histology | Sex | Age | Stage | Therapy Types | Drugs | Outcome |
| IL1A | SNV | Missense_Mutation | c.125C>A | p.Pro42Gln | p.P42Q | P01583 | protein_coding | tolerated(0.06) | benign(0.167) | TCGA-A2-A3XZ-01 | Breast | breast invasive carcinoma | Female | <65 | I/II | Chemotherapy | carboplatin | CR | |
| IL1A | deletion | Frame_Shift_Del | novel | c.263delT | p.Leu88Ter | p.L88* | P01583 | protein_coding | TCGA-D8-A27V-01 | Breast | breast invasive carcinoma | Female | <65 | I/II | Hormone Therapy | tamoxiphen | SD | ||
| IL1A | SNV | Missense_Mutation | c.217N>A | p.Val73Ile | p.V73I | P01583 | protein_coding | tolerated(0.11) | benign(0.012) | TCGA-C5-A1M5-01 | Cervix | cervical & endocervical cancer | Female | <65 | I/II | Unknown | Unknown | PD | |
| IL1A | SNV | Missense_Mutation | c.518N>T | p.Ser173Leu | p.S173L | P01583 | protein_coding | deleterious(0.04) | benign(0.356) | TCGA-Q1-A73O-01 | Cervix | cervical & endocervical cancer | Female | <65 | I/II | Chemotherapy | cisplatin | CR | |
| IL1A | SNV | Missense_Mutation | novel | c.505G>T | p.Gly169Cys | p.G169C | P01583 | protein_coding | deleterious(0.05) | probably_damaging(0.958) | TCGA-AA-3845-01 | Colorectum | colon adenocarcinoma | Female | >=65 | I/II | Unknown | Unknown | PD |
| IL1A | SNV | Missense_Mutation | novel | c.164N>T | p.Ser55Ile | p.S55I | P01583 | protein_coding | deleterious(0.03) | possibly_damaging(0.876) | TCGA-A5-A0G1-01 | Endometrium | uterine corpus endometrioid carcinoma | Female | >=65 | I/II | Unknown | Unknown | SD |
| IL1A | SNV | Missense_Mutation | novel | c.466G>A | p.Ala156Thr | p.A156T | P01583 | protein_coding | tolerated(0.26) | benign(0.013) | TCGA-D1-A17Q-01 | Endometrium | uterine corpus endometrioid carcinoma | Female | <65 | I/II | Unknown | Unknown | SD |
| IL1A | SNV | Missense_Mutation | novel | c.557N>A | p.Ile186Asn | p.I186N | P01583 | protein_coding | deleterious(0) | probably_damaging(0.993) | TCGA-DI-A1BU-01 | Endometrium | uterine corpus endometrioid carcinoma | Female | <65 | I/II | Chemotherapy | paclitaxel | SD |
| IL1A | SNV | Missense_Mutation | novel | c.416N>T | p.Ala139Val | p.A139V | P01583 | protein_coding | tolerated(0.23) | benign(0.001) | TCGA-EO-A22U-01 | Endometrium | uterine corpus endometrioid carcinoma | Female | >=65 | I/II | Unknown | Unknown | SD |
| IL1A | SNV | Missense_Mutation | novel | c.392A>C | p.Lys131Thr | p.K131T | P01583 | protein_coding | tolerated(0.15) | benign(0.277) | TCGA-EO-A3B0-01 | Endometrium | uterine corpus endometrioid carcinoma | Female | <65 | III/IV | Unknown | Unknown | SD |
| Page: 1 2 |
Top |
Related drugs of malignant transformation related genes |
| Identification of chemicals and drugs interact with genes involved in malignant transfromation |
| (DGIdb 4.0) |
| Entrez ID | Symbol | Category | Interaction Types | Drug Claim Name | Drug Name | PMIDs |
| 3552 | IL1A | CELL SURFACE, DRUGGABLE GENOME | RILONACEPT | RILONACEPT | ||
| 3552 | IL1A | CELL SURFACE, DRUGGABLE GENOME | Xilonix | BERMEKIMAB | ||
| 3552 | IL1A | CELL SURFACE, DRUGGABLE GENOME | ABT-981 | |||
| 3552 | IL1A | CELL SURFACE, DRUGGABLE GENOME | RILONACEPT | RILONACEPT | ||
| 3552 | IL1A | CELL SURFACE, DRUGGABLE GENOME | HYDROXYCHLOROQUINE | HYDROXYCHLOROQUINE | 8336306 | |
| 3552 | IL1A | CELL SURFACE, DRUGGABLE GENOME | olanzapine | OLANZAPINE | 21107309 | |
| 3552 | IL1A | CELL SURFACE, DRUGGABLE GENOME | AMG-108 | AMG-108 | ||
| 3552 | IL1A | CELL SURFACE, DRUGGABLE GENOME | IMMUNOSUPPRESSANT | 1703047 | ||
| 3552 | IL1A | CELL SURFACE, DRUGGABLE GENOME | inhibitor | CHEMBL2109653 | BERMEKIMAB | |
| 3552 | IL1A | CELL SURFACE, DRUGGABLE GENOME | MITOMYCIN-C | 8195120 |
| Page: 1 2 |

Copyright 2023-Present -The University of Texas Health Science Center at Houston |