
|
|||||
|
 | |
| |
| |
| |
| |
| |
|
Gene: IL17RC |
Gene summary for IL17RC |
| Gene information | Species | Human | Gene symbol | IL17RC | Gene ID | 84818 |
| Gene name | interleukin 17 receptor C | |
| Gene Alias | CANDF9 | |
| Cytomap | 3p25.3 | |
| Gene Type | protein-coding | GO ID | GO:0006950 | UniProtAcc | Q8NAC3 |
Top |
Malignant transformation analysis |
| Identification of the aberrant gene expression in precancerous and cancerous lesions by comparing the gene expression of stem-like cells in diseased tissues with normal stem cells |
| Entrez ID | Symbol | Replicates | Species | Organ | Tissue | Adj P-value | Log2FC | Malignancy |
| 84818 | IL17RC | LZE20T | Human | Esophagus | ESCC | 2.98e-08 | 1.67e-01 | 0.0662 |
| 84818 | IL17RC | LZE24T | Human | Esophagus | ESCC | 2.14e-11 | 2.09e-01 | 0.0596 |
| 84818 | IL17RC | P2T-E | Human | Esophagus | ESCC | 9.29e-19 | 1.61e-01 | 0.1177 |
| 84818 | IL17RC | P4T-E | Human | Esophagus | ESCC | 8.50e-07 | 1.33e-01 | 0.1323 |
| 84818 | IL17RC | P5T-E | Human | Esophagus | ESCC | 2.96e-20 | 3.41e-01 | 0.1327 |
| 84818 | IL17RC | P8T-E | Human | Esophagus | ESCC | 1.01e-10 | 1.87e-01 | 0.0889 |
| 84818 | IL17RC | P9T-E | Human | Esophagus | ESCC | 1.98e-11 | 1.59e-01 | 0.1131 |
| 84818 | IL17RC | P10T-E | Human | Esophagus | ESCC | 2.21e-09 | 9.73e-02 | 0.116 |
| 84818 | IL17RC | P11T-E | Human | Esophagus | ESCC | 4.08e-15 | 6.00e-01 | 0.1426 |
| 84818 | IL17RC | P12T-E | Human | Esophagus | ESCC | 3.58e-09 | 1.52e-01 | 0.1122 |
| 84818 | IL17RC | P15T-E | Human | Esophagus | ESCC | 2.25e-12 | 1.16e-01 | 0.1149 |
| 84818 | IL17RC | P16T-E | Human | Esophagus | ESCC | 1.45e-06 | 2.49e-01 | 0.1153 |
| 84818 | IL17RC | P17T-E | Human | Esophagus | ESCC | 3.43e-03 | 3.14e-01 | 0.1278 |
| 84818 | IL17RC | P19T-E | Human | Esophagus | ESCC | 5.44e-03 | 3.15e-01 | 0.1662 |
| 84818 | IL17RC | P20T-E | Human | Esophagus | ESCC | 2.26e-09 | 2.49e-01 | 0.1124 |
| 84818 | IL17RC | P21T-E | Human | Esophagus | ESCC | 6.86e-16 | 3.50e-01 | 0.1617 |
| 84818 | IL17RC | P22T-E | Human | Esophagus | ESCC | 1.50e-04 | 1.10e-01 | 0.1236 |
| 84818 | IL17RC | P23T-E | Human | Esophagus | ESCC | 9.39e-13 | 2.94e-01 | 0.108 |
| 84818 | IL17RC | P24T-E | Human | Esophagus | ESCC | 1.74e-16 | 3.59e-01 | 0.1287 |
| 84818 | IL17RC | P26T-E | Human | Esophagus | ESCC | 3.35e-07 | 1.38e-01 | 0.1276 |
| Page: 1 2 3 4 |
| Tissue | Expression Dynamics | Abbreviation |
| Esophagus |  | ESCC: Esophageal squamous cell carcinoma |
| HGIN: High-grade intraepithelial neoplasias | ||
| LGIN: Low-grade intraepithelial neoplasias | ||
| Liver | 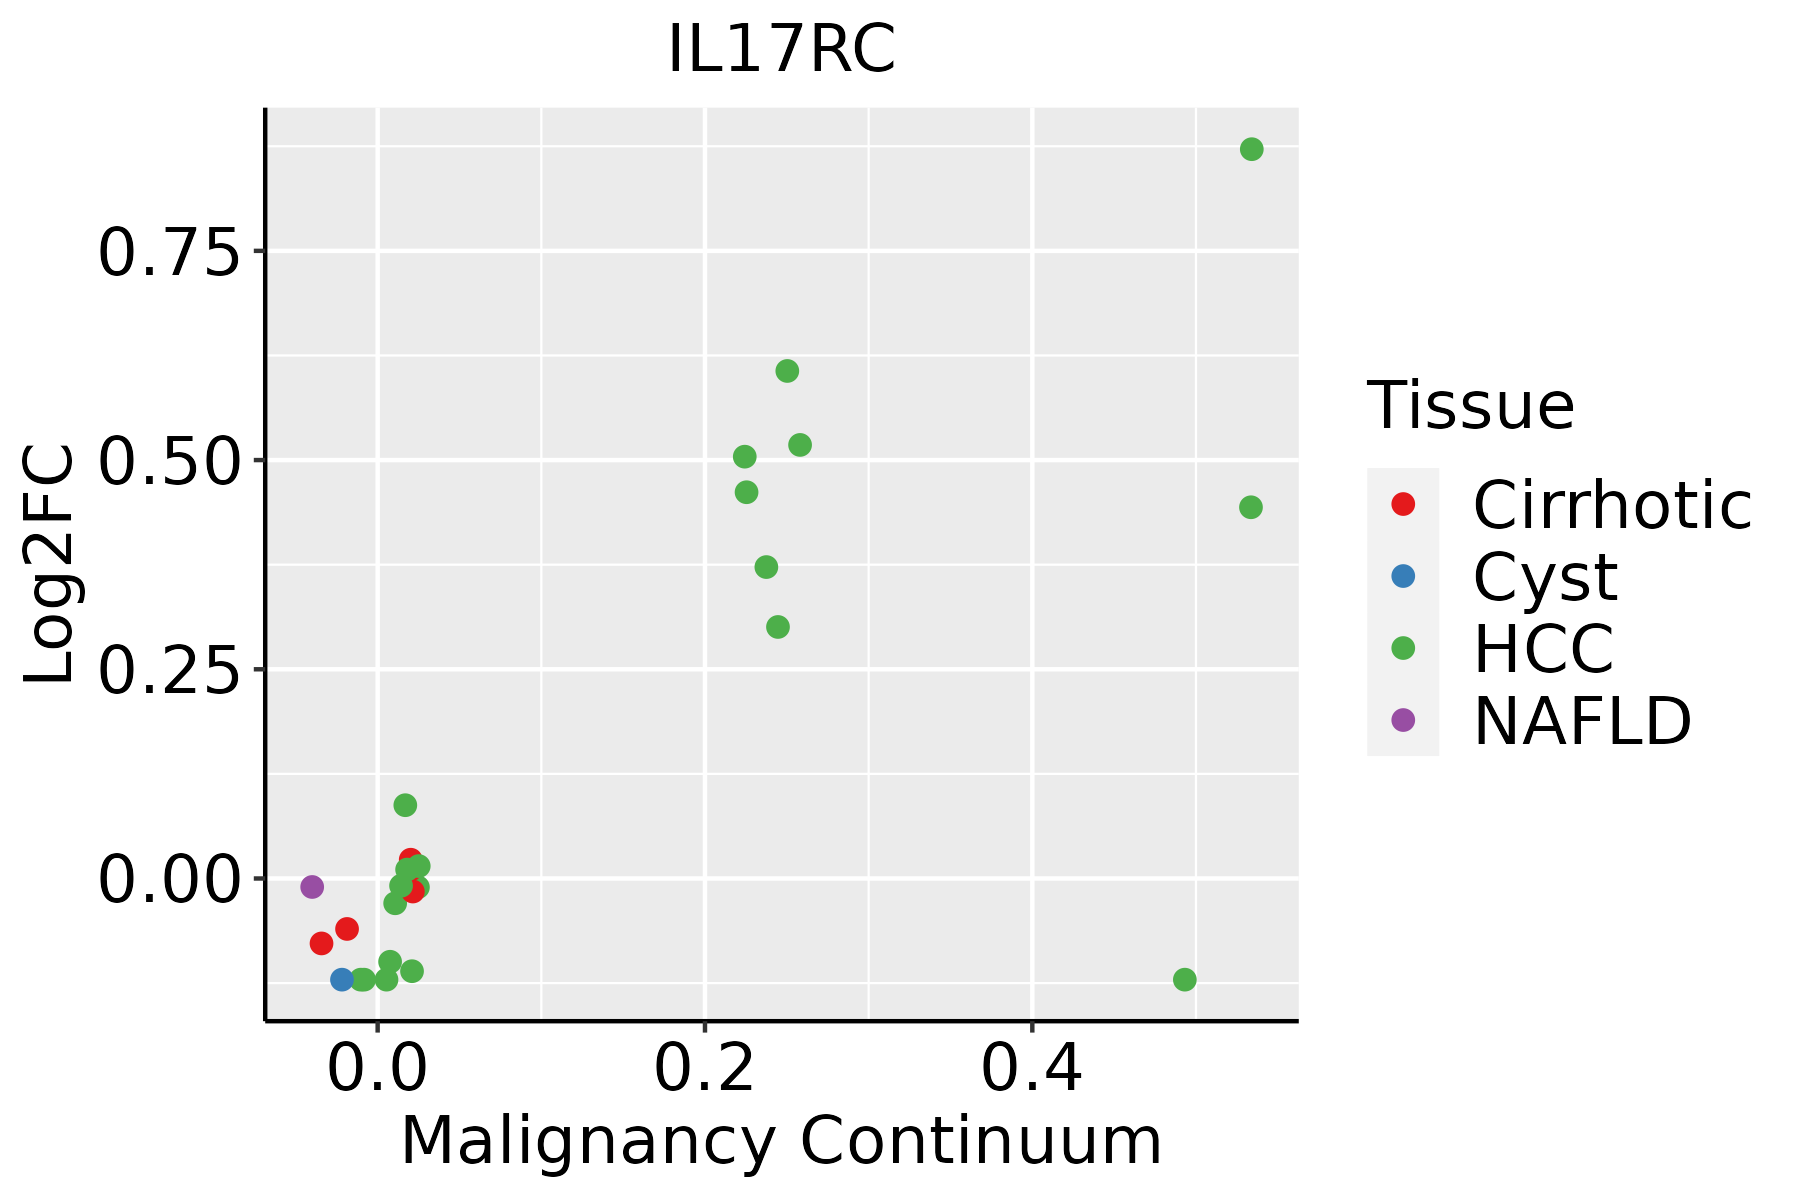 | HCC: Hepatocellular carcinoma |
| NAFLD: Non-alcoholic fatty liver disease | ||
| Oral Cavity | 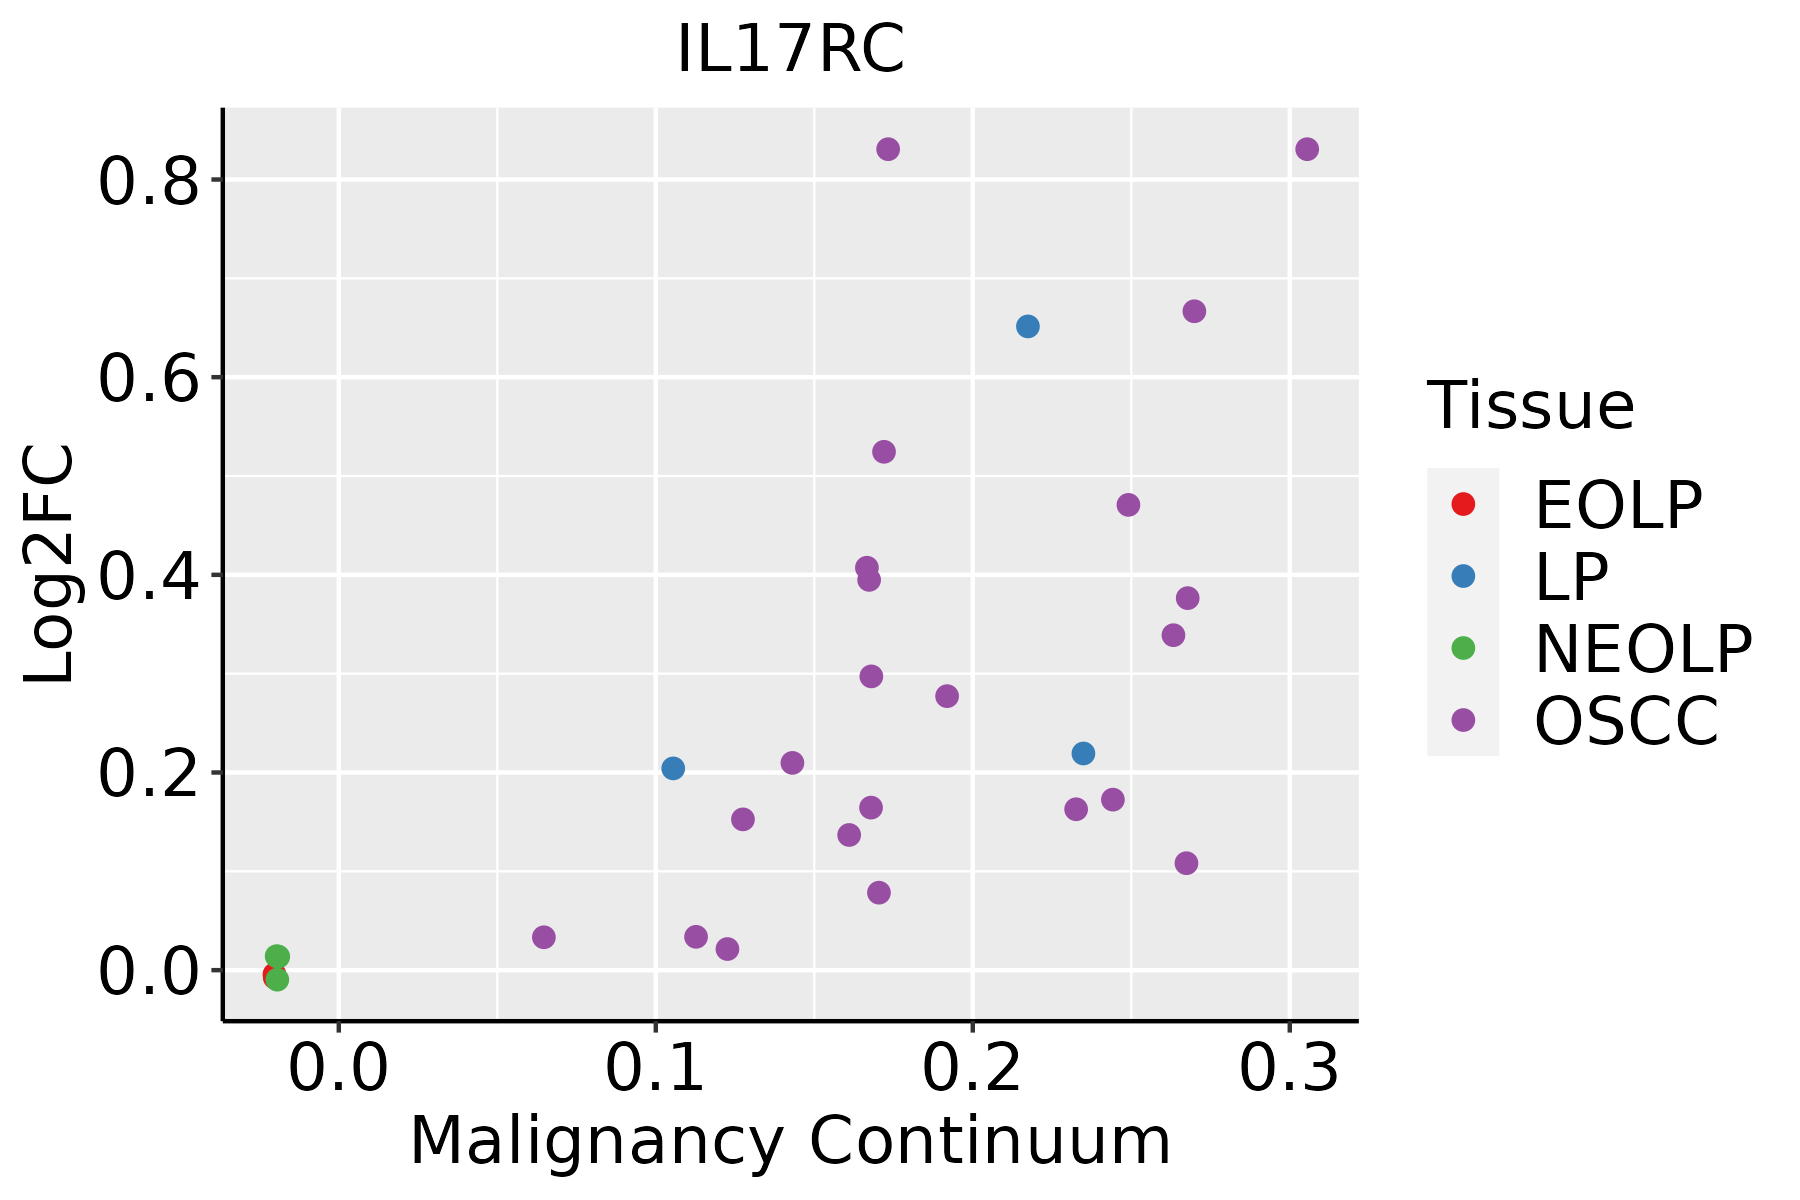 | EOLP: Erosive Oral lichen planus |
| LP: leukoplakia | ||
| NEOLP: Non-erosive oral lichen planus | ||
| OSCC: Oral squamous cell carcinoma |
| ∗log2FC in expression of this searched gene in stem-like cells from each diseased tissue sample relative to stem-like cells in normal samples in each tissue plotted against the malignancy continuum. Samples are colored based on if they are from different disease stage. |
Top |
Malignant transformation related pathway analysis |
| Find out the enriched GO biological processes and KEGG pathways involved in transition from healthy to precancer to cancer |
| Tissue | Disease Stage | Enriched GO biological Processes |
| Colorectum | AD |  |
| Colorectum | SER |  |
| Colorectum | MSS |  |
| Colorectum | MSI-H |  |
| Colorectum | FAP |  |
| ∗Top 15 enriched GO BP terms are showed in the bar plot of each disease state in each tissue. Each row represents a significant GO biological process which is colored according to the -log10(p.adjust). |
| Page: 1 2 3 4 5 6 7 8 9 |
| GO ID | Tissue | Disease Stage | Description | Gene Ratio | Bg Ratio | pvalue | p.adjust | Count |
| GO:00192214 | Oral cavity | OSCC | cytokine-mediated signaling pathway | 222/7305 | 472/18723 | 2.02e-04 | 1.35e-03 | 222 |
| Page: 1 |
| Pathway ID | Tissue | Disease Stage | Description | Gene Ratio | Bg Ratio | pvalue | p.adjust | qvalue | Count |
| hsa0465727 | Esophagus | ESCC | IL-17 signaling pathway | 66/4205 | 94/8465 | 3.93e-05 | 1.75e-04 | 8.99e-05 | 66 |
| hsa0465734 | Esophagus | ESCC | IL-17 signaling pathway | 66/4205 | 94/8465 | 3.93e-05 | 1.75e-04 | 8.99e-05 | 66 |
| hsa049362 | Liver | HCC | Alcoholic liver disease | 89/4020 | 142/8465 | 1.73e-04 | 8.53e-04 | 4.75e-04 | 89 |
| hsa049363 | Liver | HCC | Alcoholic liver disease | 89/4020 | 142/8465 | 1.73e-04 | 8.53e-04 | 4.75e-04 | 89 |
| hsa0465724 | Oral cavity | OSCC | IL-17 signaling pathway | 64/3704 | 94/8465 | 1.48e-06 | 7.87e-06 | 4.01e-06 | 64 |
| hsa049365 | Oral cavity | OSCC | Alcoholic liver disease | 78/3704 | 142/8465 | 4.53e-03 | 1.12e-02 | 5.68e-03 | 78 |
| hsa04657112 | Oral cavity | OSCC | IL-17 signaling pathway | 64/3704 | 94/8465 | 1.48e-06 | 7.87e-06 | 4.01e-06 | 64 |
| hsa0493612 | Oral cavity | OSCC | Alcoholic liver disease | 78/3704 | 142/8465 | 4.53e-03 | 1.12e-02 | 5.68e-03 | 78 |
| Page: 1 |
Top |
Cell-cell communication analysis |
| Identification of potential cell-cell interactions between two cell types and their ligand-receptor pairs for different disease states |
| Ligand | Receptor | LRpair | Pathway | Tissue | Disease Stage |
| Page: 1 |
Top |
Single-cell gene regulatory network inference analysis |
| Find out the significant the regulons (TFs) and the target genes of each regulon across cell types for different disease states |
| TF | Cell Type | Tissue | Disease Stage | Target Gene | RSS | Regulon Activity |
| ∗The dot plots of a searched regulon are shown for all cell subpopulations in each disease state of each tissue based on the regulon specific score inferred using pySCENIC and by calculating the average expression. |
| Page: 1 |
Top |
Somatic mutation of malignant transformation related genes |
| Annotation of somatic variants for genes involved in malignant transformation |
| Hugo Symbol | Variant Class | Variant Classification | dbSNP RS | HGVSc | HGVSp | HGVSp Short | SWISSPROT | BIOTYPE | SIFT | PolyPhen | Tumor Sample Barcode | Tissue | Histology | Sex | Age | Stage | Therapy Types | Drugs | Outcome |
| IL17RC | SNV | Missense_Mutation | c.392N>G | p.Val131Gly | p.V131G | Q8NAC3 | protein_coding | tolerated(0.06) | probably_damaging(0.996) | TCGA-A7-A26J-01 | Breast | breast invasive carcinoma | Female | <65 | I/II | Hormone Therapy | tamoxiphen | SD | |
| IL17RC | SNV | Missense_Mutation | novel | c.259N>A | p.Gly87Ser | p.G87S | Q8NAC3 | protein_coding | deleterious_low_confidence(0.01) | benign(0.268) | TCGA-AN-A0FK-01 | Breast | breast invasive carcinoma | Female | >=65 | III/IV | Unknown | Unknown | SD |
| IL17RC | SNV | Missense_Mutation | rs769025981 | c.620G>T | p.Arg207Leu | p.R207L | Q8NAC3 | protein_coding | deleterious(0.02) | benign(0.41) | TCGA-AN-A0FS-01 | Breast | breast invasive carcinoma | Female | <65 | I/II | Unknown | Unknown | SD |
| IL17RC | SNV | Missense_Mutation | c.1655N>A | p.Ala552Glu | p.A552E | Q8NAC3 | protein_coding | tolerated(0.12) | benign(0.409) | TCGA-AR-A0TW-01 | Breast | breast invasive carcinoma | Female | <65 | III/IV | Chemotherapy | doxorubicin | PD | |
| IL17RC | insertion | Frame_Shift_Ins | novel | c.1094_1095insACTCATTAAAAGTCTGTTGAATGGG | p.Arg366LeufsTer80 | p.R366Lfs*80 | Q8NAC3 | protein_coding | TCGA-A2-A0D1-01 | Breast | breast invasive carcinoma | Female | >=65 | I/II | Chemotherapy | taxotere | SD | ||
| IL17RC | insertion | Frame_Shift_Ins | novel | c.260_261insTGCA | p.Lys88AlafsTer30 | p.K88Afs*30 | Q8NAC3 | protein_coding | TCGA-AN-A0FK-01 | Breast | breast invasive carcinoma | Female | >=65 | III/IV | Unknown | Unknown | SD | ||
| IL17RC | insertion | Frame_Shift_Ins | novel | c.390_391insTCCCAGCCAG | p.Val131SerfsTer25 | p.V131Sfs*25 | Q8NAC3 | protein_coding | TCGA-AO-A0J9-01 | Breast | breast invasive carcinoma | Female | <65 | III/IV | Chemotherapy | cyclophosphamide | PD | ||
| IL17RC | SNV | Missense_Mutation | c.898G>A | p.Glu300Lys | p.E300K | Q8NAC3 | protein_coding | tolerated(0.11) | benign(0.194) | TCGA-C5-A8YR-01 | Cervix | cervical & endocervical cancer | Female | <65 | I/II | Unknown | Unknown | PD | |
| IL17RC | SNV | Missense_Mutation | rs201975186 | c.391N>A | p.Val131Met | p.V131M | Q8NAC3 | protein_coding | deleterious(0.01) | probably_damaging(0.997) | TCGA-A6-6780-01 | Colorectum | colon adenocarcinoma | Male | >=65 | I/II | Unknown | Unknown | SD |
| IL17RC | SNV | Missense_Mutation | novel | c.172N>G | p.Ser58Gly | p.S58G | Q8NAC3 | protein_coding | tolerated_low_confidence(0.4) | benign(0.001) | TCGA-AA-3492-01 | Colorectum | colon adenocarcinoma | Female | >=65 | I/II | Unknown | Unknown | SD |
| Page: 1 2 3 4 5 6 |
Top |
Related drugs of malignant transformation related genes |
| Identification of chemicals and drugs interact with genes involved in malignant transfromation |
| (DGIdb 4.0) |
| Entrez ID | Symbol | Category | Interaction Types | Drug Claim Name | Drug Name | PMIDs |
| 84818 | IL17RC | DRUGGABLE GENOME | IL-17 | 16785495 |
| Page: 1 |

Copyright 2023-Present -The University of Texas Health Science Center at Houston |