
|
|||||
|
 | |
| |
| |
| |
| |
| |
|
Gene: IL17RA |
Gene summary for IL17RA |
| Gene information | Species | Human | Gene symbol | IL17RA | Gene ID | 23765 |
| Gene name | interleukin 17 receptor A | |
| Gene Alias | CANDF5 | |
| Cytomap | 22q11.1 | |
| Gene Type | protein-coding | GO ID | GO:0001775 | UniProtAcc | Q96F46 |
Top |
Malignant transformation analysis |
| Identification of the aberrant gene expression in precancerous and cancerous lesions by comparing the gene expression of stem-like cells in diseased tissues with normal stem cells |
| Entrez ID | Symbol | Replicates | Species | Organ | Tissue | Adj P-value | Log2FC | Malignancy |
| 23765 | IL17RA | LZE4T | Human | Esophagus | ESCC | 6.83e-07 | 8.67e-02 | 0.0811 |
| 23765 | IL17RA | LZE20T | Human | Esophagus | ESCC | 2.93e-04 | 8.79e-02 | 0.0662 |
| 23765 | IL17RA | LZE22T | Human | Esophagus | ESCC | 3.81e-03 | 2.97e-01 | 0.068 |
| 23765 | IL17RA | LZE24T | Human | Esophagus | ESCC | 1.69e-12 | 2.39e-01 | 0.0596 |
| 23765 | IL17RA | LZE21T | Human | Esophagus | ESCC | 4.66e-05 | 1.65e-01 | 0.0655 |
| 23765 | IL17RA | P1T-E | Human | Esophagus | ESCC | 4.54e-05 | 3.00e-01 | 0.0875 |
| 23765 | IL17RA | P2T-E | Human | Esophagus | ESCC | 2.24e-22 | 3.35e-01 | 0.1177 |
| 23765 | IL17RA | P4T-E | Human | Esophagus | ESCC | 1.64e-30 | 4.69e-01 | 0.1323 |
| 23765 | IL17RA | P5T-E | Human | Esophagus | ESCC | 5.63e-20 | 3.83e-01 | 0.1327 |
| 23765 | IL17RA | P8T-E | Human | Esophagus | ESCC | 1.77e-12 | 2.04e-01 | 0.0889 |
| 23765 | IL17RA | P9T-E | Human | Esophagus | ESCC | 1.22e-18 | 2.67e-01 | 0.1131 |
| 23765 | IL17RA | P10T-E | Human | Esophagus | ESCC | 4.23e-17 | 2.81e-01 | 0.116 |
| 23765 | IL17RA | P11T-E | Human | Esophagus | ESCC | 1.70e-10 | 3.88e-01 | 0.1426 |
| 23765 | IL17RA | P12T-E | Human | Esophagus | ESCC | 2.19e-18 | 2.92e-01 | 0.1122 |
| 23765 | IL17RA | P15T-E | Human | Esophagus | ESCC | 1.58e-20 | 2.66e-01 | 0.1149 |
| 23765 | IL17RA | P16T-E | Human | Esophagus | ESCC | 1.18e-20 | 3.81e-01 | 0.1153 |
| 23765 | IL17RA | P19T-E | Human | Esophagus | ESCC | 9.48e-03 | 1.52e-01 | 0.1662 |
| 23765 | IL17RA | P20T-E | Human | Esophagus | ESCC | 1.74e-16 | 2.08e-01 | 0.1124 |
| 23765 | IL17RA | P21T-E | Human | Esophagus | ESCC | 4.79e-10 | 1.72e-01 | 0.1617 |
| 23765 | IL17RA | P22T-E | Human | Esophagus | ESCC | 1.82e-20 | 3.93e-01 | 0.1236 |
| Page: 1 2 3 4 5 |
| Tissue | Expression Dynamics | Abbreviation |
| Esophagus | 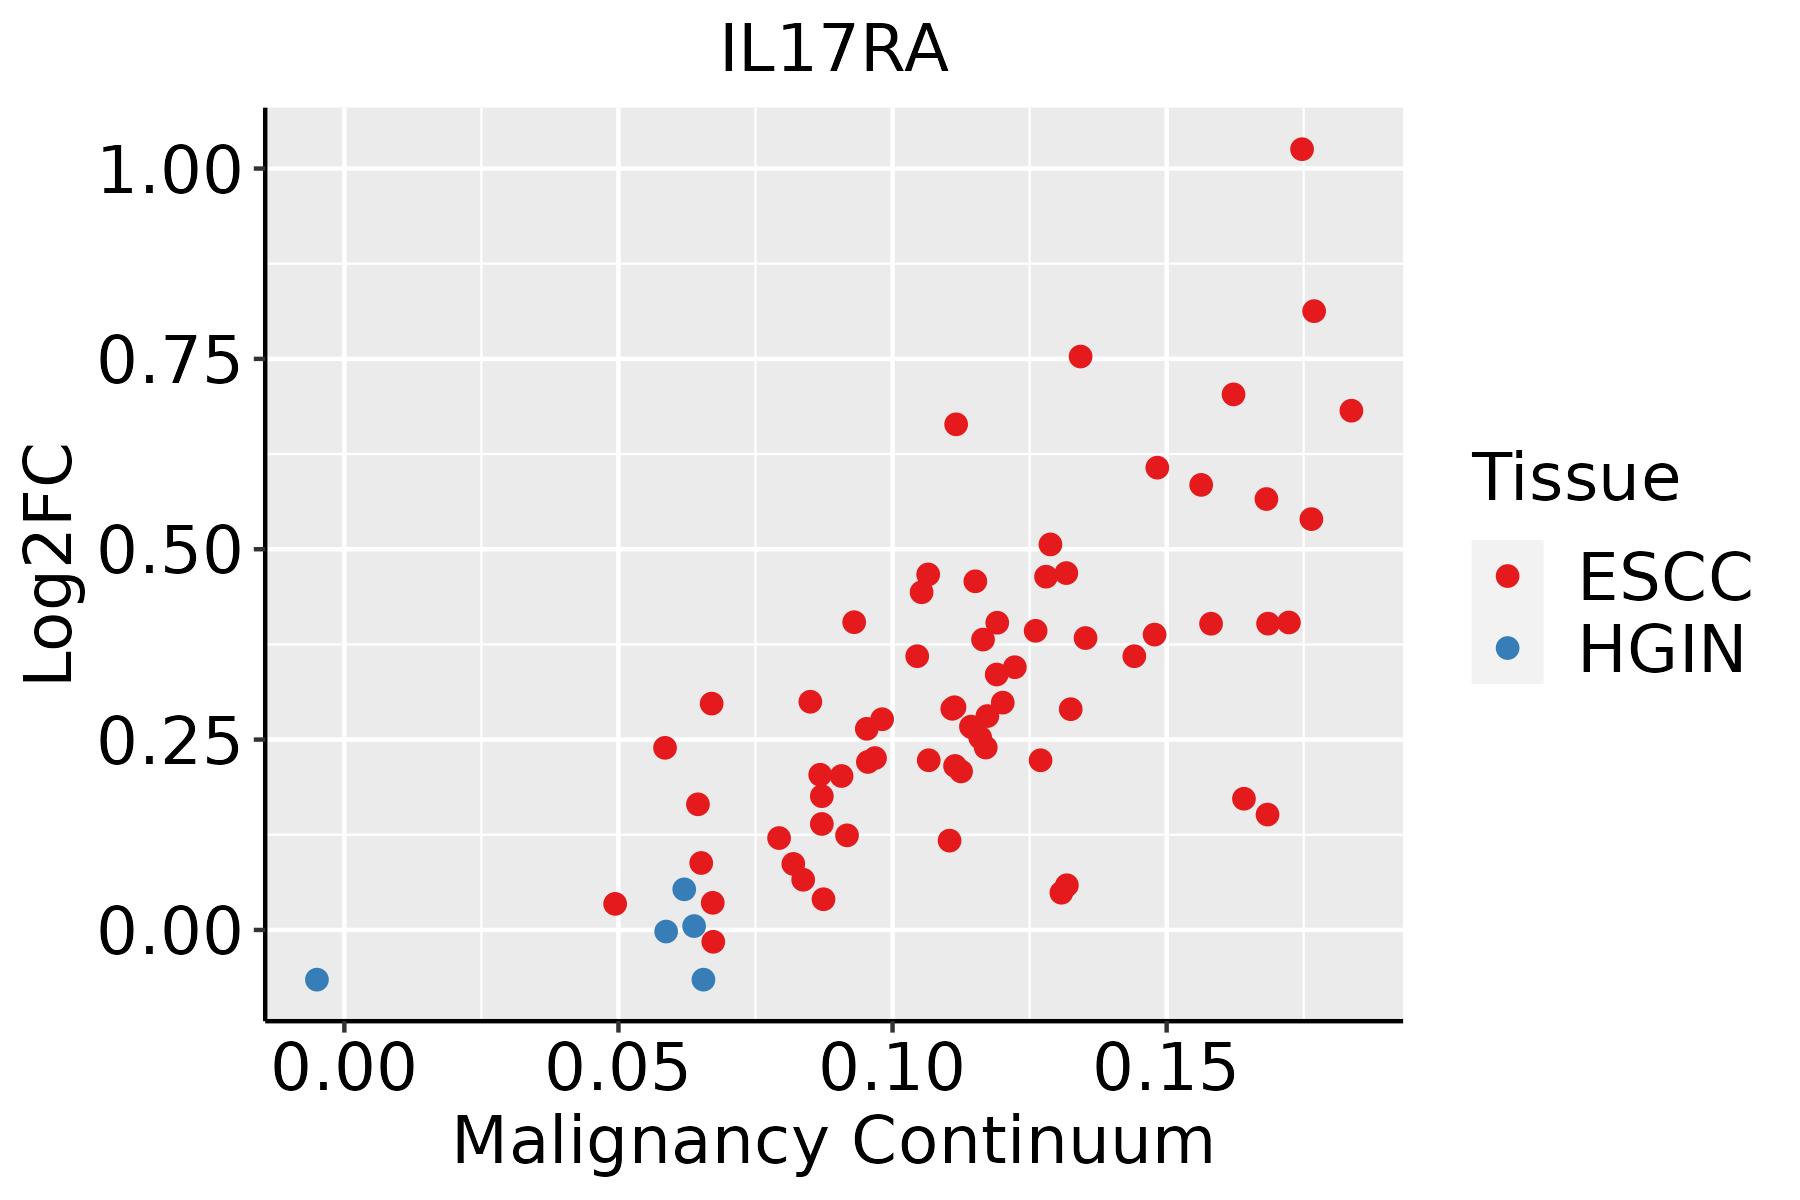 | ESCC: Esophageal squamous cell carcinoma |
| HGIN: High-grade intraepithelial neoplasias | ||
| LGIN: Low-grade intraepithelial neoplasias | ||
| Liver | 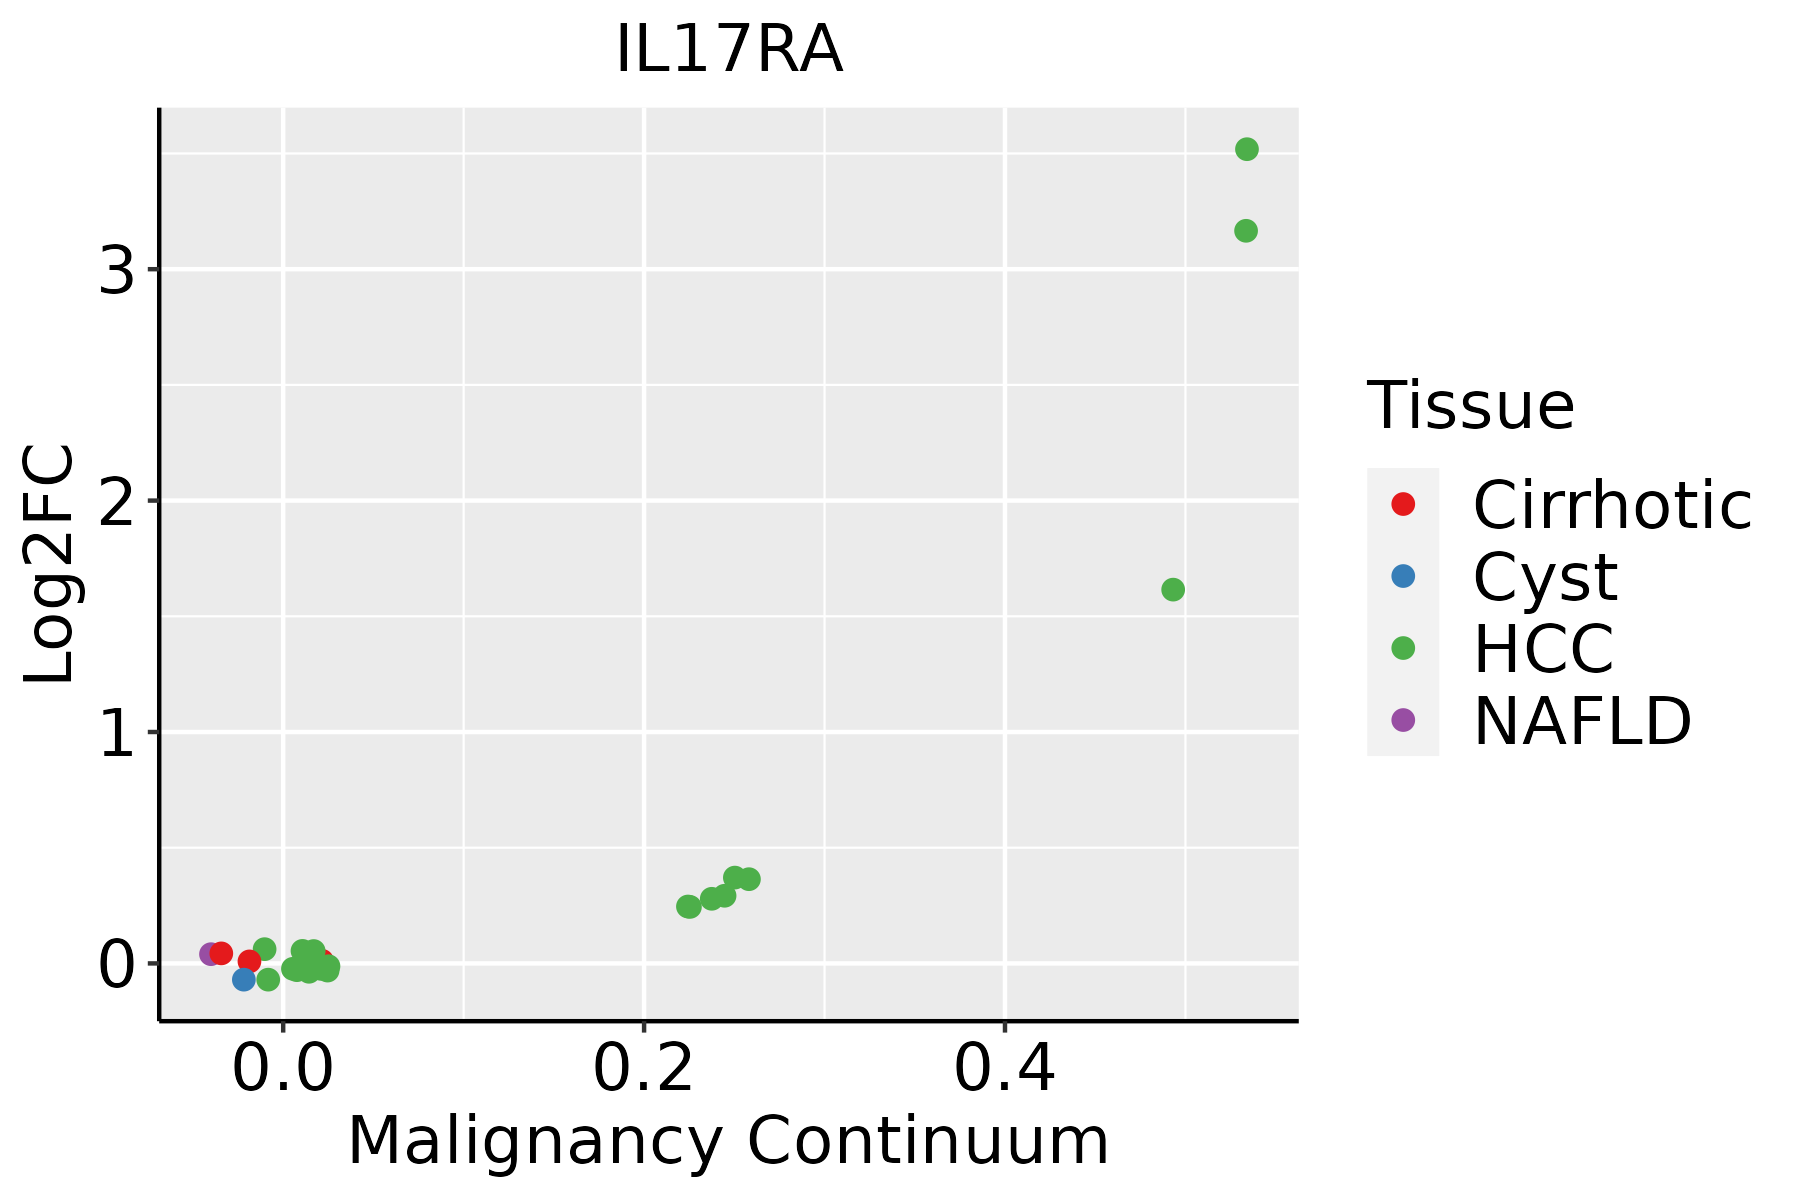 | HCC: Hepatocellular carcinoma |
| NAFLD: Non-alcoholic fatty liver disease | ||
| Oral Cavity | 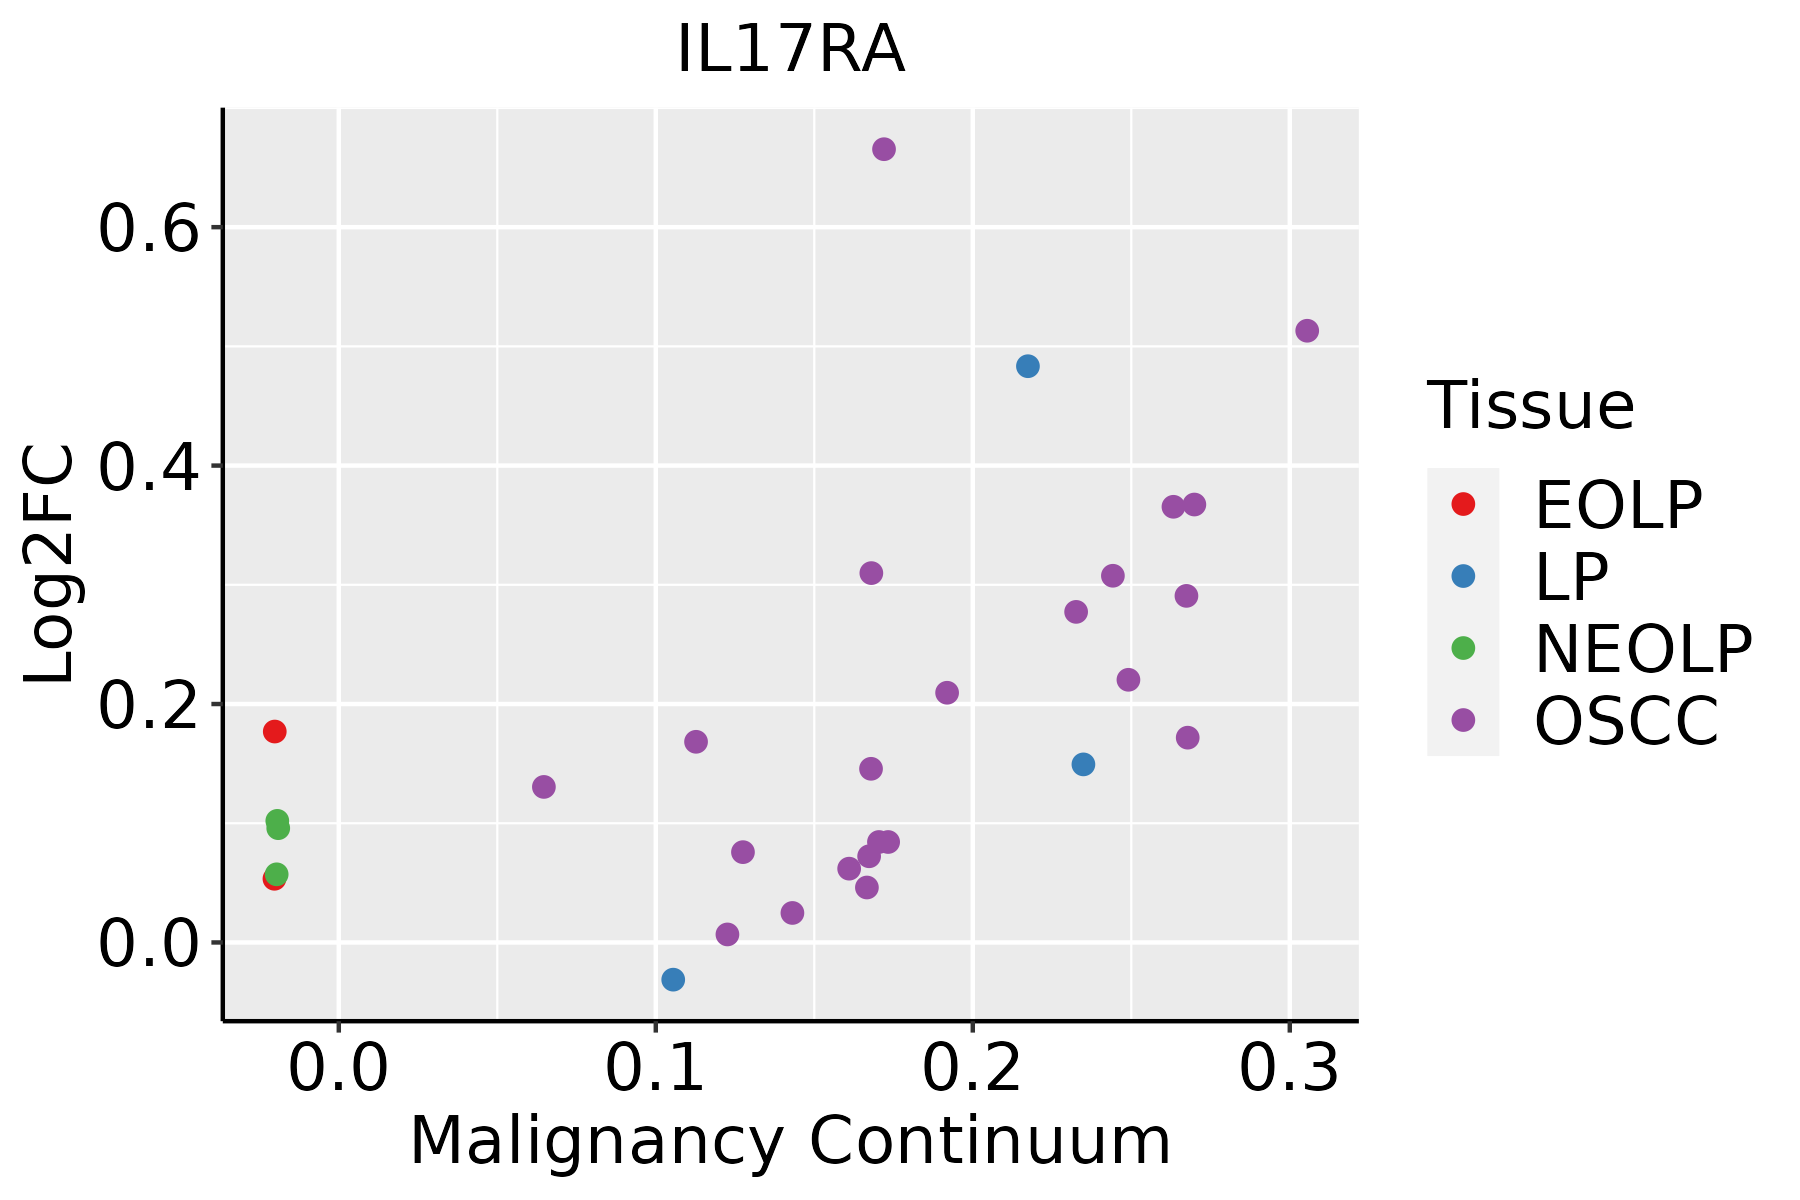 | EOLP: Erosive Oral lichen planus |
| LP: leukoplakia | ||
| NEOLP: Non-erosive oral lichen planus | ||
| OSCC: Oral squamous cell carcinoma | ||
| Thyroid | 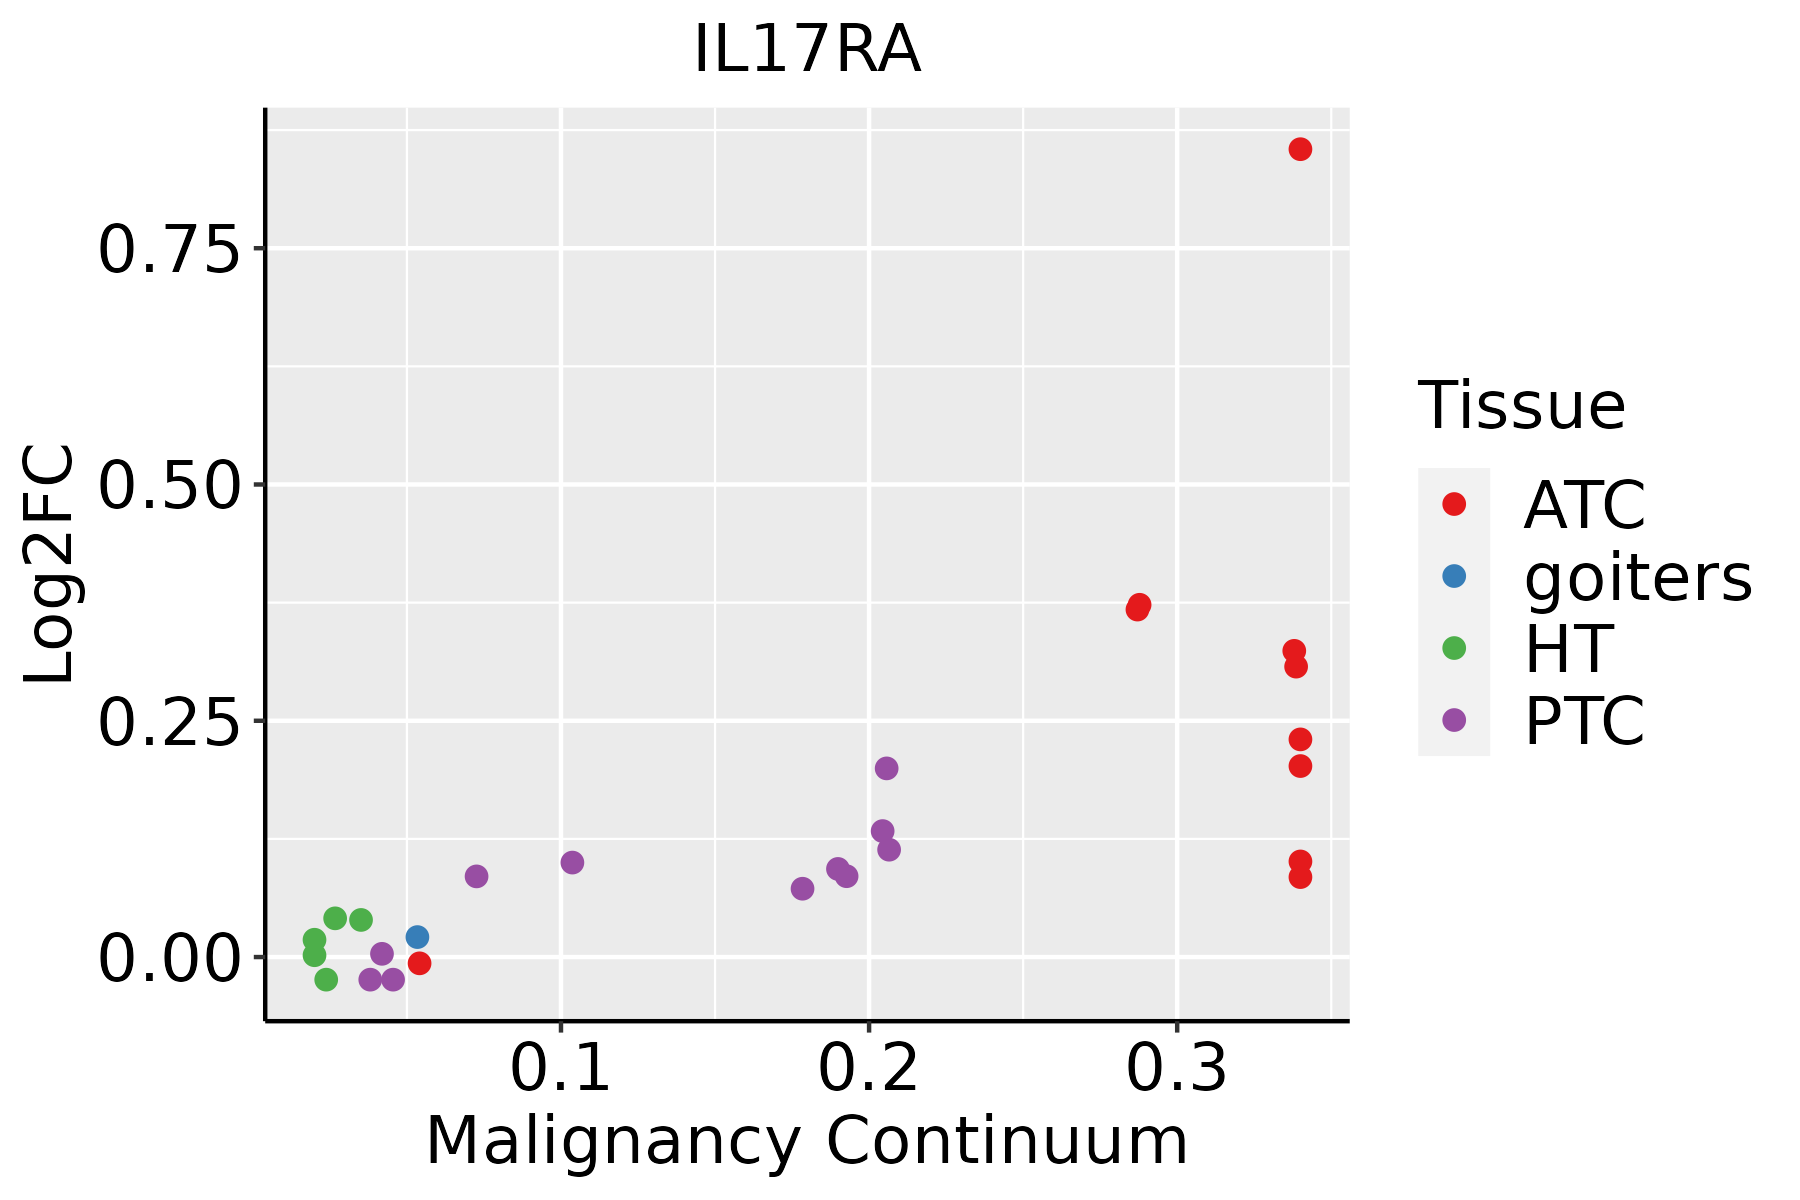 | ATC: Anaplastic thyroid cancer |
| HT: Hashimoto's thyroiditis | ||
| PTC: Papillary thyroid cancer |
| ∗log2FC in expression of this searched gene in stem-like cells from each diseased tissue sample relative to stem-like cells in normal samples in each tissue plotted against the malignancy continuum. Samples are colored based on if they are from different disease stage. |
Top |
Malignant transformation related pathway analysis |
| Find out the enriched GO biological processes and KEGG pathways involved in transition from healthy to precancer to cancer |
| Tissue | Disease Stage | Enriched GO biological Processes |
| Colorectum | AD |  |
| Colorectum | SER |  |
| Colorectum | MSS |  |
| Colorectum | MSI-H |  |
| Colorectum | FAP |  |
| ∗Top 15 enriched GO BP terms are showed in the bar plot of each disease state in each tissue. Each row represents a significant GO biological process which is colored according to the -log10(p.adjust). |
| Page: 1 2 3 4 5 6 7 8 9 |
| GO ID | Tissue | Disease Stage | Description | Gene Ratio | Bg Ratio | pvalue | p.adjust | Count |
| GO:000961518 | Esophagus | ESCC | response to virus | 238/8552 | 367/18723 | 6.65e-14 | 3.32e-12 | 238 |
| GO:000181916 | Esophagus | ESCC | positive regulation of cytokine production | 244/8552 | 467/18723 | 2.29e-03 | 1.01e-02 | 244 |
| GO:000961511 | Liver | HCC | response to virus | 210/7958 | 367/18723 | 7.32e-09 | 1.86e-07 | 210 |
| GO:000961515 | Oral cavity | OSCC | response to virus | 215/7305 | 367/18723 | 1.63e-14 | 9.41e-13 | 215 |
| GO:00321037 | Oral cavity | OSCC | positive regulation of response to external stimulus | 203/7305 | 427/18723 | 1.79e-04 | 1.22e-03 | 203 |
| GO:00192214 | Oral cavity | OSCC | cytokine-mediated signaling pathway | 222/7305 | 472/18723 | 2.02e-04 | 1.35e-03 | 222 |
| GO:000181910 | Oral cavity | OSCC | positive regulation of cytokine production | 213/7305 | 467/18723 | 1.93e-03 | 8.96e-03 | 213 |
| GO:00313495 | Oral cavity | OSCC | positive regulation of defense response | 127/7305 | 278/18723 | 1.32e-02 | 4.39e-02 | 127 |
| GO:000961516 | Oral cavity | LP | response to virus | 143/4623 | 367/18723 | 7.42e-10 | 3.52e-08 | 143 |
| GO:000961520 | Thyroid | PTC | response to virus | 162/5968 | 367/18723 | 4.52e-07 | 7.41e-06 | 162 |
| GO:003210316 | Thyroid | PTC | positive regulation of response to external stimulus | 167/5968 | 427/18723 | 8.31e-04 | 5.13e-03 | 167 |
| GO:0009615111 | Thyroid | ATC | response to virus | 173/6293 | 367/18723 | 4.23e-08 | 7.71e-07 | 173 |
| GO:003210324 | Thyroid | ATC | positive regulation of response to external stimulus | 178/6293 | 427/18723 | 2.61e-04 | 1.67e-03 | 178 |
| GO:000181924 | Thyroid | ATC | positive regulation of cytokine production | 189/6293 | 467/18723 | 1.00e-03 | 5.31e-03 | 189 |
| Page: 1 |
| Pathway ID | Tissue | Disease Stage | Description | Gene Ratio | Bg Ratio | pvalue | p.adjust | qvalue | Count |
| hsa0465727 | Esophagus | ESCC | IL-17 signaling pathway | 66/4205 | 94/8465 | 3.93e-05 | 1.75e-04 | 8.99e-05 | 66 |
| hsa0465734 | Esophagus | ESCC | IL-17 signaling pathway | 66/4205 | 94/8465 | 3.93e-05 | 1.75e-04 | 8.99e-05 | 66 |
| hsa049362 | Liver | HCC | Alcoholic liver disease | 89/4020 | 142/8465 | 1.73e-04 | 8.53e-04 | 4.75e-04 | 89 |
| hsa049363 | Liver | HCC | Alcoholic liver disease | 89/4020 | 142/8465 | 1.73e-04 | 8.53e-04 | 4.75e-04 | 89 |
| hsa0465724 | Oral cavity | OSCC | IL-17 signaling pathway | 64/3704 | 94/8465 | 1.48e-06 | 7.87e-06 | 4.01e-06 | 64 |
| hsa049365 | Oral cavity | OSCC | Alcoholic liver disease | 78/3704 | 142/8465 | 4.53e-03 | 1.12e-02 | 5.68e-03 | 78 |
| hsa04657112 | Oral cavity | OSCC | IL-17 signaling pathway | 64/3704 | 94/8465 | 1.48e-06 | 7.87e-06 | 4.01e-06 | 64 |
| hsa0493612 | Oral cavity | OSCC | Alcoholic liver disease | 78/3704 | 142/8465 | 4.53e-03 | 1.12e-02 | 5.68e-03 | 78 |
| hsa0465725 | Oral cavity | LP | IL-17 signaling pathway | 47/2418 | 94/8465 | 8.45e-06 | 6.25e-05 | 4.03e-05 | 47 |
| hsa0465733 | Oral cavity | LP | IL-17 signaling pathway | 47/2418 | 94/8465 | 8.45e-06 | 6.25e-05 | 4.03e-05 | 47 |
| Page: 1 |
Top |
Cell-cell communication analysis |
| Identification of potential cell-cell interactions between two cell types and their ligand-receptor pairs for different disease states |
| Ligand | Receptor | LRpair | Pathway | Tissue | Disease Stage |
| Page: 1 |
Top |
Single-cell gene regulatory network inference analysis |
| Find out the significant the regulons (TFs) and the target genes of each regulon across cell types for different disease states |
| TF | Cell Type | Tissue | Disease Stage | Target Gene | RSS | Regulon Activity |
| ∗The dot plots of a searched regulon are shown for all cell subpopulations in each disease state of each tissue based on the regulon specific score inferred using pySCENIC and by calculating the average expression. |
| Page: 1 |
Top |
Somatic mutation of malignant transformation related genes |
| Annotation of somatic variants for genes involved in malignant transformation |
| Hugo Symbol | Variant Class | Variant Classification | dbSNP RS | HGVSc | HGVSp | HGVSp Short | SWISSPROT | BIOTYPE | SIFT | PolyPhen | Tumor Sample Barcode | Tissue | Histology | Sex | Age | Stage | Therapy Types | Drugs | Outcome |
| IL17RA | SNV | Missense_Mutation | c.388N>C | p.Glu130Gln | p.E130Q | Q96F46 | protein_coding | tolerated(0.06) | benign(0.012) | TCGA-B6-A0IK-01 | Breast | breast invasive carcinoma | Female | <65 | III/IV | Unknown | Unknown | PD | |
| IL17RA | SNV | Missense_Mutation | c.632N>T | p.Thr211Ile | p.T211I | Q96F46 | protein_coding | tolerated(0.13) | benign(0.202) | TCGA-EW-A1IZ-01 | Breast | breast invasive carcinoma | Female | <65 | III/IV | Chemotherapy | taxotere | SD | |
| IL17RA | SNV | Missense_Mutation | novel | c.2584N>A | p.Glu862Lys | p.E862K | Q96F46 | protein_coding | tolerated_low_confidence(0.34) | possibly_damaging(0.811) | TCGA-PE-A5DE-01 | Breast | breast invasive carcinoma | Female | <65 | I/II | Chemotherapy | taxotere | CR |
| IL17RA | insertion | Frame_Shift_Ins | novel | c.1056_1057insCCTTCCGGTTGGGGCCTCAGCCCTTGCCTGCCCCACCATGACCCTA | p.Glu353ProfsTer20 | p.E353Pfs*20 | Q96F46 | protein_coding | TCGA-B6-A0I8-01 | Breast | breast invasive carcinoma | Female | <65 | I/II | Unknown | Unknown | PD | ||
| IL17RA | SNV | Missense_Mutation | novel | c.739N>A | p.Glu247Lys | p.E247K | Q96F46 | protein_coding | tolerated(0.6) | benign(0.003) | TCGA-DS-A1OB-01 | Cervix | cervical & endocervical cancer | Female | <65 | I/II | Chemotherapy | carboplatin | PD |
| IL17RA | SNV | Missense_Mutation | novel | c.1405T>C | p.Cys469Arg | p.C469R | Q96F46 | protein_coding | tolerated(0.22) | possibly_damaging(0.739) | TCGA-EA-A410-01 | Cervix | cervical & endocervical cancer | Female | <65 | I/II | Unknown | Unknown | SD |
| IL17RA | SNV | Missense_Mutation | novel | c.1466A>G | p.Asp489Gly | p.D489G | Q96F46 | protein_coding | deleterious(0) | probably_damaging(0.993) | TCGA-FU-A23L-01 | Cervix | cervical & endocervical cancer | Female | <65 | I/II | Chemotherapy | cisplatin | CR |
| IL17RA | SNV | Missense_Mutation | c.388G>C | p.Glu130Gln | p.E130Q | Q96F46 | protein_coding | tolerated(0.06) | benign(0.012) | TCGA-MA-AA41-01 | Cervix | cervical & endocervical cancer | Female | <65 | I/II | Unknown | Unknown | SD | |
| IL17RA | SNV | Missense_Mutation | rs200201810 | c.1862N>T | p.Ala621Val | p.A621V | Q96F46 | protein_coding | tolerated(0.3) | benign(0.003) | TCGA-A6-6780-01 | Colorectum | colon adenocarcinoma | Male | >=65 | I/II | Unknown | Unknown | SD |
| IL17RA | SNV | Missense_Mutation | rs151220068 | c.581C>T | p.Thr194Met | p.T194M | Q96F46 | protein_coding | tolerated(0.12) | possibly_damaging(0.536) | TCGA-A6-6781-01 | Colorectum | colon adenocarcinoma | Male | <65 | III/IV | Chemotherapy | oxaliplatin | SD |
| Page: 1 2 3 4 5 6 7 |
Top |
Related drugs of malignant transformation related genes |
| Identification of chemicals and drugs interact with genes involved in malignant transfromation |
| (DGIdb 4.0) |
| Entrez ID | Symbol | Category | Interaction Types | Drug Claim Name | Drug Name | PMIDs |
| 23765 | IL17RA | DRUGGABLE GENOME | Tumor necrosis factor alpha (TNF-alpha) inhibitors | 27670766 | ||
| 23765 | IL17RA | DRUGGABLE GENOME | CNTO-6785 | |||
| 23765 | IL17RA | DRUGGABLE GENOME | antibody | 187051841 | BRODALUMAB | |
| 23765 | IL17RA | DRUGGABLE GENOME | Brodalumab | BRODALUMAB | ||
| 23765 | IL17RA | DRUGGABLE GENOME | antagonist | CHEMBL1742996 | BRODALUMAB |
| Page: 1 |

Copyright 2023-Present -The University of Texas Health Science Center at Houston |