
|
|||||
|
 | |
| |
| |
| |
| |
| |
|
Gene: IL15 |
Gene summary for IL15 |
| Gene information | Species | Human | Gene symbol | IL15 | Gene ID | 3600 |
| Gene name | interleukin 15 | |
| Gene Alias | IL-15 | |
| Cytomap | 4q31.21 | |
| Gene Type | protein-coding | GO ID | GO:0001659 | UniProtAcc | P40933 |
Top |
Malignant transformation analysis |
| Identification of the aberrant gene expression in precancerous and cancerous lesions by comparing the gene expression of stem-like cells in diseased tissues with normal stem cells |
| Entrez ID | Symbol | Replicates | Species | Organ | Tissue | Adj P-value | Log2FC | Malignancy |
| 3600 | IL15 | LZE8T | Human | Esophagus | ESCC | 2.66e-02 | 1.08e-01 | 0.067 |
| 3600 | IL15 | P2T-E | Human | Esophagus | ESCC | 3.82e-13 | 2.67e-01 | 0.1177 |
| 3600 | IL15 | P8T-E | Human | Esophagus | ESCC | 9.47e-12 | 1.19e-01 | 0.0889 |
| 3600 | IL15 | P9T-E | Human | Esophagus | ESCC | 8.78e-08 | 9.24e-02 | 0.1131 |
| 3600 | IL15 | P11T-E | Human | Esophagus | ESCC | 2.19e-09 | 4.66e-01 | 0.1426 |
| 3600 | IL15 | P12T-E | Human | Esophagus | ESCC | 3.95e-07 | 1.54e-01 | 0.1122 |
| 3600 | IL15 | P15T-E | Human | Esophagus | ESCC | 9.53e-03 | 7.48e-02 | 0.1149 |
| 3600 | IL15 | P17T-E | Human | Esophagus | ESCC | 1.47e-02 | 2.18e-01 | 0.1278 |
| 3600 | IL15 | P19T-E | Human | Esophagus | ESCC | 2.67e-03 | 2.14e-01 | 0.1662 |
| 3600 | IL15 | P20T-E | Human | Esophagus | ESCC | 9.82e-06 | 1.66e-01 | 0.1124 |
| 3600 | IL15 | P22T-E | Human | Esophagus | ESCC | 2.79e-09 | 8.32e-02 | 0.1236 |
| 3600 | IL15 | P23T-E | Human | Esophagus | ESCC | 8.86e-05 | 9.75e-02 | 0.108 |
| 3600 | IL15 | P24T-E | Human | Esophagus | ESCC | 9.16e-10 | 2.18e-01 | 0.1287 |
| 3600 | IL15 | P26T-E | Human | Esophagus | ESCC | 1.18e-12 | 1.21e-01 | 0.1276 |
| 3600 | IL15 | P27T-E | Human | Esophagus | ESCC | 4.12e-02 | 7.18e-03 | 0.1055 |
| 3600 | IL15 | P32T-E | Human | Esophagus | ESCC | 6.16e-07 | 1.10e-01 | 0.1666 |
| 3600 | IL15 | P36T-E | Human | Esophagus | ESCC | 2.81e-13 | 4.92e-01 | 0.1187 |
| 3600 | IL15 | P37T-E | Human | Esophagus | ESCC | 4.28e-04 | 1.87e-01 | 0.1371 |
| 3600 | IL15 | P40T-E | Human | Esophagus | ESCC | 4.83e-07 | 2.06e-01 | 0.109 |
| 3600 | IL15 | P42T-E | Human | Esophagus | ESCC | 3.88e-04 | 1.66e-01 | 0.1175 |
| Page: 1 2 3 |
| Tissue | Expression Dynamics | Abbreviation |
| Esophagus | 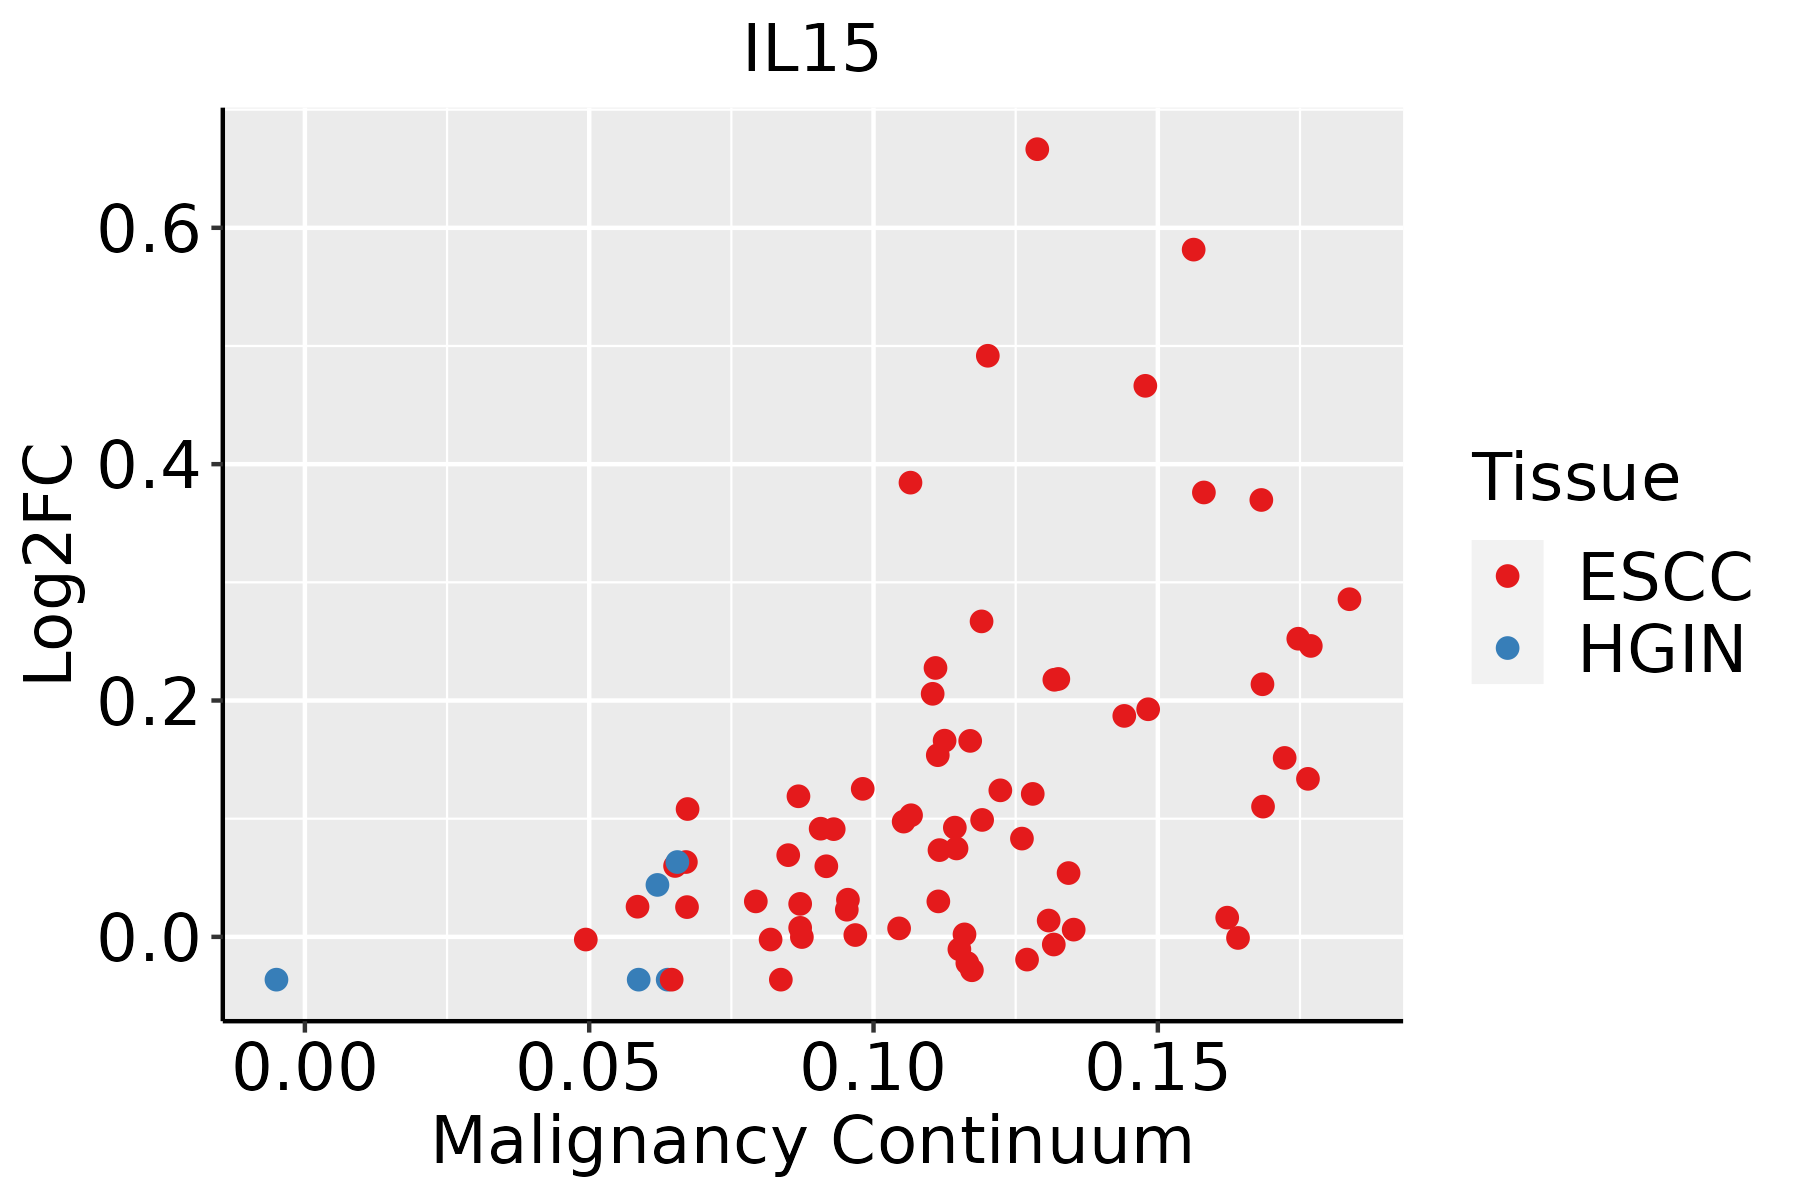 | ESCC: Esophageal squamous cell carcinoma |
| HGIN: High-grade intraepithelial neoplasias | ||
| LGIN: Low-grade intraepithelial neoplasias | ||
| Oral Cavity | 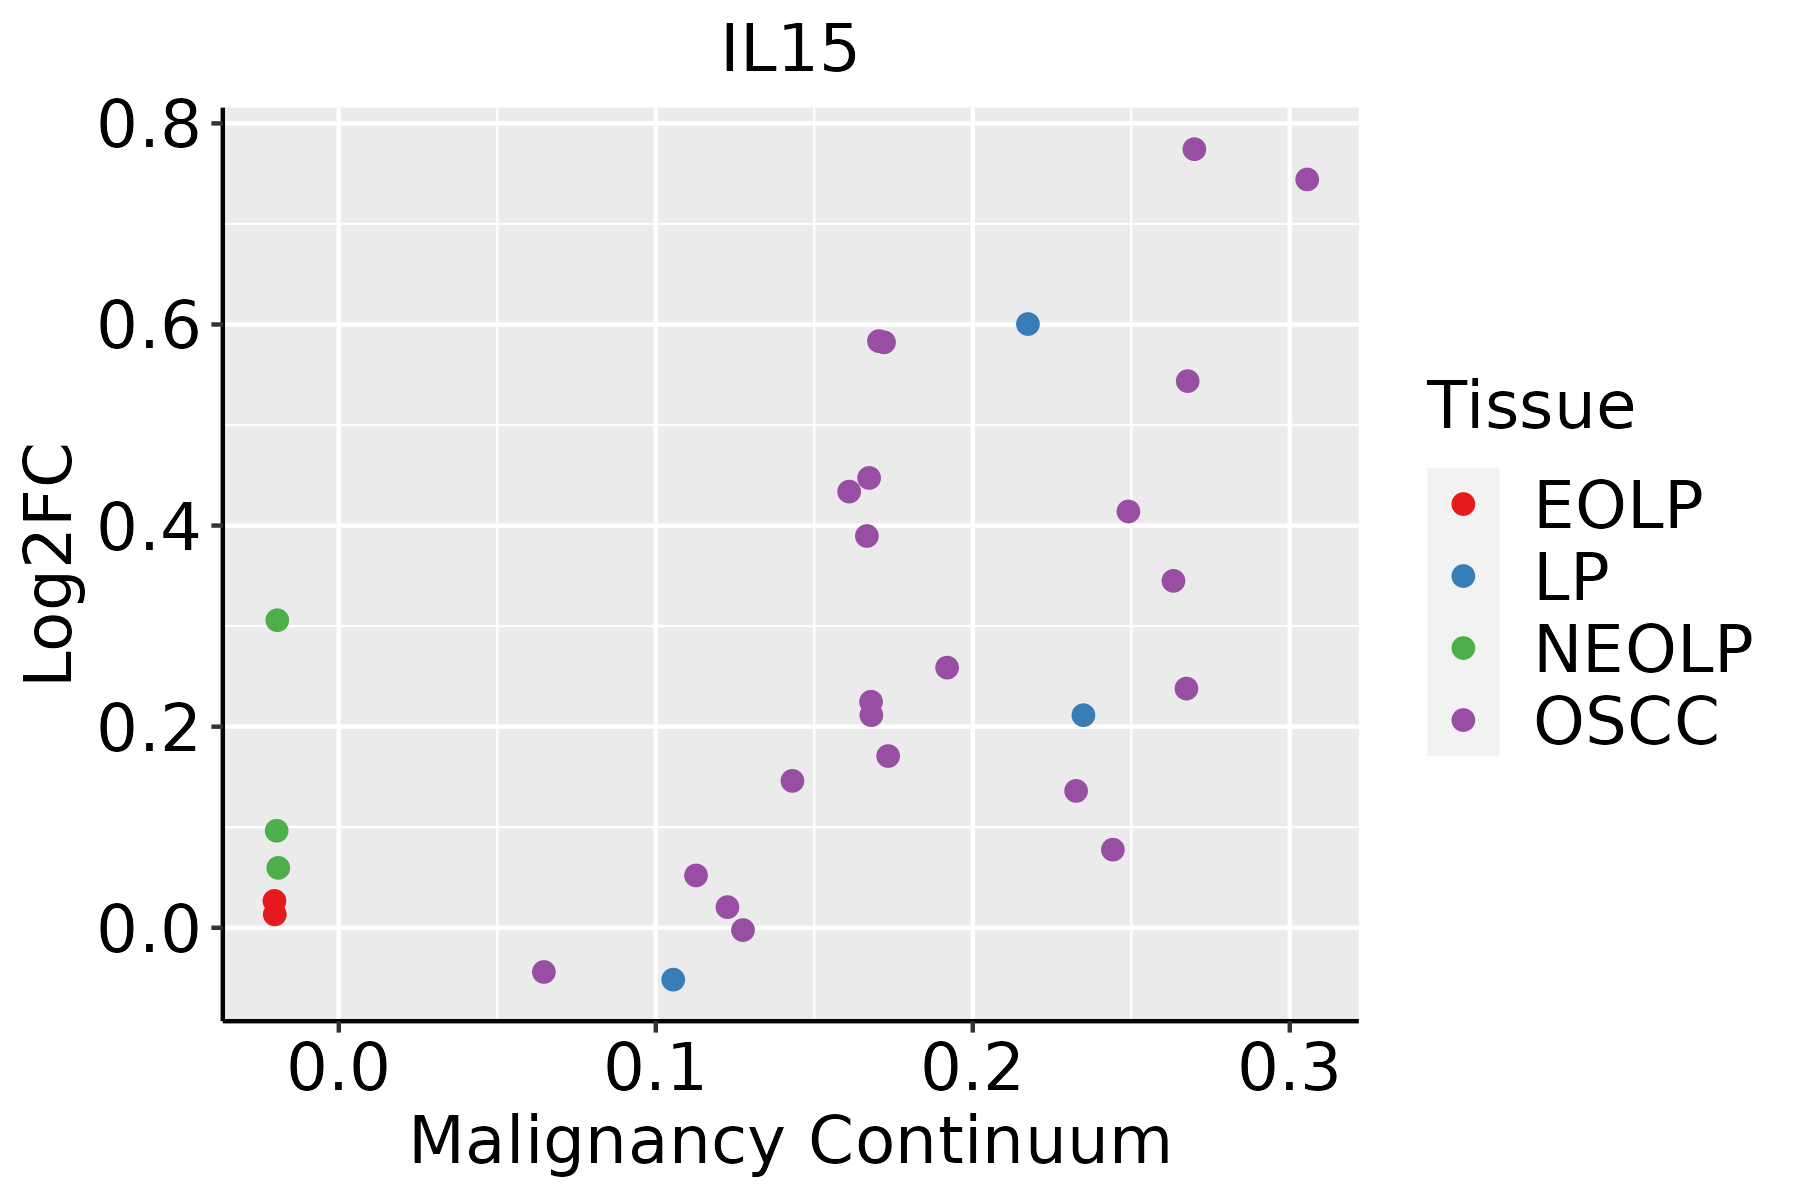 | EOLP: Erosive Oral lichen planus |
| LP: leukoplakia | ||
| NEOLP: Non-erosive oral lichen planus | ||
| OSCC: Oral squamous cell carcinoma |
| ∗log2FC in expression of this searched gene in stem-like cells from each diseased tissue sample relative to stem-like cells in normal samples in each tissue plotted against the malignancy continuum. Samples are colored based on if they are from different disease stage. |
Top |
Malignant transformation related pathway analysis |
| Find out the enriched GO biological processes and KEGG pathways involved in transition from healthy to precancer to cancer |
| Tissue | Disease Stage | Enriched GO biological Processes |
| Colorectum | AD |  |
| Colorectum | SER |  |
| Colorectum | MSS |  |
| Colorectum | MSI-H |  |
| Colorectum | FAP |  |
| ∗Top 15 enriched GO BP terms are showed in the bar plot of each disease state in each tissue. Each row represents a significant GO biological process which is colored according to the -log10(p.adjust). |
| Page: 1 2 3 4 5 6 7 8 9 |
| GO ID | Tissue | Disease Stage | Description | Gene Ratio | Bg Ratio | pvalue | p.adjust | Count |
| GO:0071496111 | Esophagus | ESCC | cellular response to external stimulus | 215/8552 | 320/18723 | 4.29e-15 | 2.43e-13 | 215 |
| GO:000961518 | Esophagus | ESCC | response to virus | 238/8552 | 367/18723 | 6.65e-14 | 3.32e-12 | 238 |
| GO:0031668111 | Esophagus | ESCC | cellular response to extracellular stimulus | 168/8552 | 246/18723 | 4.93e-13 | 2.23e-11 | 168 |
| GO:0031669110 | Esophagus | ESCC | cellular response to nutrient levels | 148/8552 | 215/18723 | 4.58e-12 | 1.76e-10 | 148 |
| GO:0031667111 | Esophagus | ESCC | response to nutrient levels | 289/8552 | 474/18723 | 9.25e-12 | 3.47e-10 | 289 |
| GO:00516075 | Esophagus | ESCC | defense response to virus | 171/8552 | 265/18723 | 3.91e-10 | 1.05e-08 | 171 |
| GO:01405465 | Esophagus | ESCC | defense response to symbiont | 171/8552 | 265/18723 | 3.91e-10 | 1.05e-08 | 171 |
| GO:0030099111 | Esophagus | ESCC | myeloid cell differentiation | 232/8552 | 381/18723 | 1.22e-09 | 2.90e-08 | 232 |
| GO:004578527 | Esophagus | ESCC | positive regulation of cell adhesion | 255/8552 | 437/18723 | 5.07e-08 | 9.11e-07 | 255 |
| GO:000758410 | Esophagus | ESCC | response to nutrient | 114/8552 | 174/18723 | 9.43e-08 | 1.56e-06 | 114 |
| GO:00091002 | Esophagus | ESCC | glycoprotein metabolic process | 226/8552 | 387/18723 | 2.64e-07 | 3.94e-06 | 226 |
| GO:000756820 | Esophagus | ESCC | aging | 201/8552 | 339/18723 | 2.64e-07 | 3.94e-06 | 201 |
| GO:00028318 | Esophagus | ESCC | regulation of response to biotic stimulus | 191/8552 | 327/18723 | 2.12e-06 | 2.45e-05 | 191 |
| GO:000257317 | Esophagus | ESCC | myeloid leukocyte differentiation | 128/8552 | 208/18723 | 2.75e-06 | 3.15e-05 | 128 |
| GO:00700854 | Esophagus | ESCC | glycosylation | 144/8552 | 240/18723 | 5.12e-06 | 5.38e-05 | 144 |
| GO:00064865 | Esophagus | ESCC | protein glycosylation | 135/8552 | 226/18723 | 1.36e-05 | 1.24e-04 | 135 |
| GO:00434135 | Esophagus | ESCC | macromolecule glycosylation | 135/8552 | 226/18723 | 1.36e-05 | 1.24e-04 | 135 |
| GO:00091012 | Esophagus | ESCC | glycoprotein biosynthetic process | 181/8552 | 317/18723 | 2.54e-05 | 2.15e-04 | 181 |
| GO:00332734 | Esophagus | ESCC | response to vitamin | 60/8552 | 93/18723 | 1.89e-04 | 1.21e-03 | 60 |
| GO:1903706110 | Esophagus | ESCC | regulation of hemopoiesis | 201/8552 | 367/18723 | 2.60e-04 | 1.58e-03 | 201 |
| Page: 1 2 3 4 5 6 7 8 9 10 |
| Pathway ID | Tissue | Disease Stage | Description | Gene Ratio | Bg Ratio | pvalue | p.adjust | qvalue | Count |
| hsa05166211 | Esophagus | ESCC | Human T-cell leukemia virus 1 infection | 164/4205 | 222/8465 | 8.13e-14 | 2.09e-12 | 1.07e-12 | 164 |
| hsa0466810 | Esophagus | ESCC | TNF signaling pathway | 89/4205 | 114/8465 | 3.36e-10 | 4.01e-09 | 2.06e-09 | 89 |
| hsa0532320 | Esophagus | ESCC | Rheumatoid arthritis | 59/4205 | 93/8465 | 4.98e-03 | 1.27e-02 | 6.52e-03 | 59 |
| hsa05166310 | Esophagus | ESCC | Human T-cell leukemia virus 1 infection | 164/4205 | 222/8465 | 8.13e-14 | 2.09e-12 | 1.07e-12 | 164 |
| hsa0466817 | Esophagus | ESCC | TNF signaling pathway | 89/4205 | 114/8465 | 3.36e-10 | 4.01e-09 | 2.06e-09 | 89 |
| hsa05323110 | Esophagus | ESCC | Rheumatoid arthritis | 59/4205 | 93/8465 | 4.98e-03 | 1.27e-02 | 6.52e-03 | 59 |
| hsa0516630 | Oral cavity | OSCC | Human T-cell leukemia virus 1 infection | 150/3704 | 222/8465 | 3.68e-13 | 7.26e-12 | 3.70e-12 | 150 |
| hsa046689 | Oral cavity | OSCC | TNF signaling pathway | 82/3704 | 114/8465 | 8.30e-10 | 9.59e-09 | 4.88e-09 | 82 |
| hsa0532318 | Oral cavity | OSCC | Rheumatoid arthritis | 56/3704 | 93/8465 | 9.72e-04 | 2.76e-03 | 1.40e-03 | 56 |
| hsa05166113 | Oral cavity | OSCC | Human T-cell leukemia virus 1 infection | 150/3704 | 222/8465 | 3.68e-13 | 7.26e-12 | 3.70e-12 | 150 |
| hsa0466816 | Oral cavity | OSCC | TNF signaling pathway | 82/3704 | 114/8465 | 8.30e-10 | 9.59e-09 | 4.88e-09 | 82 |
| hsa0532319 | Oral cavity | OSCC | Rheumatoid arthritis | 56/3704 | 93/8465 | 9.72e-04 | 2.76e-03 | 1.40e-03 | 56 |
| hsa05166210 | Oral cavity | LP | Human T-cell leukemia virus 1 infection | 100/2418 | 222/8465 | 8.94e-08 | 1.29e-06 | 8.35e-07 | 100 |
| hsa0466822 | Oral cavity | LP | TNF signaling pathway | 49/2418 | 114/8465 | 6.51e-04 | 3.29e-03 | 2.12e-03 | 49 |
| hsa0516638 | Oral cavity | LP | Human T-cell leukemia virus 1 infection | 100/2418 | 222/8465 | 8.94e-08 | 1.29e-06 | 8.35e-07 | 100 |
| hsa0466832 | Oral cavity | LP | TNF signaling pathway | 49/2418 | 114/8465 | 6.51e-04 | 3.29e-03 | 2.12e-03 | 49 |
| hsa0516662 | Oral cavity | NEOLP | Human T-cell leukemia virus 1 infection | 50/1112 | 222/8465 | 6.91e-05 | 5.23e-04 | 3.29e-04 | 50 |
| hsa0466861 | Oral cavity | NEOLP | TNF signaling pathway | 27/1112 | 114/8465 | 1.42e-03 | 6.55e-03 | 4.12e-03 | 27 |
| hsa0516672 | Oral cavity | NEOLP | Human T-cell leukemia virus 1 infection | 50/1112 | 222/8465 | 6.91e-05 | 5.23e-04 | 3.29e-04 | 50 |
| hsa0466871 | Oral cavity | NEOLP | TNF signaling pathway | 27/1112 | 114/8465 | 1.42e-03 | 6.55e-03 | 4.12e-03 | 27 |
| Page: 1 |
Top |
Cell-cell communication analysis |
| Identification of potential cell-cell interactions between two cell types and their ligand-receptor pairs for different disease states |
| Ligand | Receptor | LRpair | Pathway | Tissue | Disease Stage |
| IL15 | IL15RA_IL2RB | IL15_IL15RA_IL2RB | IL2 | HNSCC | OSCC |
| Page: 1 |
Top |
Single-cell gene regulatory network inference analysis |
| Find out the significant the regulons (TFs) and the target genes of each regulon across cell types for different disease states |
| TF | Cell Type | Tissue | Disease Stage | Target Gene | RSS | Regulon Activity |
| ∗The dot plots of a searched regulon are shown for all cell subpopulations in each disease state of each tissue based on the regulon specific score inferred using pySCENIC and by calculating the average expression. |
| Page: 1 |
Top |
Somatic mutation of malignant transformation related genes |
| Annotation of somatic variants for genes involved in malignant transformation |
| Hugo Symbol | Variant Class | Variant Classification | dbSNP RS | HGVSc | HGVSp | HGVSp Short | SWISSPROT | BIOTYPE | SIFT | PolyPhen | Tumor Sample Barcode | Tissue | Histology | Sex | Age | Stage | Therapy Types | Drugs | Outcome |
| IL15 | SNV | Missense_Mutation | c.366N>T | p.Leu122Phe | p.L122F | P40933 | protein_coding | tolerated(0.14) | probably_damaging(0.999) | TCGA-A8-A09M-01 | Breast | breast invasive carcinoma | Female | >=65 | III/IV | Chemotherapy | paclitaxel | CR | |
| IL15 | SNV | Missense_Mutation | c.440N>A | p.Phe147Tyr | p.F147Y | P40933 | protein_coding | deleterious(0) | possibly_damaging(0.875) | TCGA-AC-A23H-01 | Breast | breast invasive carcinoma | Female | >=65 | I/II | Unknown | Unknown | PD | |
| IL15 | SNV | Missense_Mutation | c.344N>A | p.Ile115Asn | p.I115N | P40933 | protein_coding | tolerated(0.2) | possibly_damaging(0.722) | TCGA-EW-A1IZ-01 | Breast | breast invasive carcinoma | Female | <65 | III/IV | Chemotherapy | taxotere | SD | |
| IL15 | SNV | Missense_Mutation | c.171N>C | p.Leu57Phe | p.L57F | P40933 | protein_coding | deleterious(0) | probably_damaging(0.999) | TCGA-C5-A1BQ-01 | Cervix | cervical & endocervical cancer | Female | >=65 | III/IV | Chemotherapy | cisplatin | CR | |
| IL15 | SNV | Missense_Mutation | c.171G>C | p.Leu57Phe | p.L57F | P40933 | protein_coding | deleterious(0) | probably_damaging(0.999) | TCGA-C5-A3HL-01 | Cervix | cervical & endocervical cancer | Female | >=65 | I/II | Unknown | Unknown | SD | |
| IL15 | SNV | Missense_Mutation | c.403G>C | p.Glu135Gln | p.E135Q | P40933 | protein_coding | tolerated(0.31) | benign(0.013) | TCGA-Q1-A5R2-01 | Cervix | cervical & endocervical cancer | Female | <65 | I/II | Chemotherapy | cisplatin | PR | |
| IL15 | insertion | Frame_Shift_Ins | novel | c.194_195insTCTTGATG | p.Gln65HisfsTer24 | p.Q65Hfs*24 | P40933 | protein_coding | TCGA-AM-5820-01 | Colorectum | colon adenocarcinoma | Female | <65 | I/II | Unknown | Unknown | SD | ||
| IL15 | insertion | Frame_Shift_Ins | novel | c.421_422insA | p.Asn143LysfsTer3 | p.N143Kfs*3 | P40933 | protein_coding | TCGA-F4-6703-01 | Colorectum | colon adenocarcinoma | Male | <65 | I/II | Unknown | Unknown | SD | ||
| IL15 | SNV | Missense_Mutation | c.364N>G | p.Leu122Val | p.L122V | P40933 | protein_coding | deleterious(0.04) | probably_damaging(0.994) | TCGA-AP-A0LM-01 | Endometrium | uterine corpus endometrioid carcinoma | Female | <65 | III/IV | Chemotherapy | cisplatin | SD | |
| IL15 | SNV | Missense_Mutation | novel | c.197C>A | p.Ser66Tyr | p.S66Y | P40933 | protein_coding | deleterious(0.02) | benign(0.026) | TCGA-AX-A2HD-01 | Endometrium | uterine corpus endometrioid carcinoma | Female | >=65 | III/IV | Unknown | Unknown | SD |
| Page: 1 2 3 |
Top |
Related drugs of malignant transformation related genes |
| Identification of chemicals and drugs interact with genes involved in malignant transfromation |
| (DGIdb 4.0) |
| Entrez ID | Symbol | Category | Interaction Types | Drug Claim Name | Drug Name | PMIDs |
| 3600 | IL15 | CLINICALLY ACTIONABLE, DRUGGABLE GENOME, CELL SURFACE, KINASE | LYMPHOKINE-ACTIVATED KILLER CELLS | 15893691 | ||
| 3600 | IL15 | CLINICALLY ACTIONABLE, DRUGGABLE GENOME, CELL SURFACE, KINASE | LEVODOPA | LEVODOPA | 14514477 | |
| 3600 | IL15 | CLINICALLY ACTIONABLE, DRUGGABLE GENOME, CELL SURFACE, KINASE | BCG | BCG VACCINE | 11441103,15213127 | |
| 3600 | IL15 | CLINICALLY ACTIONABLE, DRUGGABLE GENOME, CELL SURFACE, KINASE | PMA | 10679127 | ||
| 3600 | IL15 | CLINICALLY ACTIONABLE, DRUGGABLE GENOME, CELL SURFACE, KINASE | MEGESTROL ACETATE | 15345738 | ||
| 3600 | IL15 | CLINICALLY ACTIONABLE, DRUGGABLE GENOME, CELL SURFACE, KINASE | CSA | CYCLOSPORINE | 11571455,11817607,11683823 | |
| 3600 | IL15 | CLINICALLY ACTIONABLE, DRUGGABLE GENOME, CELL SURFACE, KINASE | MYCOPHENOLATE MOFETIL | 12070425 | ||
| 3600 | IL15 | CLINICALLY ACTIONABLE, DRUGGABLE GENOME, CELL SURFACE, KINASE | LAK | 9376592 | ||
| 3600 | IL15 | CLINICALLY ACTIONABLE, DRUGGABLE GENOME, CELL SURFACE, KINASE | CELL SURFACE ANTIGENS | 16129046 | ||
| 3600 | IL15 | CLINICALLY ACTIONABLE, DRUGGABLE GENOME, CELL SURFACE, KINASE | AMG-714 | AMG-714 |
| Page: 1 2 |

Copyright 2023-Present -The University of Texas Health Science Center at Houston |