
|
|||||
|
 | |
| |
| |
| |
| |
| |
|
Gene: IL13RA1 |
Gene summary for IL13RA1 |
| Gene information | Species | Human | Gene symbol | IL13RA1 | Gene ID | 3597 |
| Gene name | interleukin 13 receptor subunit alpha 1 | |
| Gene Alias | CD213A1 | |
| Cytomap | Xq24 | |
| Gene Type | protein-coding | GO ID | GO:0007154 | UniProtAcc | P78552 |
Top |
Malignant transformation analysis |
| Identification of the aberrant gene expression in precancerous and cancerous lesions by comparing the gene expression of stem-like cells in diseased tissues with normal stem cells |
| Entrez ID | Symbol | Replicates | Species | Organ | Tissue | Adj P-value | Log2FC | Malignancy |
| 3597 | IL13RA1 | HTA11_78_2000001011 | Human | Colorectum | AD | 1.98e-04 | 2.86e-01 | -0.1088 |
| 3597 | IL13RA1 | HTA11_347_2000001011 | Human | Colorectum | AD | 9.23e-11 | 4.14e-01 | -0.1954 |
| 3597 | IL13RA1 | HTA11_411_2000001011 | Human | Colorectum | SER | 2.27e-02 | 5.71e-01 | -0.2602 |
| 3597 | IL13RA1 | HTA11_99999965104_69814 | Human | Colorectum | MSS | 2.01e-08 | 5.20e-01 | 0.281 |
| 3597 | IL13RA1 | A015-C-203 | Human | Colorectum | FAP | 1.08e-05 | -1.27e-01 | -0.1294 |
| 3597 | IL13RA1 | A001-C-108 | Human | Colorectum | FAP | 7.08e-03 | -1.28e-01 | -0.0272 |
| 3597 | IL13RA1 | A015-C-106 | Human | Colorectum | FAP | 6.69e-05 | -1.38e-01 | -0.0511 |
| 3597 | IL13RA1 | A015-C-104 | Human | Colorectum | FAP | 4.83e-08 | -1.95e-01 | -0.1899 |
| 3597 | IL13RA1 | A002-C-016 | Human | Colorectum | FAP | 2.00e-02 | -7.58e-02 | 0.0521 |
| 3597 | IL13RA1 | A001-C-203 | Human | Colorectum | FAP | 1.68e-04 | -1.19e-01 | -0.0481 |
| 3597 | IL13RA1 | A002-C-116 | Human | Colorectum | FAP | 1.82e-07 | -9.78e-02 | -0.0452 |
| 3597 | IL13RA1 | F034 | Human | Colorectum | FAP | 1.10e-04 | -1.40e-01 | -0.0665 |
| 3597 | IL13RA1 | LZE20T | Human | Esophagus | ESCC | 2.42e-02 | 3.22e-01 | 0.0662 |
| 3597 | IL13RA1 | LZE24T | Human | Esophagus | ESCC | 8.75e-27 | 8.51e-01 | 0.0596 |
| 3597 | IL13RA1 | P1T-E | Human | Esophagus | ESCC | 6.72e-11 | 8.50e-01 | 0.0875 |
| 3597 | IL13RA1 | P2T-E | Human | Esophagus | ESCC | 5.86e-16 | 3.19e-01 | 0.1177 |
| 3597 | IL13RA1 | P4T-E | Human | Esophagus | ESCC | 3.01e-11 | 2.58e-01 | 0.1323 |
| 3597 | IL13RA1 | P5T-E | Human | Esophagus | ESCC | 6.90e-11 | 2.15e-01 | 0.1327 |
| 3597 | IL13RA1 | P8T-E | Human | Esophagus | ESCC | 3.08e-30 | 7.17e-01 | 0.0889 |
| 3597 | IL13RA1 | P9T-E | Human | Esophagus | ESCC | 6.18e-17 | 4.77e-01 | 0.1131 |
| Page: 1 2 3 4 5 6 |
| Tissue | Expression Dynamics | Abbreviation |
| Colorectum (GSE201348) |  | FAP: Familial adenomatous polyposis |
| CRC: Colorectal cancer | ||
| Colorectum (HTA11) | 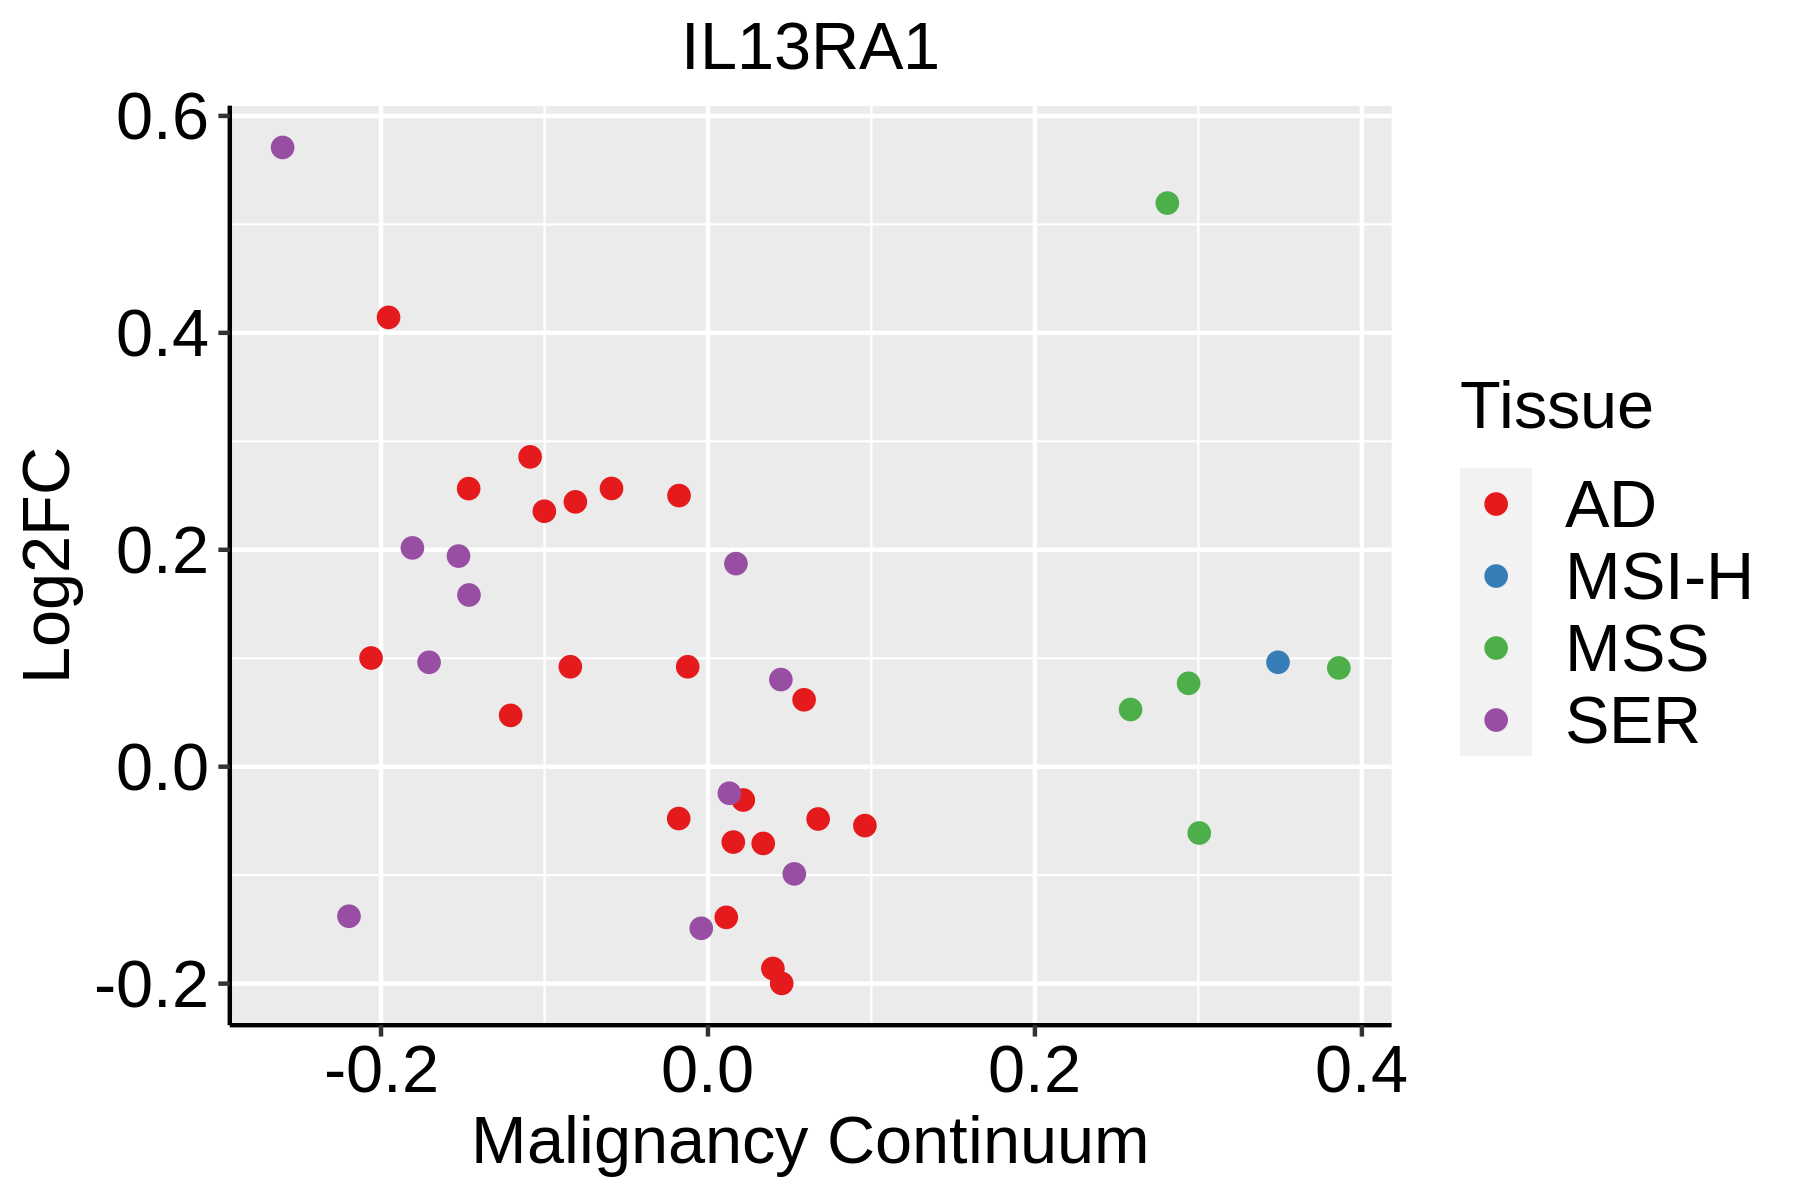 | AD: Adenomas |
| SER: Sessile serrated lesions | ||
| MSI-H: Microsatellite-high colorectal cancer | ||
| MSS: Microsatellite stable colorectal cancer | ||
| Esophagus |  | ESCC: Esophageal squamous cell carcinoma |
| HGIN: High-grade intraepithelial neoplasias | ||
| LGIN: Low-grade intraepithelial neoplasias | ||
| Liver |  | HCC: Hepatocellular carcinoma |
| NAFLD: Non-alcoholic fatty liver disease | ||
| Oral Cavity | 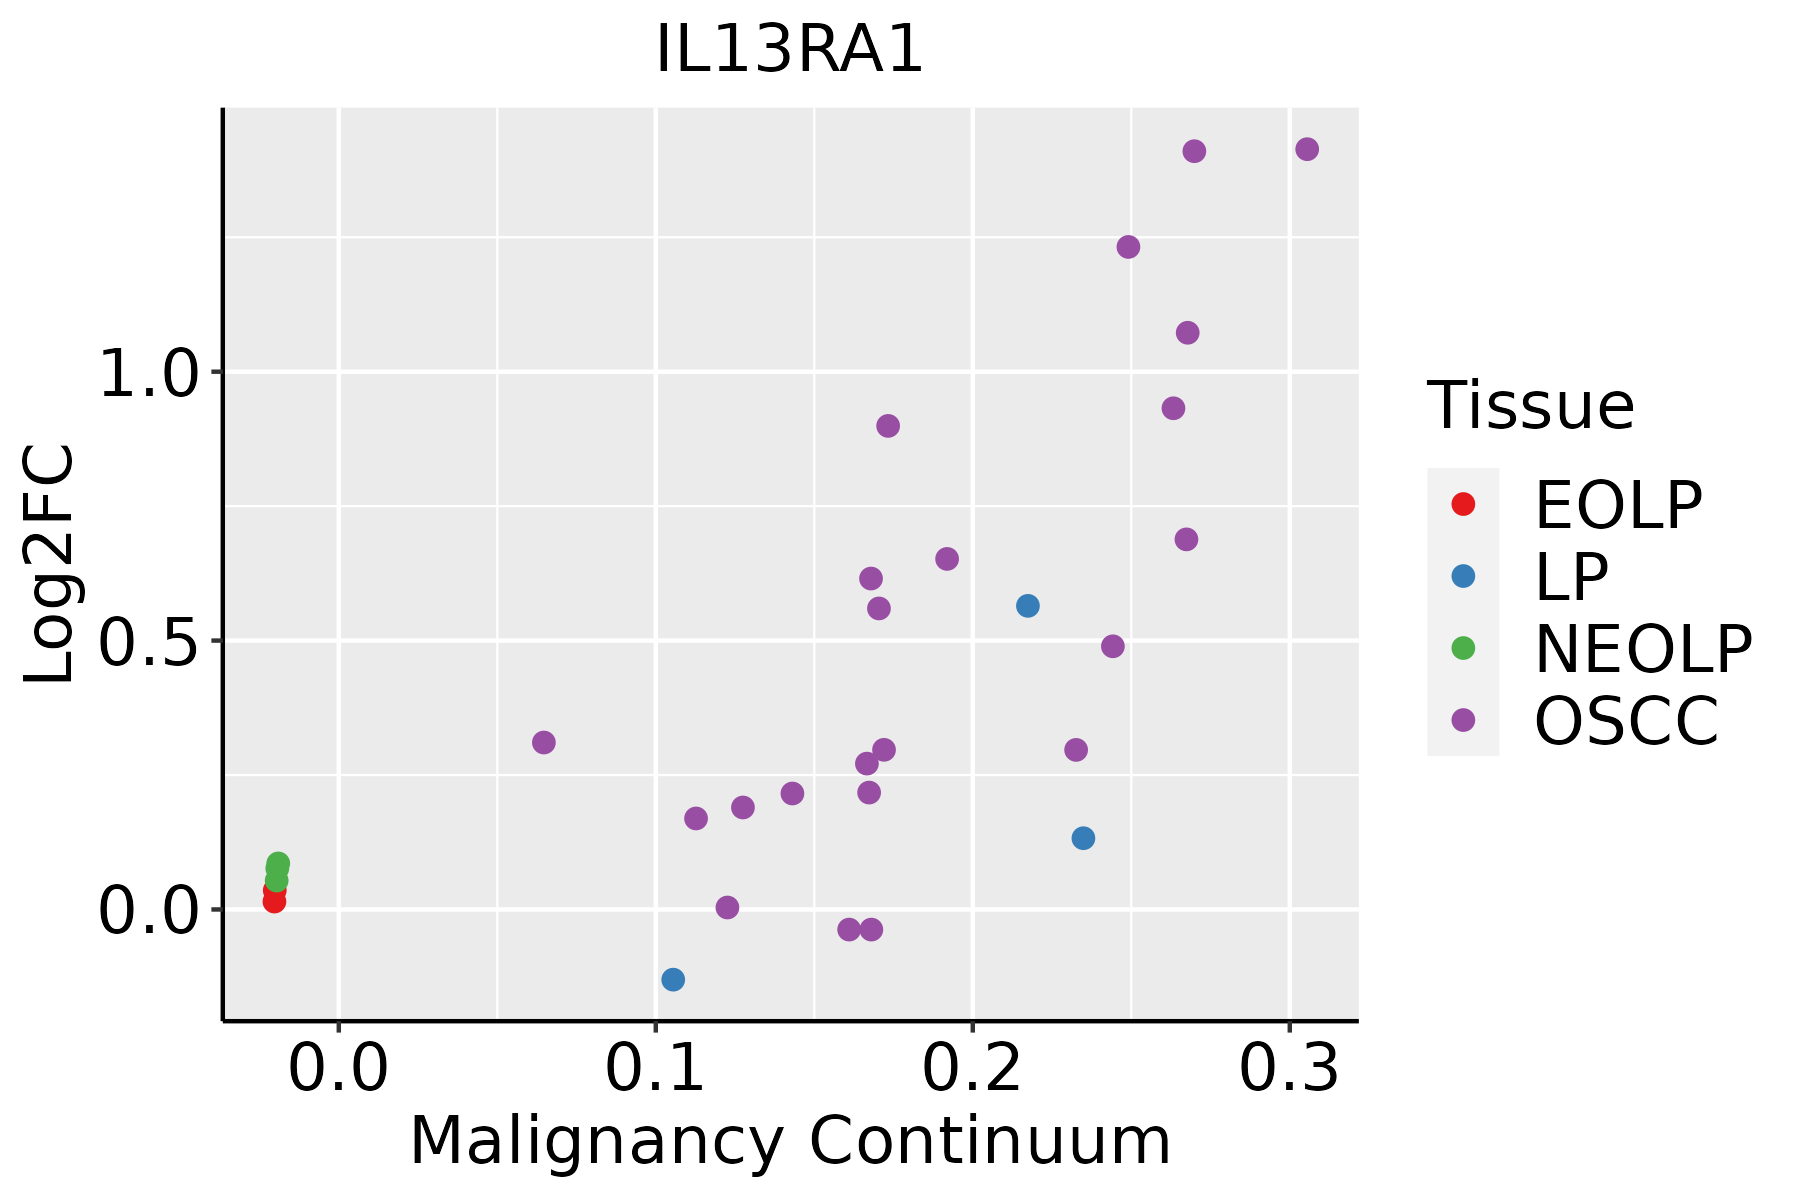 | EOLP: Erosive Oral lichen planus |
| LP: leukoplakia | ||
| NEOLP: Non-erosive oral lichen planus | ||
| OSCC: Oral squamous cell carcinoma | ||
| Skin |  | AK: Actinic keratosis |
| cSCC: Cutaneous squamous cell carcinoma | ||
| SCCIS:squamous cell carcinoma in situ | ||
| Thyroid |  | ATC: Anaplastic thyroid cancer |
| HT: Hashimoto's thyroiditis | ||
| PTC: Papillary thyroid cancer |
| ∗log2FC in expression of this searched gene in stem-like cells from each diseased tissue sample relative to stem-like cells in normal samples in each tissue plotted against the malignancy continuum. Samples are colored based on if they are from different disease stage. |
Top |
Malignant transformation related pathway analysis |
| Find out the enriched GO biological processes and KEGG pathways involved in transition from healthy to precancer to cancer |
| Tissue | Disease Stage | Enriched GO biological Processes |
| Colorectum | AD |  |
| Colorectum | SER |  |
| Colorectum | MSS |  |
| Colorectum | MSI-H |  |
| Colorectum | FAP |  |
| ∗Top 15 enriched GO BP terms are showed in the bar plot of each disease state in each tissue. Each row represents a significant GO biological process which is colored according to the -log10(p.adjust). |
| Page: 1 2 3 4 5 6 7 8 9 |
| GO ID | Tissue | Disease Stage | Description | Gene Ratio | Bg Ratio | pvalue | p.adjust | Count |
| GO:00192214 | Oral cavity | OSCC | cytokine-mediated signaling pathway | 222/7305 | 472/18723 | 2.02e-04 | 1.35e-03 | 222 |
| Page: 1 |
| Pathway ID | Tissue | Disease Stage | Description | Gene Ratio | Bg Ratio | pvalue | p.adjust | qvalue | Count |
| Page: 1 |
Top |
Cell-cell communication analysis |
| Identification of potential cell-cell interactions between two cell types and their ligand-receptor pairs for different disease states |
| Ligand | Receptor | LRpair | Pathway | Tissue | Disease Stage |
| Page: 1 |
Top |
Single-cell gene regulatory network inference analysis |
| Find out the significant the regulons (TFs) and the target genes of each regulon across cell types for different disease states |
| TF | Cell Type | Tissue | Disease Stage | Target Gene | RSS | Regulon Activity |
| ∗The dot plots of a searched regulon are shown for all cell subpopulations in each disease state of each tissue based on the regulon specific score inferred using pySCENIC and by calculating the average expression. |
| Page: 1 |
Top |
Somatic mutation of malignant transformation related genes |
| Annotation of somatic variants for genes involved in malignant transformation |
| Hugo Symbol | Variant Class | Variant Classification | dbSNP RS | HGVSc | HGVSp | HGVSp Short | SWISSPROT | BIOTYPE | SIFT | PolyPhen | Tumor Sample Barcode | Tissue | Histology | Sex | Age | Stage | Therapy Types | Drugs | Outcome |
| IL13RA1 | SNV | Missense_Mutation | c.478N>G | p.Leu160Val | p.L160V | P78552 | protein_coding | deleterious(0) | probably_damaging(0.997) | TCGA-A2-A0YK-01 | Breast | breast invasive carcinoma | Female | <65 | I/II | Chemotherapy | cytoxan | SD | |
| IL13RA1 | SNV | Missense_Mutation | c.825C>G | p.Phe275Leu | p.F275L | P78552 | protein_coding | tolerated(0.34) | benign(0) | TCGA-BH-A0DZ-01 | Breast | breast invasive carcinoma | Female | <65 | I/II | Chemotherapy | docetaxel | SD | |
| IL13RA1 | SNV | Missense_Mutation | rs141752835 | c.239N>T | p.Pro80Leu | p.P80L | P78552 | protein_coding | tolerated(0.15) | benign(0.033) | TCGA-A6-5665-01 | Colorectum | colon adenocarcinoma | Female | >=65 | I/II | Unknown | Unknown | PD |
| IL13RA1 | SNV | Missense_Mutation | novel | c.133C>A | p.Leu45Ile | p.L45I | P78552 | protein_coding | tolerated(0.19) | possibly_damaging(0.895) | TCGA-AA-3950-01 | Colorectum | colon adenocarcinoma | Female | >=65 | I/II | Unknown | Unknown | SD |
| IL13RA1 | SNV | Missense_Mutation | c.95A>T | p.Gln32Leu | p.Q32L | P78552 | protein_coding | tolerated(1) | benign(0.003) | TCGA-AA-A02W-01 | Colorectum | colon adenocarcinoma | Female | >=65 | I/II | Unknown | Unknown | PD | |
| IL13RA1 | SNV | Missense_Mutation | c.231A>T | p.Lys77Asn | p.K77N | P78552 | protein_coding | deleterious(0.05) | possibly_damaging(0.63) | TCGA-DM-A1D8-01 | Colorectum | colon adenocarcinoma | Female | <65 | III/IV | Unknown | Unknown | SD | |
| IL13RA1 | SNV | Missense_Mutation | c.247N>T | p.Arg83Cys | p.R83C | P78552 | protein_coding | tolerated(0.07) | benign(0.25) | TCGA-G4-6628-01 | Colorectum | colon adenocarcinoma | Male | >=65 | I/II | Unknown | Unknown | SD | |
| IL13RA1 | SNV | Missense_Mutation | novel | c.1113G>T | p.Lys371Asn | p.K371N | P78552 | protein_coding | deleterious(0) | probably_damaging(0.963) | TCGA-AG-A002-01 | Colorectum | rectum adenocarcinoma | Male | <65 | I/II | Unknown | Unknown | SD |
| IL13RA1 | SNV | Missense_Mutation | novel | c.383C>A | p.Ala128Asp | p.A128D | P78552 | protein_coding | deleterious(0) | probably_damaging(0.99) | TCGA-A5-A0G1-01 | Endometrium | uterine corpus endometrioid carcinoma | Female | >=65 | I/II | Unknown | Unknown | SD |
| IL13RA1 | SNV | Missense_Mutation | novel | c.282N>G | p.Ile94Met | p.I94M | P78552 | protein_coding | tolerated(0.22) | possibly_damaging(0.593) | TCGA-A5-A0G2-01 | Endometrium | uterine corpus endometrioid carcinoma | Female | <65 | III/IV | Unknown | Unknown | SD |
| Page: 1 2 3 4 5 6 |
Top |
Related drugs of malignant transformation related genes |
| Identification of chemicals and drugs interact with genes involved in malignant transfromation |
| (DGIdb 4.0) |
| Entrez ID | Symbol | Category | Interaction Types | Drug Claim Name | Drug Name | PMIDs |
| 3597 | IL13RA1 | EXTERNAL SIDE OF PLASMA MEMBRANE, KINASE, DRUGGABLE GENOME | CINTREDEKIN BESUDOTOX | |||
| 3597 | IL13RA1 | EXTERNAL SIDE OF PLASMA MEMBRANE, KINASE, DRUGGABLE GENOME | AER001,AEROVANT |
| Page: 1 |

Copyright 2023-Present -The University of Texas Health Science Center at Houston |