
|
|||||
|
 | |
| |
| |
| |
| |
| |
|
Gene: IL11 |
Gene summary for IL11 |
| Gene information | Species | Human | Gene symbol | IL11 | Gene ID | 3589 |
| Gene name | interleukin 11 | |
| Gene Alias | AGIF | |
| Cytomap | 19q13.42 | |
| Gene Type | protein-coding | GO ID | GO:0000165 | UniProtAcc | A8K3F7 |
Top |
Malignant transformation analysis |
| Identification of the aberrant gene expression in precancerous and cancerous lesions by comparing the gene expression of stem-like cells in diseased tissues with normal stem cells |
| Entrez ID | Symbol | Replicates | Species | Organ | Tissue | Adj P-value | Log2FC | Malignancy |
| 3589 | IL11 | P11T-E | Human | Esophagus | ESCC | 1.04e-07 | 1.24e+00 | 0.1426 |
| 3589 | IL11 | P12T-E | Human | Esophagus | ESCC | 6.28e-04 | 1.12e-01 | 0.1122 |
| 3589 | IL11 | P21T-E | Human | Esophagus | ESCC | 6.36e-10 | 4.88e-01 | 0.1617 |
| 3589 | IL11 | P24T-E | Human | Esophagus | ESCC | 3.29e-02 | 3.25e-01 | 0.1287 |
| 3589 | IL11 | P26T-E | Human | Esophagus | ESCC | 1.13e-13 | 3.45e-01 | 0.1276 |
| 3589 | IL11 | P31T-E | Human | Esophagus | ESCC | 3.85e-06 | 2.83e-01 | 0.1251 |
| 3589 | IL11 | P32T-E | Human | Esophagus | ESCC | 1.13e-14 | 4.91e-01 | 0.1666 |
| 3589 | IL11 | P37T-E | Human | Esophagus | ESCC | 5.53e-12 | 4.81e-01 | 0.1371 |
| 3589 | IL11 | P44T-E | Human | Esophagus | ESCC | 2.12e-03 | 2.51e-01 | 0.1096 |
| 3589 | IL11 | P74T-E | Human | Esophagus | ESCC | 3.09e-07 | 1.36e-01 | 0.1479 |
| 3589 | IL11 | P75T-E | Human | Esophagus | ESCC | 3.17e-02 | 3.63e-01 | 0.1125 |
| 3589 | IL11 | P76T-E | Human | Esophagus | ESCC | 1.09e-03 | 4.19e-01 | 0.1207 |
| 3589 | IL11 | P83T-E | Human | Esophagus | ESCC | 6.75e-18 | 9.19e-01 | 0.1738 |
| 3589 | IL11 | P89T-E | Human | Esophagus | ESCC | 2.12e-03 | 7.42e-01 | 0.1752 |
| 3589 | IL11 | P107T-E | Human | Esophagus | ESCC | 2.88e-07 | 6.33e-01 | 0.171 |
| 3589 | IL11 | P130T-E | Human | Esophagus | ESCC | 6.38e-11 | 5.73e-01 | 0.1676 |
| 3589 | IL11 | C04 | Human | Oral cavity | OSCC | 1.53e-07 | 4.04e-01 | 0.2633 |
| 3589 | IL11 | C21 | Human | Oral cavity | OSCC | 2.76e-10 | 5.04e-01 | 0.2678 |
| 3589 | IL11 | C30 | Human | Oral cavity | OSCC | 1.16e-25 | 1.12e+00 | 0.3055 |
| 3589 | IL11 | C51 | Human | Oral cavity | OSCC | 2.36e-04 | 3.47e-01 | 0.2674 |
| Page: 1 2 |
| Tissue | Expression Dynamics | Abbreviation |
| Esophagus | 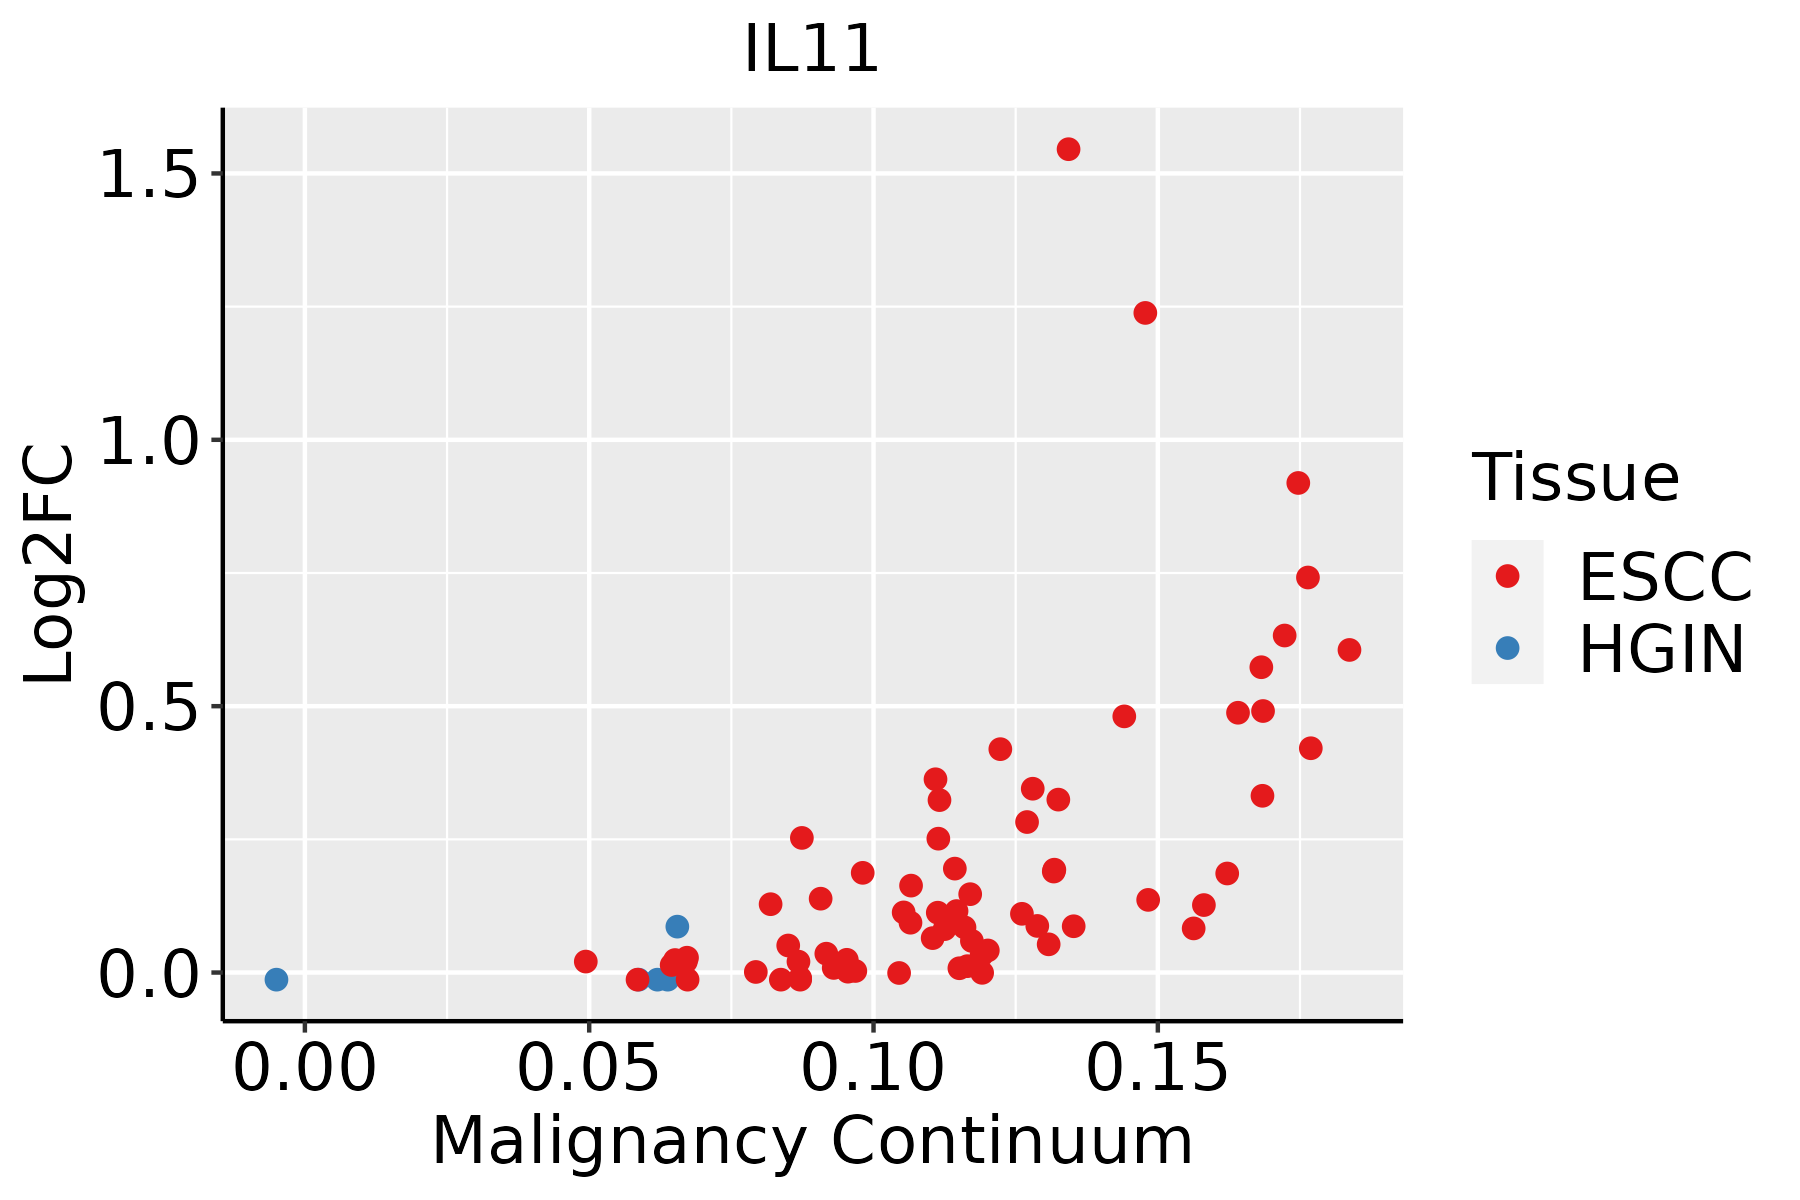 | ESCC: Esophageal squamous cell carcinoma |
| HGIN: High-grade intraepithelial neoplasias | ||
| LGIN: Low-grade intraepithelial neoplasias | ||
| Oral Cavity | 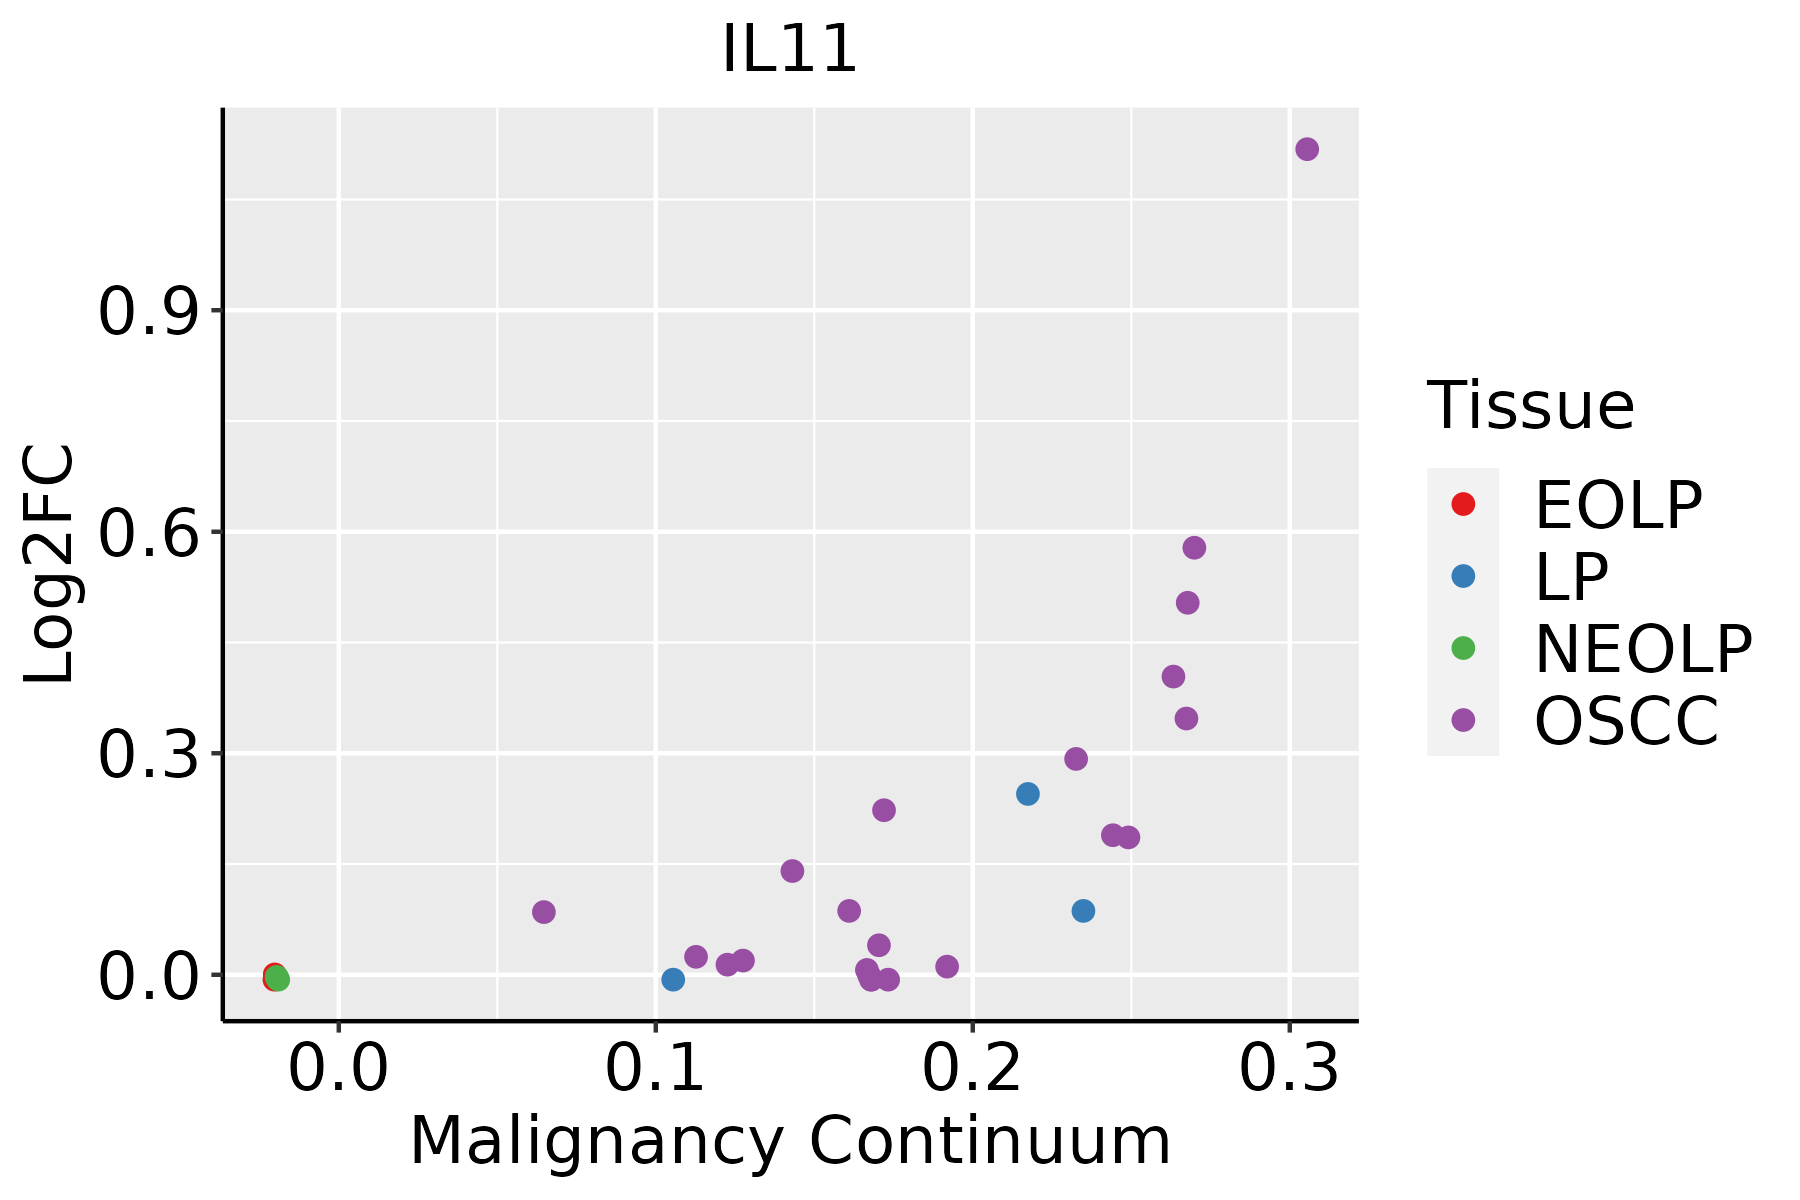 | EOLP: Erosive Oral lichen planus |
| LP: leukoplakia | ||
| NEOLP: Non-erosive oral lichen planus | ||
| OSCC: Oral squamous cell carcinoma |
| ∗log2FC in expression of this searched gene in stem-like cells from each diseased tissue sample relative to stem-like cells in normal samples in each tissue plotted against the malignancy continuum. Samples are colored based on if they are from different disease stage. |
Top |
Malignant transformation related pathway analysis |
| Find out the enriched GO biological processes and KEGG pathways involved in transition from healthy to precancer to cancer |
| Tissue | Disease Stage | Enriched GO biological Processes |
| Colorectum | AD |  |
| Colorectum | SER |  |
| Colorectum | MSS |  |
| Colorectum | MSI-H |  |
| Colorectum | FAP |  |
| ∗Top 15 enriched GO BP terms are showed in the bar plot of each disease state in each tissue. Each row represents a significant GO biological process which is colored according to the -log10(p.adjust). |
| Page: 1 2 3 4 5 6 7 8 9 |
| GO ID | Tissue | Disease Stage | Description | Gene Ratio | Bg Ratio | pvalue | p.adjust | Count |
| GO:0030099111 | Esophagus | ESCC | myeloid cell differentiation | 232/8552 | 381/18723 | 1.22e-09 | 2.90e-08 | 232 |
| GO:00182099 | Esophagus | ESCC | peptidyl-serine modification | 196/8552 | 338/18723 | 3.07e-06 | 3.47e-05 | 196 |
| GO:001810515 | Esophagus | ESCC | peptidyl-serine phosphorylation | 184/8552 | 315/18723 | 3.22e-06 | 3.61e-05 | 184 |
| GO:00454449 | Esophagus | ESCC | fat cell differentiation | 135/8552 | 229/18723 | 3.38e-05 | 2.78e-04 | 135 |
| GO:19031317 | Esophagus | ESCC | mononuclear cell differentiation | 226/8552 | 426/18723 | 1.20e-03 | 5.88e-03 | 226 |
| GO:00182124 | Esophagus | ESCC | peptidyl-tyrosine modification | 202/8552 | 378/18723 | 1.34e-03 | 6.39e-03 | 202 |
| GO:00181084 | Esophagus | ESCC | peptidyl-tyrosine phosphorylation | 200/8552 | 375/18723 | 1.60e-03 | 7.45e-03 | 200 |
| GO:00507303 | Esophagus | ESCC | regulation of peptidyl-tyrosine phosphorylation | 144/8552 | 264/18723 | 2.22e-03 | 9.78e-03 | 144 |
| GO:00331355 | Esophagus | ESCC | regulation of peptidyl-serine phosphorylation | 81/8552 | 144/18723 | 6.79e-03 | 2.48e-02 | 81 |
| GO:00300984 | Esophagus | ESCC | lymphocyte differentiation | 192/8552 | 374/18723 | 1.52e-02 | 4.93e-02 | 192 |
| GO:00331383 | Esophagus | ESCC | positive regulation of peptidyl-serine phosphorylation | 61/8552 | 108/18723 | 1.54e-02 | 4.96e-02 | 61 |
| GO:003009920 | Oral cavity | OSCC | myeloid cell differentiation | 213/7305 | 381/18723 | 1.24e-11 | 4.42e-10 | 213 |
| GO:00182098 | Oral cavity | OSCC | peptidyl-serine modification | 175/7305 | 338/18723 | 1.09e-06 | 1.46e-05 | 175 |
| GO:001810510 | Oral cavity | OSCC | peptidyl-serine phosphorylation | 164/7305 | 315/18723 | 1.51e-06 | 1.99e-05 | 164 |
| GO:19031316 | Oral cavity | OSCC | mononuclear cell differentiation | 210/7305 | 426/18723 | 8.44e-06 | 9.02e-05 | 210 |
| GO:00454448 | Oral cavity | OSCC | fat cell differentiation | 120/7305 | 229/18723 | 2.48e-05 | 2.32e-04 | 120 |
| GO:00300983 | Oral cavity | OSCC | lymphocyte differentiation | 179/7305 | 374/18723 | 2.74e-04 | 1.74e-03 | 179 |
| GO:00182123 | Oral cavity | OSCC | peptidyl-tyrosine modification | 180/7305 | 378/18723 | 3.63e-04 | 2.22e-03 | 180 |
| GO:0050730 | Oral cavity | OSCC | regulation of peptidyl-tyrosine phosphorylation | 129/7305 | 264/18723 | 6.70e-04 | 3.75e-03 | 129 |
| GO:00181083 | Oral cavity | OSCC | peptidyl-tyrosine phosphorylation | 177/7305 | 375/18723 | 6.86e-04 | 3.83e-03 | 177 |
| Page: 1 2 |
| Pathway ID | Tissue | Disease Stage | Description | Gene Ratio | Bg Ratio | pvalue | p.adjust | qvalue | Count |
| hsa0532320 | Esophagus | ESCC | Rheumatoid arthritis | 59/4205 | 93/8465 | 4.98e-03 | 1.27e-02 | 6.52e-03 | 59 |
| hsa05323110 | Esophagus | ESCC | Rheumatoid arthritis | 59/4205 | 93/8465 | 4.98e-03 | 1.27e-02 | 6.52e-03 | 59 |
| hsa0532318 | Oral cavity | OSCC | Rheumatoid arthritis | 56/3704 | 93/8465 | 9.72e-04 | 2.76e-03 | 1.40e-03 | 56 |
| hsa0532319 | Oral cavity | OSCC | Rheumatoid arthritis | 56/3704 | 93/8465 | 9.72e-04 | 2.76e-03 | 1.40e-03 | 56 |
| Page: 1 |
Top |
Cell-cell communication analysis |
| Identification of potential cell-cell interactions between two cell types and their ligand-receptor pairs for different disease states |
| Ligand | Receptor | LRpair | Pathway | Tissue | Disease Stage |
| IL11 | IL11R complex | IL11_IL11RA_IL6ST | IL6 | HNSCC | OSCC |
| IL11 | IL11R complex | IL11_IL11RA_IL6ST | IL6 | HNSCC | Precancer |
| Page: 1 |
Top |
Single-cell gene regulatory network inference analysis |
| Find out the significant the regulons (TFs) and the target genes of each regulon across cell types for different disease states |
| TF | Cell Type | Tissue | Disease Stage | Target Gene | RSS | Regulon Activity |
| ∗The dot plots of a searched regulon are shown for all cell subpopulations in each disease state of each tissue based on the regulon specific score inferred using pySCENIC and by calculating the average expression. |
| Page: 1 |
Top |
Somatic mutation of malignant transformation related genes |
| Annotation of somatic variants for genes involved in malignant transformation |
| Hugo Symbol | Variant Class | Variant Classification | dbSNP RS | HGVSc | HGVSp | HGVSp Short | SWISSPROT | BIOTYPE | SIFT | PolyPhen | Tumor Sample Barcode | Tissue | Histology | Sex | Age | Stage | Therapy Types | Drugs | Outcome |
| IL11 | SNV | Missense_Mutation | rs748079395 | c.202N>A | p.Gly68Arg | p.G68R | P20809 | protein_coding | deleterious(0.03) | probably_damaging(1) | TCGA-A7-A4SD-01 | Breast | breast invasive carcinoma | Female | <65 | I/II | Chemotherapy | taxotere | CR |
| IL11 | SNV | Missense_Mutation | c.17G>C | p.Arg6Pro | p.R6P | P20809 | protein_coding | tolerated(0.26) | benign(0.155) | TCGA-D8-A27F-01 | Breast | breast invasive carcinoma | Female | <65 | I/II | Chemotherapy | adriamycin+cyclophosphamide | SD | |
| IL11 | SNV | Missense_Mutation | c.257G>A | p.Gly86Glu | p.G86E | P20809 | protein_coding | deleterious(0.02) | probably_damaging(0.99) | TCGA-JW-A5VL-01 | Cervix | cervical & endocervical cancer | Female | <65 | I/II | Unknown | Unknown | SD | |
| IL11 | SNV | Missense_Mutation | novel | c.104C>A | p.Pro35His | p.P35H | P20809 | protein_coding | deleterious(0) | possibly_damaging(0.75) | TCGA-CA-6717-01 | Colorectum | colon adenocarcinoma | Male | <65 | I/II | Chemotherapy | oxaliplatin | CR |
| IL11 | SNV | Missense_Mutation | c.125C>T | p.Thr42Ile | p.T42I | P20809 | protein_coding | tolerated(0.62) | benign(0.057) | TCGA-D5-5541-01 | Colorectum | colon adenocarcinoma | Male | <65 | III/IV | Chemotherapy | calcium | SD | |
| IL11 | SNV | Missense_Mutation | rs748079395 | c.202N>A | p.Gly68Arg | p.G68R | P20809 | protein_coding | deleterious(0.03) | probably_damaging(1) | TCGA-G4-6586-01 | Colorectum | colon adenocarcinoma | Female | >=65 | I/II | Unknown | Unknown | SD |
| IL11 | SNV | Missense_Mutation | rs201003688 | c.565N>A | p.Val189Met | p.V189M | P20809 | protein_coding | deleterious(0.04) | probably_damaging(0.953) | TCGA-T9-A92H-01 | Colorectum | colon adenocarcinoma | Male | >=65 | I/II | Unknown | Unknown | PD |
| IL11 | insertion | Frame_Shift_Ins | rs768878885 | c.540_541insG | p.Leu181AlafsTer6 | p.L181Afs*6 | P20809 | protein_coding | TCGA-A6-3809-01 | Colorectum | colon adenocarcinoma | Female | >=65 | I/II | Unknown | Unknown | SD | ||
| IL11 | insertion | Frame_Shift_Ins | novel | c.86_87insC | p.Arg30SerfsTer38 | p.R30Sfs*38 | P20809 | protein_coding | TCGA-AA-3821-01 | Colorectum | colon adenocarcinoma | Female | >=65 | I/II | Unknown | Unknown | SD | ||
| IL11 | deletion | Frame_Shift_Del | c.509delN | p.Gly170AlafsTer14 | p.G170Afs*14 | P20809 | protein_coding | TCGA-CM-5861-01 | Colorectum | colon adenocarcinoma | Female | <65 | I/II | Unknown | Unknown | PD |
| Page: 1 2 |
Top |
Related drugs of malignant transformation related genes |
| Identification of chemicals and drugs interact with genes involved in malignant transfromation |
| (DGIdb 4.0) |
| Entrez ID | Symbol | Category | Interaction Types | Drug Claim Name | Drug Name | PMIDs |
| 3589 | IL11 | DRUGGABLE GENOME, KINASE, GROWTH FACTOR | ALENDRONATE | ALENDRONIC ACID | 12522661 | |
| 3589 | IL11 | DRUGGABLE GENOME, KINASE, GROWTH FACTOR | AZACYTIDINE | AZACITIDINE | 12543079 | |
| 3589 | IL11 | DRUGGABLE GENOME, KINASE, GROWTH FACTOR | 5-FLUOROURACIL | FLUOROURACIL | 1832057 | |
| 3589 | IL11 | DRUGGABLE GENOME, KINASE, GROWTH FACTOR | ANTISENSE OLIGONUCLEOTIDES | 8427997 | ||
| 3589 | IL11 | DRUGGABLE GENOME, KINASE, GROWTH FACTOR | escitalopram | ESCITALOPRAM | 23142150 | |
| 3589 | IL11 | DRUGGABLE GENOME, KINASE, GROWTH FACTOR | BFGF | 12063288 | ||
| 3589 | IL11 | DRUGGABLE GENOME, KINASE, GROWTH FACTOR | 5-FU | FLUOROURACIL | 7691257 | |
| 3589 | IL11 | DRUGGABLE GENOME, KINASE, GROWTH FACTOR | ETIDRONATE | ETIDRONIC ACID | 12522661 | |
| 3589 | IL11 | DRUGGABLE GENOME, KINASE, GROWTH FACTOR | citalopram | CITALOPRAM | 25916525 | |
| 3589 | IL11 | DRUGGABLE GENOME, KINASE, GROWTH FACTOR | VM-501 |
| Page: 1 2 |

Copyright 2023-Present -The University of Texas Health Science Center at Houston |