
|
|||||
|
 | |
| |
| |
| |
| |
| |
|
Gene: IL10RB |
Gene summary for IL10RB |
| Gene information | Species | Human | Gene symbol | IL10RB | Gene ID | 3588 |
| Gene name | interleukin 10 receptor subunit beta | |
| Gene Alias | CDW210B | |
| Cytomap | 21q22.11 | |
| Gene Type | protein-coding | GO ID | GO:0002376 | UniProtAcc | Q08334 |
Top |
Malignant transformation analysis |
| Identification of the aberrant gene expression in precancerous and cancerous lesions by comparing the gene expression of stem-like cells in diseased tissues with normal stem cells |
| Entrez ID | Symbol | Replicates | Species | Organ | Tissue | Adj P-value | Log2FC | Malignancy |
| 3588 | IL10RB | HTA11_3410_2000001011 | Human | Colorectum | AD | 2.13e-06 | 1.67e-01 | 0.0155 |
| 3588 | IL10RB | HTA11_2487_2000001011 | Human | Colorectum | SER | 1.24e-19 | 6.48e-01 | -0.1808 |
| 3588 | IL10RB | HTA11_1938_2000001011 | Human | Colorectum | AD | 1.86e-10 | 3.81e-01 | -0.0811 |
| 3588 | IL10RB | HTA11_78_2000001011 | Human | Colorectum | AD | 1.55e-13 | 3.67e-01 | -0.1088 |
| 3588 | IL10RB | HTA11_347_2000001011 | Human | Colorectum | AD | 3.49e-36 | 6.94e-01 | -0.1954 |
| 3588 | IL10RB | HTA11_411_2000001011 | Human | Colorectum | SER | 3.95e-13 | 9.22e-01 | -0.2602 |
| 3588 | IL10RB | HTA11_2112_2000001011 | Human | Colorectum | SER | 9.83e-15 | 8.71e-01 | -0.2196 |
| 3588 | IL10RB | HTA11_3361_2000001011 | Human | Colorectum | AD | 7.26e-16 | 5.41e-01 | -0.1207 |
| 3588 | IL10RB | HTA11_83_2000001011 | Human | Colorectum | SER | 3.93e-10 | 4.68e-01 | -0.1526 |
| 3588 | IL10RB | HTA11_696_2000001011 | Human | Colorectum | AD | 4.06e-23 | 5.70e-01 | -0.1464 |
| 3588 | IL10RB | HTA11_866_2000001011 | Human | Colorectum | AD | 5.89e-11 | 3.98e-01 | -0.1001 |
| 3588 | IL10RB | HTA11_1391_2000001011 | Human | Colorectum | AD | 5.69e-22 | 5.13e-01 | -0.059 |
| 3588 | IL10RB | HTA11_2992_2000001011 | Human | Colorectum | SER | 4.42e-07 | 4.95e-01 | -0.1706 |
| 3588 | IL10RB | HTA11_5212_2000001011 | Human | Colorectum | AD | 1.01e-12 | 5.54e-01 | -0.2061 |
| 3588 | IL10RB | HTA11_5216_2000001011 | Human | Colorectum | SER | 2.20e-03 | 3.84e-01 | -0.1462 |
| 3588 | IL10RB | HTA11_546_2000001011 | Human | Colorectum | AD | 2.04e-11 | 5.36e-01 | -0.0842 |
| 3588 | IL10RB | HTA11_866_3004761011 | Human | Colorectum | AD | 2.82e-08 | 2.19e-01 | 0.096 |
| 3588 | IL10RB | HTA11_8622_2000001021 | Human | Colorectum | SER | 4.71e-06 | 3.72e-01 | 0.0528 |
| 3588 | IL10RB | HTA11_7663_2000001011 | Human | Colorectum | SER | 3.92e-02 | 3.04e-01 | 0.0131 |
| 3588 | IL10RB | HTA11_10623_2000001011 | Human | Colorectum | AD | 1.58e-02 | 2.14e-01 | -0.0177 |
| Page: 1 2 3 4 5 6 7 |
| Tissue | Expression Dynamics | Abbreviation |
| Colorectum (GSE201348) |  | FAP: Familial adenomatous polyposis |
| CRC: Colorectal cancer | ||
| Colorectum (HTA11) |  | AD: Adenomas |
| SER: Sessile serrated lesions | ||
| MSI-H: Microsatellite-high colorectal cancer | ||
| MSS: Microsatellite stable colorectal cancer | ||
| Esophagus | 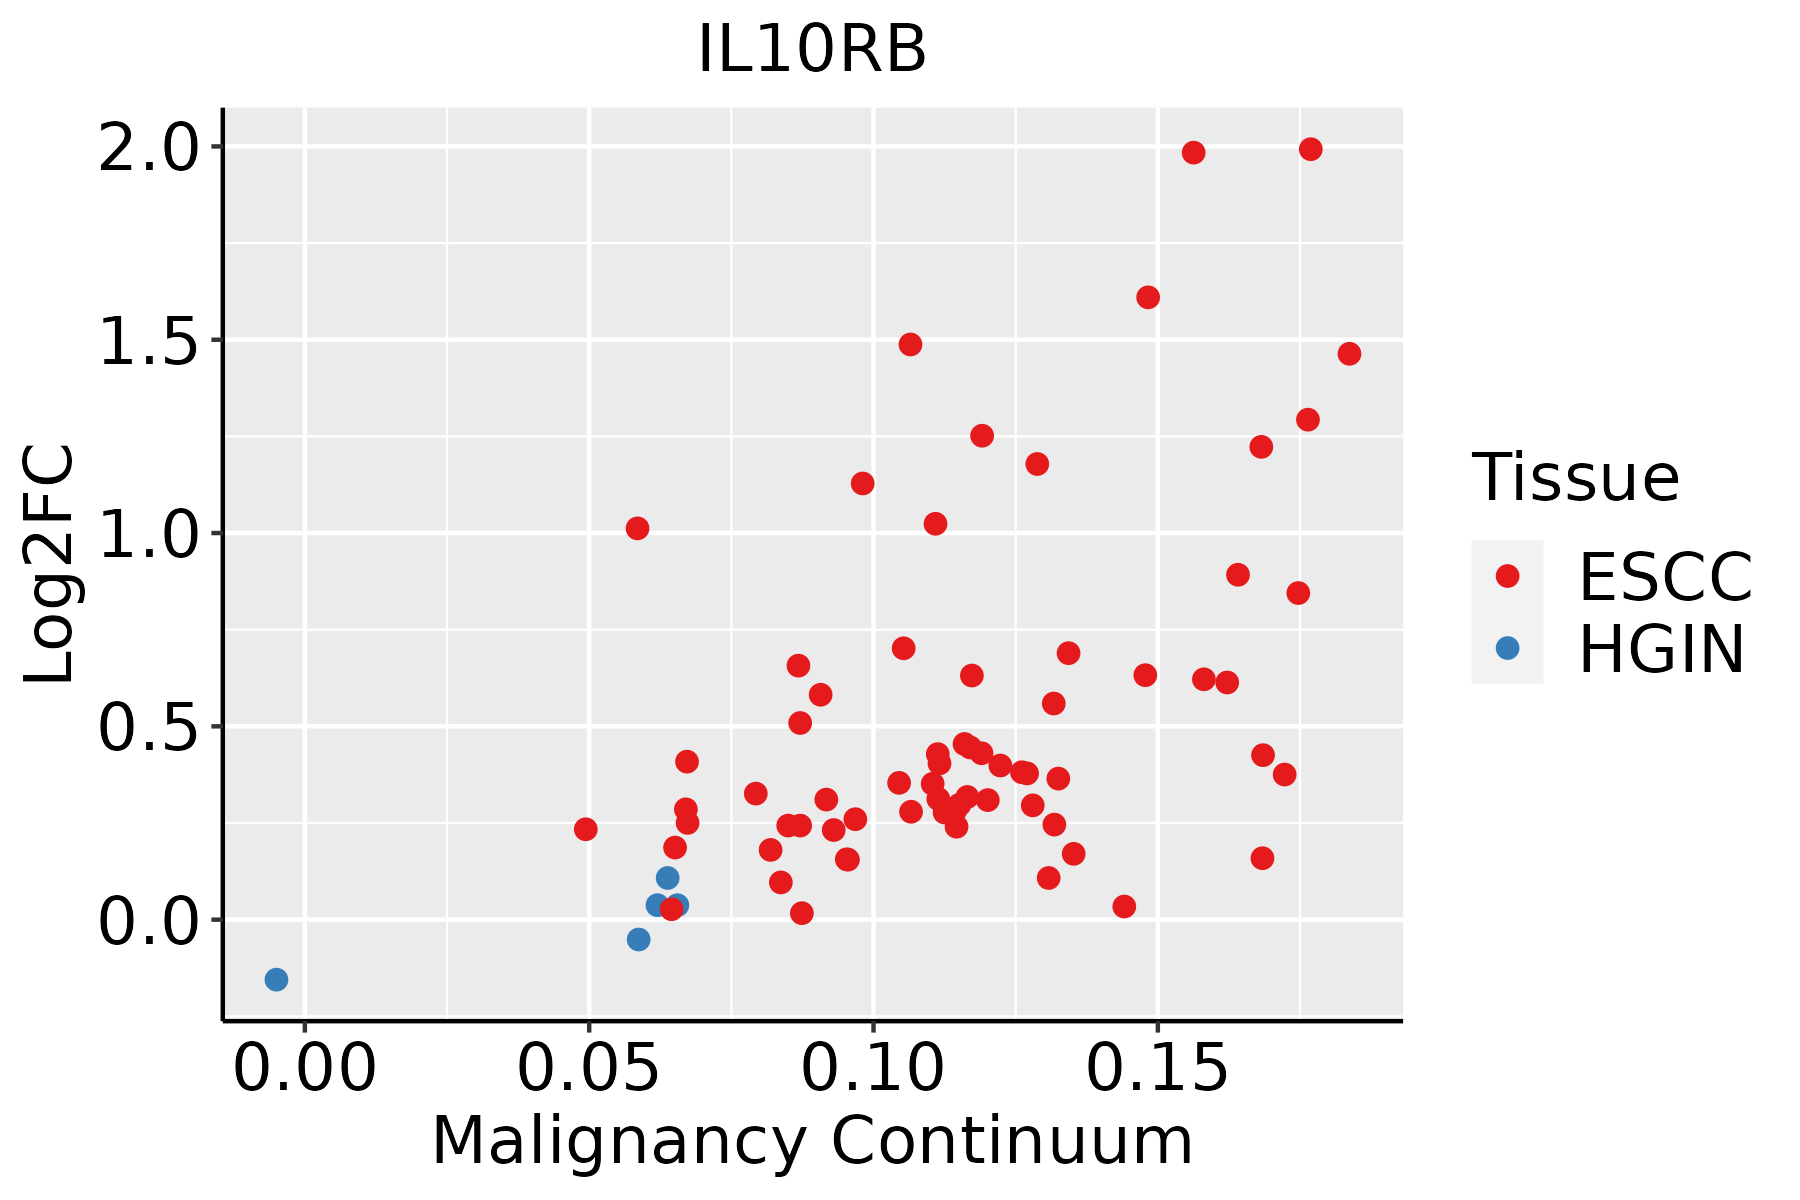 | ESCC: Esophageal squamous cell carcinoma |
| HGIN: High-grade intraepithelial neoplasias | ||
| LGIN: Low-grade intraepithelial neoplasias | ||
| Liver |  | HCC: Hepatocellular carcinoma |
| NAFLD: Non-alcoholic fatty liver disease | ||
| Oral Cavity | 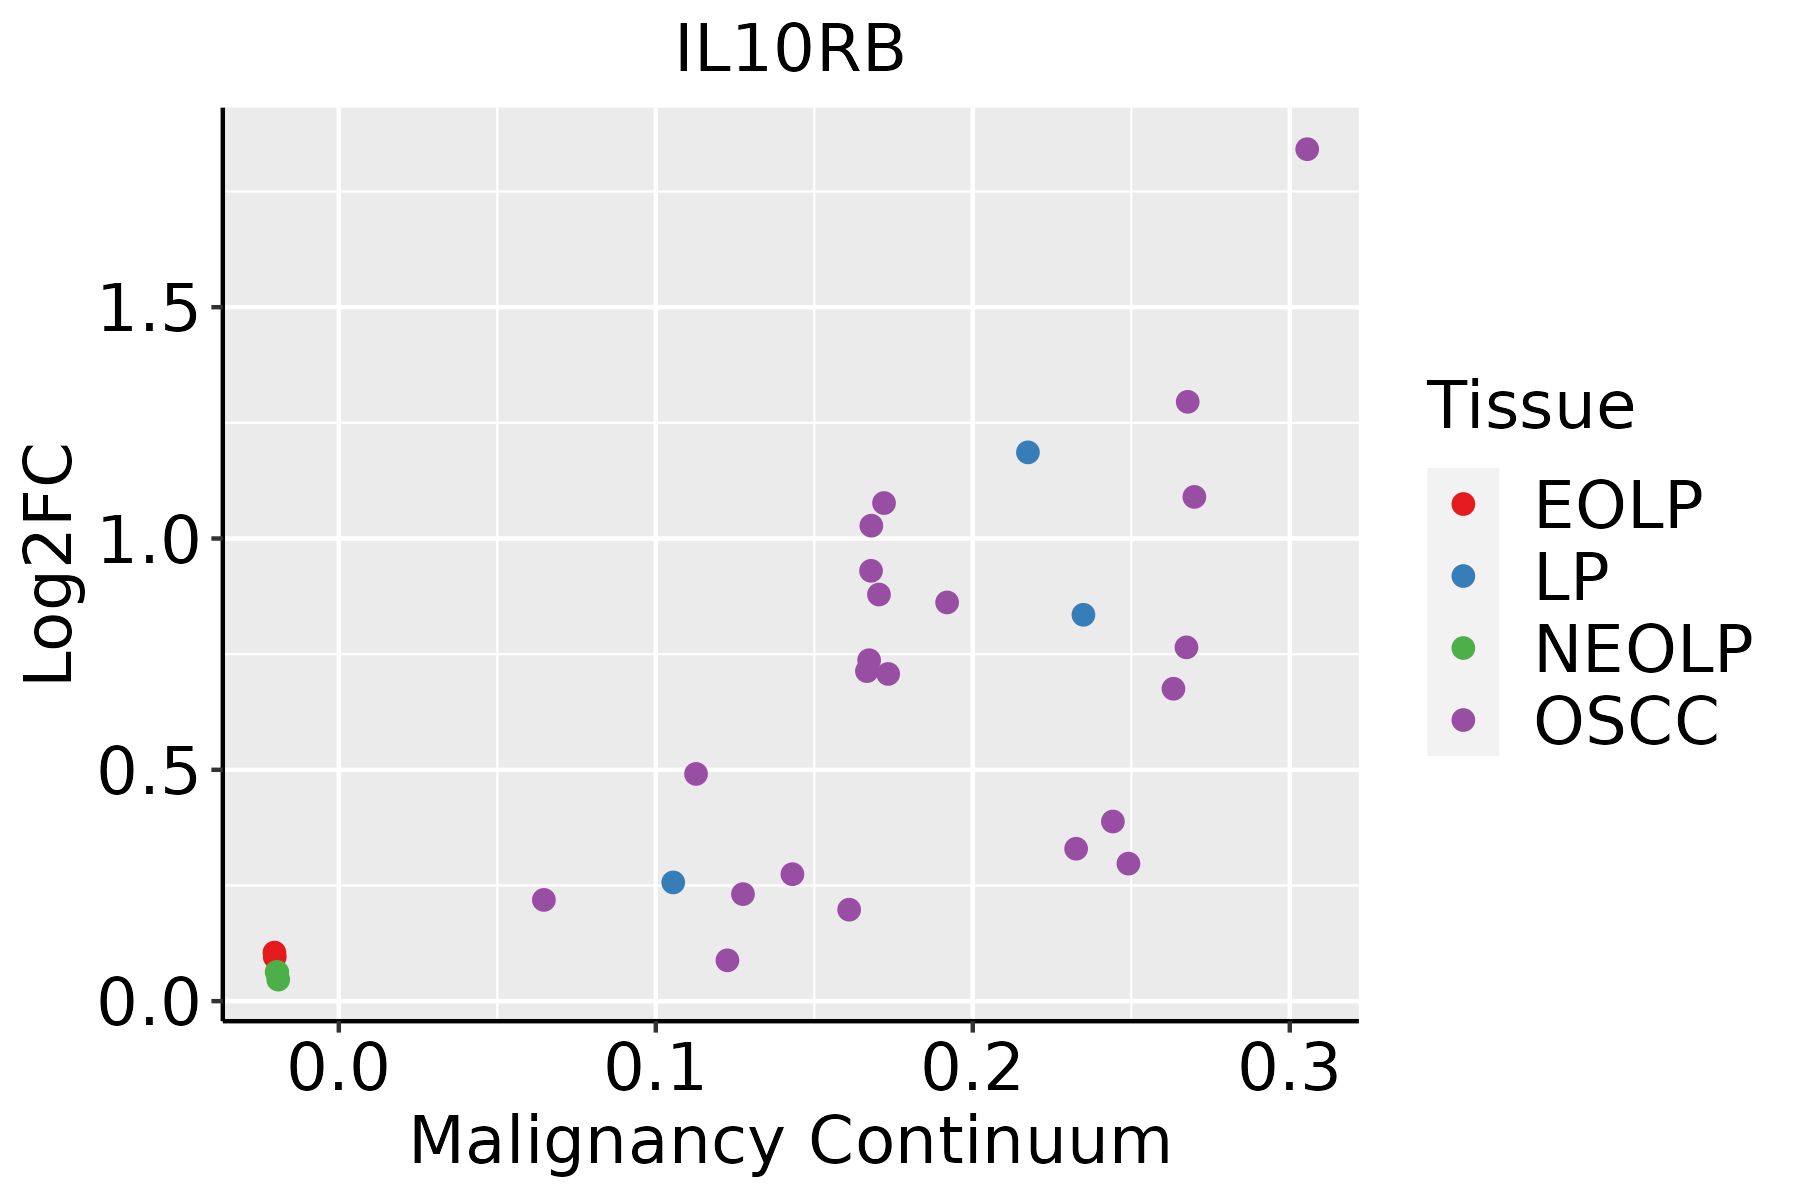 | EOLP: Erosive Oral lichen planus |
| LP: leukoplakia | ||
| NEOLP: Non-erosive oral lichen planus | ||
| OSCC: Oral squamous cell carcinoma | ||
| Skin | 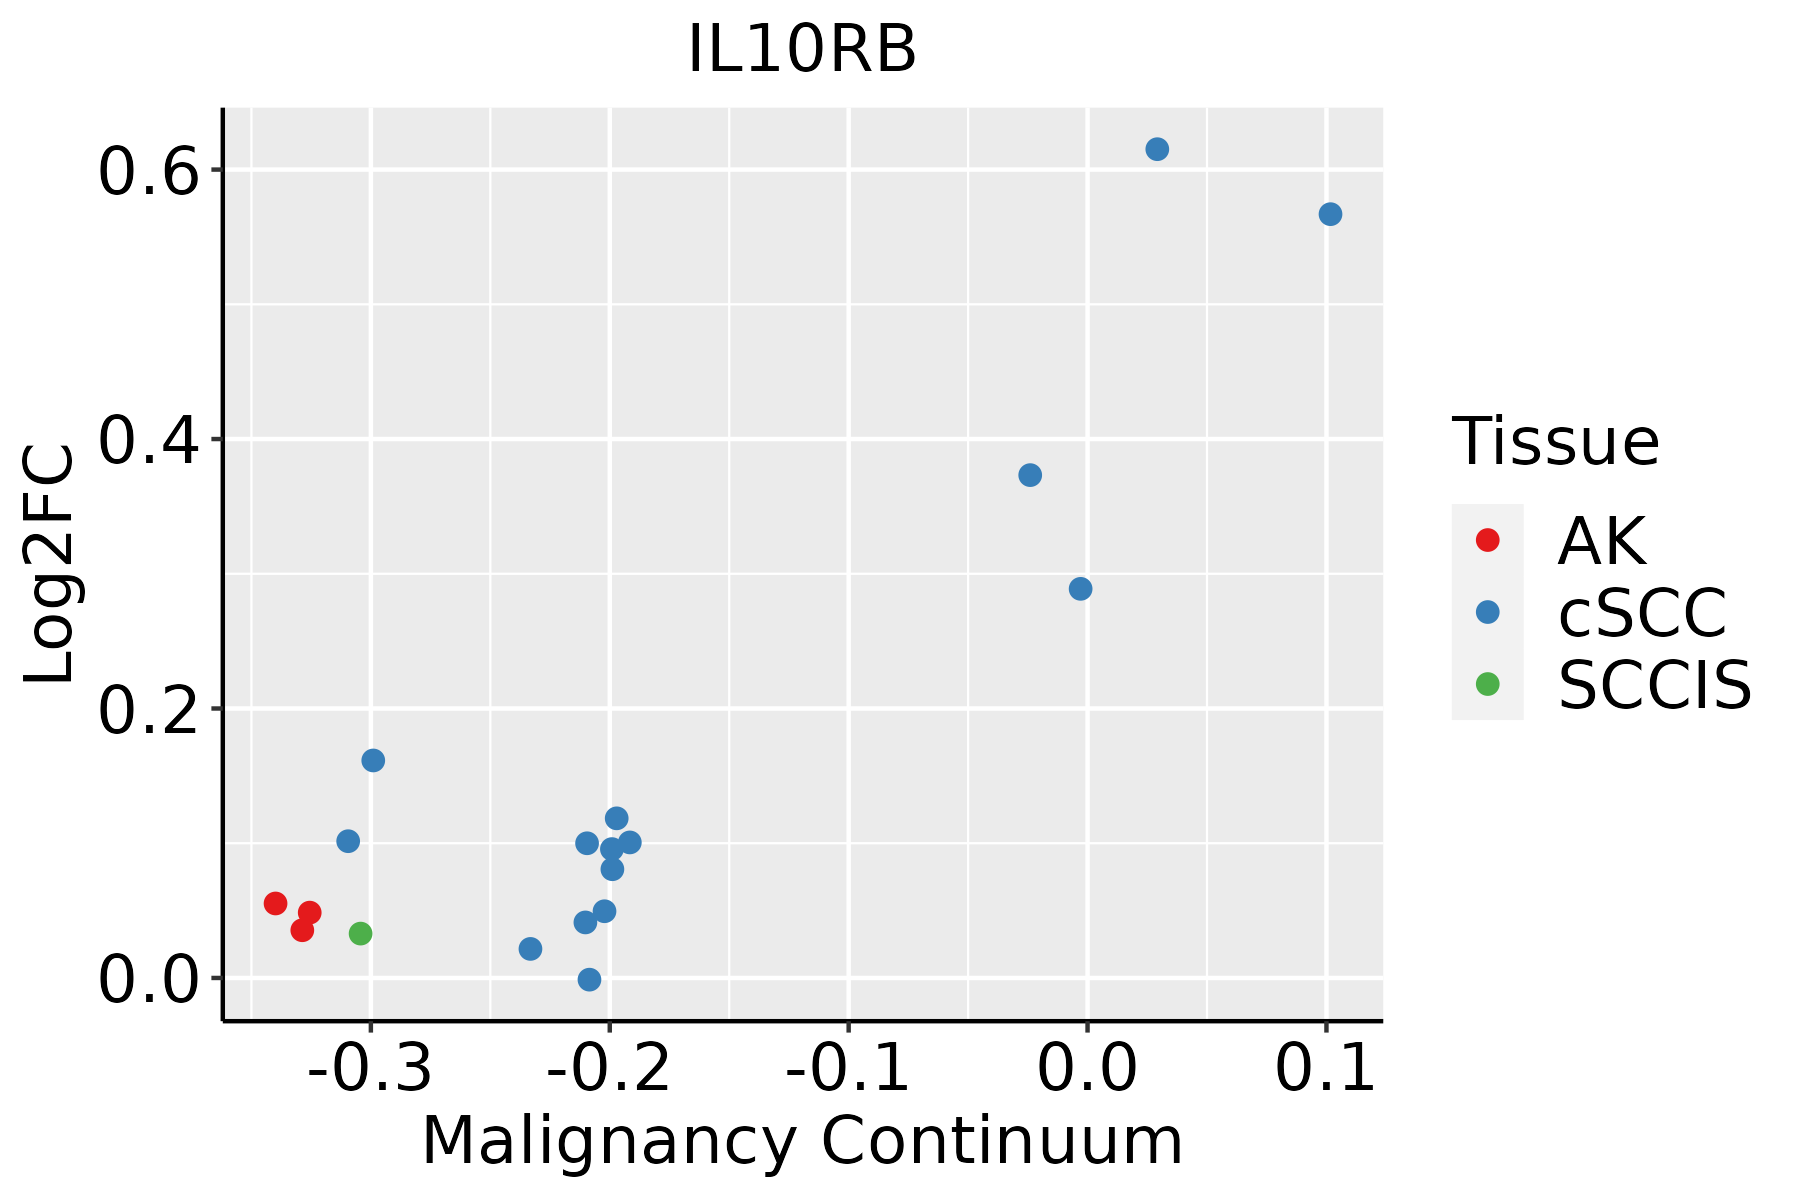 | AK: Actinic keratosis |
| cSCC: Cutaneous squamous cell carcinoma | ||
| SCCIS:squamous cell carcinoma in situ |
| ∗log2FC in expression of this searched gene in stem-like cells from each diseased tissue sample relative to stem-like cells in normal samples in each tissue plotted against the malignancy continuum. Samples are colored based on if they are from different disease stage. |
Top |
Malignant transformation related pathway analysis |
| Find out the enriched GO biological processes and KEGG pathways involved in transition from healthy to precancer to cancer |
| Tissue | Disease Stage | Enriched GO biological Processes |
| Colorectum | AD |  |
| Colorectum | SER |  |
| Colorectum | MSS |  |
| Colorectum | MSI-H |  |
| Colorectum | FAP |  |
| ∗Top 15 enriched GO BP terms are showed in the bar plot of each disease state in each tissue. Each row represents a significant GO biological process which is colored according to the -log10(p.adjust). |
| Page: 1 2 3 4 5 6 7 8 9 |
| GO ID | Tissue | Disease Stage | Description | Gene Ratio | Bg Ratio | pvalue | p.adjust | Count |
| GO:0006091 | Colorectum | AD | generation of precursor metabolites and energy | 209/3918 | 490/18723 | 3.17e-28 | 6.61e-25 | 209 |
| GO:0045333 | Colorectum | AD | cellular respiration | 119/3918 | 230/18723 | 3.21e-25 | 4.02e-22 | 119 |
| GO:0015980 | Colorectum | AD | energy derivation by oxidation of organic compounds | 143/3918 | 318/18723 | 2.78e-22 | 2.49e-19 | 143 |
| GO:0043467 | Colorectum | AD | regulation of generation of precursor metabolites and energy | 49/3918 | 130/18723 | 8.33e-06 | 1.99e-04 | 49 |
| GO:0043457 | Colorectum | AD | regulation of cellular respiration | 20/3918 | 49/18723 | 1.23e-03 | 1.09e-02 | 20 |
| GO:00453331 | Colorectum | SER | cellular respiration | 103/2897 | 230/18723 | 2.35e-26 | 3.61e-23 | 103 |
| GO:00060911 | Colorectum | SER | generation of precursor metabolites and energy | 168/2897 | 490/18723 | 1.39e-25 | 1.70e-22 | 168 |
| GO:00159801 | Colorectum | SER | energy derivation by oxidation of organic compounds | 119/2897 | 318/18723 | 5.28e-22 | 4.62e-19 | 119 |
| GO:00434671 | Colorectum | SER | regulation of generation of precursor metabolites and energy | 38/2897 | 130/18723 | 4.94e-05 | 1.21e-03 | 38 |
| GO:00434571 | Colorectum | SER | regulation of cellular respiration | 16/2897 | 49/18723 | 2.11e-03 | 2.06e-02 | 16 |
| GO:00060912 | Colorectum | MSS | generation of precursor metabolites and energy | 186/3467 | 490/18723 | 1.14e-24 | 2.15e-21 | 186 |
| GO:00453332 | Colorectum | MSS | cellular respiration | 107/3467 | 230/18723 | 1.64e-22 | 2.05e-19 | 107 |
| GO:00159802 | Colorectum | MSS | energy derivation by oxidation of organic compounds | 131/3467 | 318/18723 | 2.60e-21 | 2.70e-18 | 131 |
| GO:00434672 | Colorectum | MSS | regulation of generation of precursor metabolites and energy | 47/3467 | 130/18723 | 1.47e-06 | 4.85e-05 | 47 |
| GO:00434572 | Colorectum | MSS | regulation of cellular respiration | 19/3467 | 49/18723 | 7.20e-04 | 7.70e-03 | 19 |
| GO:00060913 | Colorectum | MSI-H | generation of precursor metabolites and energy | 93/1319 | 490/18723 | 7.35e-19 | 3.14e-16 | 93 |
| GO:00453333 | Colorectum | MSI-H | cellular respiration | 59/1319 | 230/18723 | 1.08e-18 | 4.27e-16 | 59 |
| GO:00159803 | Colorectum | MSI-H | energy derivation by oxidation of organic compounds | 67/1319 | 318/18723 | 2.97e-16 | 1.03e-13 | 67 |
| GO:00434673 | Colorectum | MSI-H | regulation of generation of precursor metabolites and energy | 21/1319 | 130/18723 | 2.90e-04 | 7.17e-03 | 21 |
| GO:0009615 | Colorectum | MSI-H | response to virus | 40/1319 | 367/18723 | 3.99e-03 | 4.61e-02 | 40 |
| Page: 1 2 3 4 |
| Pathway ID | Tissue | Disease Stage | Description | Gene Ratio | Bg Ratio | pvalue | p.adjust | qvalue | Count |
| hsa05163 | Colorectum | AD | Human cytomegalovirus infection | 75/2092 | 225/8465 | 2.00e-03 | 1.10e-02 | 7.01e-03 | 75 |
| hsa051631 | Colorectum | AD | Human cytomegalovirus infection | 75/2092 | 225/8465 | 2.00e-03 | 1.10e-02 | 7.01e-03 | 75 |
| hsa051632 | Colorectum | SER | Human cytomegalovirus infection | 57/1580 | 225/8465 | 7.40e-03 | 3.84e-02 | 2.79e-02 | 57 |
| hsa051633 | Colorectum | SER | Human cytomegalovirus infection | 57/1580 | 225/8465 | 7.40e-03 | 3.84e-02 | 2.79e-02 | 57 |
| hsa051634 | Colorectum | MSS | Human cytomegalovirus infection | 74/1875 | 225/8465 | 1.12e-04 | 1.01e-03 | 6.19e-04 | 74 |
| hsa051635 | Colorectum | MSS | Human cytomegalovirus infection | 74/1875 | 225/8465 | 1.12e-04 | 1.01e-03 | 6.19e-04 | 74 |
| hsa05163210 | Esophagus | ESCC | Human cytomegalovirus infection | 148/4205 | 225/8465 | 5.73e-07 | 4.00e-06 | 2.05e-06 | 148 |
| hsa0514525 | Esophagus | ESCC | Toxoplasmosis | 76/4205 | 112/8465 | 6.83e-05 | 2.90e-04 | 1.48e-04 | 76 |
| hsa051527 | Esophagus | ESCC | Tuberculosis | 111/4205 | 180/8465 | 7.14e-04 | 2.32e-03 | 1.19e-03 | 111 |
| hsa0516338 | Esophagus | ESCC | Human cytomegalovirus infection | 148/4205 | 225/8465 | 5.73e-07 | 4.00e-06 | 2.05e-06 | 148 |
| hsa05145111 | Esophagus | ESCC | Toxoplasmosis | 76/4205 | 112/8465 | 6.83e-05 | 2.90e-04 | 1.48e-04 | 76 |
| hsa0515212 | Esophagus | ESCC | Tuberculosis | 111/4205 | 180/8465 | 7.14e-04 | 2.32e-03 | 1.19e-03 | 111 |
| hsa0516312 | Liver | Cirrhotic | Human cytomegalovirus infection | 87/2530 | 225/8465 | 2.67e-03 | 1.10e-02 | 6.76e-03 | 87 |
| hsa0514512 | Liver | Cirrhotic | Toxoplasmosis | 47/2530 | 112/8465 | 4.16e-03 | 1.63e-02 | 1.00e-02 | 47 |
| hsa0516313 | Liver | Cirrhotic | Human cytomegalovirus infection | 87/2530 | 225/8465 | 2.67e-03 | 1.10e-02 | 6.76e-03 | 87 |
| hsa0514513 | Liver | Cirrhotic | Toxoplasmosis | 47/2530 | 112/8465 | 4.16e-03 | 1.63e-02 | 1.00e-02 | 47 |
| hsa0516322 | Liver | HCC | Human cytomegalovirus infection | 131/4020 | 225/8465 | 6.86e-04 | 2.77e-03 | 1.54e-03 | 131 |
| hsa0514521 | Liver | HCC | Toxoplasmosis | 70/4020 | 112/8465 | 9.25e-04 | 3.52e-03 | 1.96e-03 | 70 |
| hsa0516332 | Liver | HCC | Human cytomegalovirus infection | 131/4020 | 225/8465 | 6.86e-04 | 2.77e-03 | 1.54e-03 | 131 |
| hsa0514531 | Liver | HCC | Toxoplasmosis | 70/4020 | 112/8465 | 9.25e-04 | 3.52e-03 | 1.96e-03 | 70 |
| Page: 1 2 |
Top |
Cell-cell communication analysis |
| Identification of potential cell-cell interactions between two cell types and their ligand-receptor pairs for different disease states |
| Ligand | Receptor | LRpair | Pathway | Tissue | Disease Stage |
| IL10 | IL10RA_IL10RB | IL10_IL10RA_IL10RB | IL10 | Endometrium | ADJ |
| IL10 | IL10RA_IL10RB | IL10_IL10RA_IL10RB | IL10 | HNSCC | OSCC |
| IL10 | IL10RA_IL10RB | IL10_IL10RA_IL10RB | IL10 | Prostate | BPH |
| IL10 | IL10RA_IL10RB | IL10_IL10RA_IL10RB | IL10 | Prostate | Healthy |
| Page: 1 |
Top |
Single-cell gene regulatory network inference analysis |
| Find out the significant the regulons (TFs) and the target genes of each regulon across cell types for different disease states |
| TF | Cell Type | Tissue | Disease Stage | Target Gene | RSS | Regulon Activity |
| ∗The dot plots of a searched regulon are shown for all cell subpopulations in each disease state of each tissue based on the regulon specific score inferred using pySCENIC and by calculating the average expression. |
| Page: 1 |
Top |
Somatic mutation of malignant transformation related genes |
| Annotation of somatic variants for genes involved in malignant transformation |
| Hugo Symbol | Variant Class | Variant Classification | dbSNP RS | HGVSc | HGVSp | HGVSp Short | SWISSPROT | BIOTYPE | SIFT | PolyPhen | Tumor Sample Barcode | Tissue | Histology | Sex | Age | Stage | Therapy Types | Drugs | Outcome |
| IL10RB | SNV | Missense_Mutation | rs770606336 | c.358N>A | p.Val120Ile | p.V120I | Q08334 | protein_coding | tolerated(0.13) | benign(0.045) | TCGA-A2-A04P-01 | Breast | breast invasive carcinoma | Female | <65 | III/IV | Chemotherapy | taxol | PD |
| IL10RB | SNV | Missense_Mutation | rs138134904 | c.388N>T | p.Arg130Cys | p.R130C | Q08334 | protein_coding | tolerated(0.09) | benign(0.364) | TCGA-A2-A04X-01 | Breast | breast invasive carcinoma | Female | <65 | I/II | Chemotherapy | adriamycin | SD |
| IL10RB | SNV | Missense_Mutation | novel | c.92N>A | p.Ser31Tyr | p.S31Y | Q08334 | protein_coding | deleterious(0) | probably_damaging(1) | TCGA-AN-A046-01 | Breast | breast invasive carcinoma | Female | >=65 | I/II | Unknown | Unknown | SD |
| IL10RB | SNV | Missense_Mutation | c.907G>C | p.Glu303Gln | p.E303Q | Q08334 | protein_coding | tolerated(0.22) | benign(0.067) | TCGA-BH-A0W7-01 | Breast | breast invasive carcinoma | Female | <65 | I/II | Chemotherapy | taxotere | CR | |
| IL10RB | SNV | Missense_Mutation | rs771890796 | c.857N>T | p.Ser286Leu | p.S286L | Q08334 | protein_coding | deleterious(0.04) | benign(0.01) | TCGA-EW-A1PG-01 | Breast | breast invasive carcinoma | Female | <65 | I/II | Chemotherapy | docetaxel | SD |
| IL10RB | insertion | Frame_Shift_Ins | novel | c.911_912insACGTCATCAGCTTGCTACCAGGTGGCTGGTCAGT | p.Ser304ArgfsTer19 | p.S304Rfs*19 | Q08334 | protein_coding | TCGA-BH-A0B8-01 | Breast | breast invasive carcinoma | Female | <65 | I/II | Hormone Therapy | arimidex | SD | ||
| IL10RB | SNV | Missense_Mutation | novel | c.261N>C | p.Leu87Phe | p.L87F | Q08334 | protein_coding | deleterious(0.02) | probably_damaging(0.951) | TCGA-C5-A1MF-01 | Cervix | cervical & endocervical cancer | Female | <65 | I/II | Unknown | Unknown | SD |
| IL10RB | SNV | Missense_Mutation | rs776256199 | c.209N>T | p.Thr70Ile | p.T70I | Q08334 | protein_coding | tolerated(0.23) | benign(0.001) | TCGA-AA-3713-01 | Colorectum | colon adenocarcinoma | Male | >=65 | III/IV | Chemotherapy | 5-fluorouracil | PR |
| IL10RB | SNV | Missense_Mutation | c.908N>C | p.Glu303Ala | p.E303A | Q08334 | protein_coding | deleterious(0.02) | benign(0.211) | TCGA-AA-3811-01 | Colorectum | colon adenocarcinoma | Female | >=65 | III/IV | Unknown | Unknown | PD | |
| IL10RB | SNV | Missense_Mutation | rs763342351 | c.592N>T | p.Arg198Trp | p.R198W | Q08334 | protein_coding | tolerated(0.15) | benign(0.02) | TCGA-AA-A00N-01 | Colorectum | colon adenocarcinoma | Male | >=65 | I/II | Unknown | Unknown | PD |
| Page: 1 2 3 4 |
Top |
Related drugs of malignant transformation related genes |
| Identification of chemicals and drugs interact with genes involved in malignant transfromation |
| (DGIdb 4.0) |
| Entrez ID | Symbol | Category | Interaction Types | Drug Claim Name | Drug Name | PMIDs |
| 3588 | IL10RB | DRUGGABLE GENOME | agonist | CHEMBL2108723 | PEGINTERFERON LAMBDA-1A | |
| 3588 | IL10RB | DRUGGABLE GENOME | PEG-INTERFERON LAMBA |
| Page: 1 |

Copyright 2023-Present -The University of Texas Health Science Center at Houston |