
|
|||||
|
 | |
| |
| |
| |
| |
| |
|
Gene: IL10 |
Gene summary for IL10 |
| Gene information | Species | Human | Gene symbol | IL10 | Gene ID | 3586 |
| Gene name | interleukin 10 | |
| Gene Alias | CSIF | |
| Cytomap | 1q32.1 | |
| Gene Type | protein-coding | GO ID | GO:0000003 | UniProtAcc | P22301 |
Top |
Malignant transformation analysis |
| Identification of the aberrant gene expression in precancerous and cancerous lesions by comparing the gene expression of stem-like cells in diseased tissues with normal stem cells |
| Entrez ID | Symbol | Replicates | Species | Organ | Tissue | Adj P-value | Log2FC | Malignancy |
| 3586 | IL10 | HCC1 | Human | Liver | HCC | 1.33e-05 | 1.05e+00 | 0.5336 |
| 3586 | IL10 | HCC2 | Human | Liver | HCC | 1.12e-12 | 8.98e-01 | 0.5341 |
| 3586 | IL10 | HCC5 | Human | Liver | HCC | 3.27e-06 | 6.32e-01 | 0.4932 |
| Page: 1 |
| Tissue | Expression Dynamics | Abbreviation |
| Liver | 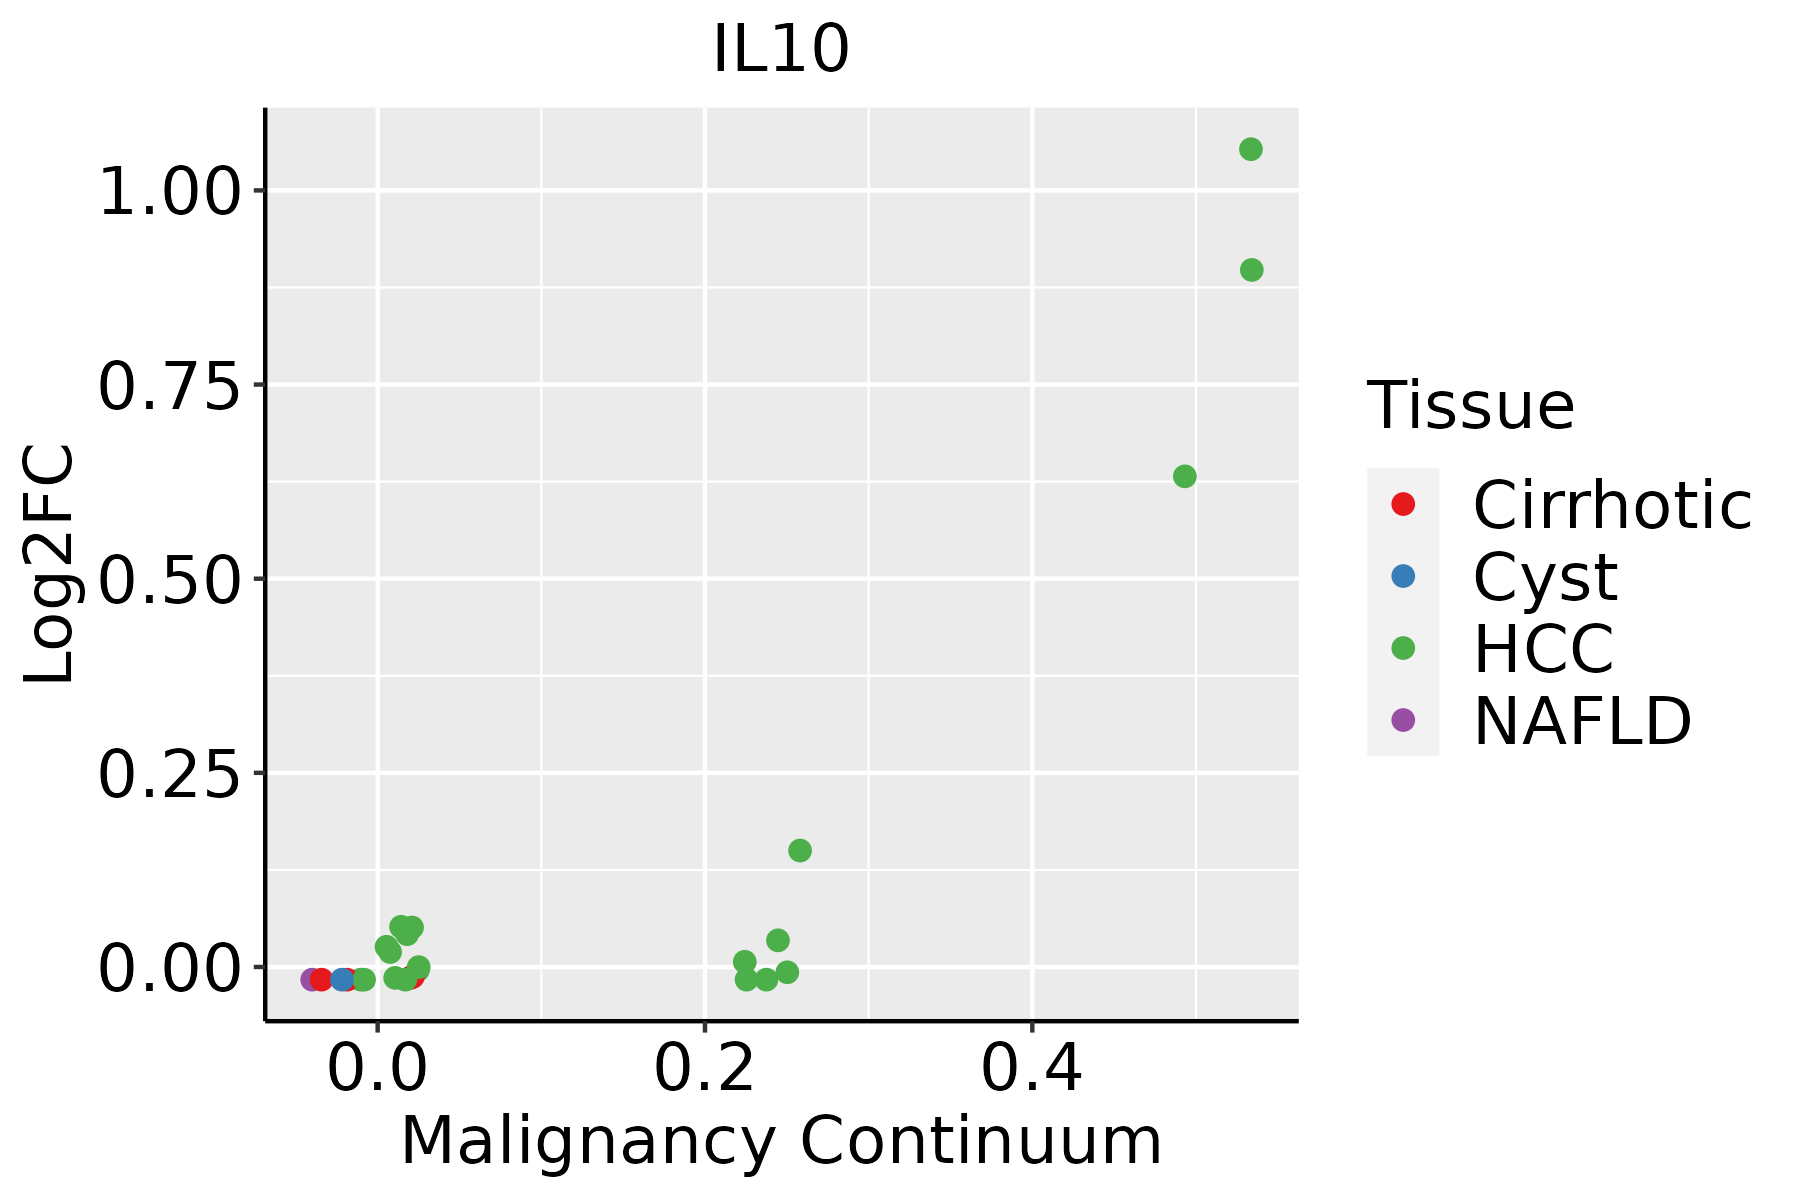 | HCC: Hepatocellular carcinoma |
| NAFLD: Non-alcoholic fatty liver disease |
| ∗log2FC in expression of this searched gene in stem-like cells from each diseased tissue sample relative to stem-like cells in normal samples in each tissue plotted against the malignancy continuum. Samples are colored based on if they are from different disease stage. |
Top |
Malignant transformation related pathway analysis |
| Find out the enriched GO biological processes and KEGG pathways involved in transition from healthy to precancer to cancer |
| Tissue | Disease Stage | Enriched GO biological Processes |
| Colorectum | AD |  |
| Colorectum | SER |  |
| Colorectum | MSS |  |
| Colorectum | MSI-H |  |
| Colorectum | FAP |  |
| ∗Top 15 enriched GO BP terms are showed in the bar plot of each disease state in each tissue. Each row represents a significant GO biological process which is colored according to the -log10(p.adjust). |
| Page: 1 2 3 4 5 6 7 8 9 |
| GO ID | Tissue | Disease Stage | Description | Gene Ratio | Bg Ratio | pvalue | p.adjust | Count |
| GO:0006091 | Colorectum | AD | generation of precursor metabolites and energy | 209/3918 | 490/18723 | 3.17e-28 | 6.61e-25 | 209 |
| GO:0045333 | Colorectum | AD | cellular respiration | 119/3918 | 230/18723 | 3.21e-25 | 4.02e-22 | 119 |
| GO:0015980 | Colorectum | AD | energy derivation by oxidation of organic compounds | 143/3918 | 318/18723 | 2.78e-22 | 2.49e-19 | 143 |
| GO:0043467 | Colorectum | AD | regulation of generation of precursor metabolites and energy | 49/3918 | 130/18723 | 8.33e-06 | 1.99e-04 | 49 |
| GO:0043457 | Colorectum | AD | regulation of cellular respiration | 20/3918 | 49/18723 | 1.23e-03 | 1.09e-02 | 20 |
| GO:00453331 | Colorectum | SER | cellular respiration | 103/2897 | 230/18723 | 2.35e-26 | 3.61e-23 | 103 |
| GO:00060911 | Colorectum | SER | generation of precursor metabolites and energy | 168/2897 | 490/18723 | 1.39e-25 | 1.70e-22 | 168 |
| GO:00159801 | Colorectum | SER | energy derivation by oxidation of organic compounds | 119/2897 | 318/18723 | 5.28e-22 | 4.62e-19 | 119 |
| GO:00434671 | Colorectum | SER | regulation of generation of precursor metabolites and energy | 38/2897 | 130/18723 | 4.94e-05 | 1.21e-03 | 38 |
| GO:00434571 | Colorectum | SER | regulation of cellular respiration | 16/2897 | 49/18723 | 2.11e-03 | 2.06e-02 | 16 |
| GO:00060912 | Colorectum | MSS | generation of precursor metabolites and energy | 186/3467 | 490/18723 | 1.14e-24 | 2.15e-21 | 186 |
| GO:00453332 | Colorectum | MSS | cellular respiration | 107/3467 | 230/18723 | 1.64e-22 | 2.05e-19 | 107 |
| GO:00159802 | Colorectum | MSS | energy derivation by oxidation of organic compounds | 131/3467 | 318/18723 | 2.60e-21 | 2.70e-18 | 131 |
| GO:00434672 | Colorectum | MSS | regulation of generation of precursor metabolites and energy | 47/3467 | 130/18723 | 1.47e-06 | 4.85e-05 | 47 |
| GO:00434572 | Colorectum | MSS | regulation of cellular respiration | 19/3467 | 49/18723 | 7.20e-04 | 7.70e-03 | 19 |
| GO:00060913 | Colorectum | MSI-H | generation of precursor metabolites and energy | 93/1319 | 490/18723 | 7.35e-19 | 3.14e-16 | 93 |
| GO:00453333 | Colorectum | MSI-H | cellular respiration | 59/1319 | 230/18723 | 1.08e-18 | 4.27e-16 | 59 |
| GO:00159803 | Colorectum | MSI-H | energy derivation by oxidation of organic compounds | 67/1319 | 318/18723 | 2.97e-16 | 1.03e-13 | 67 |
| GO:00434673 | Colorectum | MSI-H | regulation of generation of precursor metabolites and energy | 21/1319 | 130/18723 | 2.90e-04 | 7.17e-03 | 21 |
| GO:0009615 | Colorectum | MSI-H | response to virus | 40/1319 | 367/18723 | 3.99e-03 | 4.61e-02 | 40 |
| Page: 1 2 3 4 5 6 7 8 |
| Pathway ID | Tissue | Disease Stage | Description | Gene Ratio | Bg Ratio | pvalue | p.adjust | qvalue | Count |
| hsa0513542 | Liver | HCC | Yersinia infection | 92/4020 | 137/8465 | 2.25e-06 | 2.19e-05 | 1.22e-05 | 92 |
| hsa040684 | Liver | HCC | FoxO signaling pathway | 85/4020 | 131/8465 | 3.99e-05 | 2.16e-04 | 1.20e-04 | 85 |
| hsa0514521 | Liver | HCC | Toxoplasmosis | 70/4020 | 112/8465 | 9.25e-04 | 3.52e-03 | 1.96e-03 | 70 |
| hsa051332 | Liver | HCC | Pertussis | 48/4020 | 76/8465 | 4.17e-03 | 1.27e-02 | 7.06e-03 | 48 |
| hsa05142 | Liver | HCC | Chagas disease | 61/4020 | 102/8465 | 8.04e-03 | 2.17e-02 | 1.21e-02 | 61 |
| hsa0513552 | Liver | HCC | Yersinia infection | 92/4020 | 137/8465 | 2.25e-06 | 2.19e-05 | 1.22e-05 | 92 |
| hsa040685 | Liver | HCC | FoxO signaling pathway | 85/4020 | 131/8465 | 3.99e-05 | 2.16e-04 | 1.20e-04 | 85 |
| hsa0514531 | Liver | HCC | Toxoplasmosis | 70/4020 | 112/8465 | 9.25e-04 | 3.52e-03 | 1.96e-03 | 70 |
| hsa051333 | Liver | HCC | Pertussis | 48/4020 | 76/8465 | 4.17e-03 | 1.27e-02 | 7.06e-03 | 48 |
| hsa051421 | Liver | HCC | Chagas disease | 61/4020 | 102/8465 | 8.04e-03 | 2.17e-02 | 1.21e-02 | 61 |
| Page: 1 |
Top |
Cell-cell communication analysis |
| Identification of potential cell-cell interactions between two cell types and their ligand-receptor pairs for different disease states |
| Ligand | Receptor | LRpair | Pathway | Tissue | Disease Stage |
| IL10 | IL10RA_IL10RB | IL10_IL10RA_IL10RB | IL10 | Endometrium | ADJ |
| IL10 | IL10RA_IL10RB | IL10_IL10RA_IL10RB | IL10 | HNSCC | OSCC |
| IL10 | IL10RA_IL10RB | IL10_IL10RA_IL10RB | IL10 | Prostate | BPH |
| IL10 | IL10RA_IL10RB | IL10_IL10RA_IL10RB | IL10 | Prostate | Healthy |
| Page: 1 |
Top |
Single-cell gene regulatory network inference analysis |
| Find out the significant the regulons (TFs) and the target genes of each regulon across cell types for different disease states |
| TF | Cell Type | Tissue | Disease Stage | Target Gene | RSS | Regulon Activity |
| ∗The dot plots of a searched regulon are shown for all cell subpopulations in each disease state of each tissue based on the regulon specific score inferred using pySCENIC and by calculating the average expression. |
| Page: 1 |
Top |
Somatic mutation of malignant transformation related genes |
| Annotation of somatic variants for genes involved in malignant transformation |
| Hugo Symbol | Variant Class | Variant Classification | dbSNP RS | HGVSc | HGVSp | HGVSp Short | SWISSPROT | BIOTYPE | SIFT | PolyPhen | Tumor Sample Barcode | Tissue | Histology | Sex | Age | Stage | Therapy Types | Drugs | Outcome |
| IL10 | SNV | Missense_Mutation | rs746523858 | c.370N>T | p.Arg124Trp | p.R124W | P22301 | protein_coding | deleterious(0) | probably_damaging(0.991) | TCGA-S3-A6ZG-01 | Breast | breast invasive carcinoma | Female | >=65 | I/II | Chemotherapy | doxorubicin | CR |
| IL10 | insertion | Frame_Shift_Ins | novel | c.138_139insAAGGGAAGGGAGGCTCTGCTTCCTGATTGCAG | p.Ala47LysfsTer16 | p.A47Kfs*16 | P22301 | protein_coding | TCGA-A7-A0CJ-01 | Breast | breast invasive carcinoma | Female | <65 | I/II | Chemotherapy | cytoxan | SD | ||
| IL10 | deletion | Frame_Shift_Del | novel | c.37delC | p.Leu13Ter | p.L13* | P22301 | protein_coding | TCGA-D8-A27V-01 | Breast | breast invasive carcinoma | Female | <65 | I/II | Hormone Therapy | tamoxiphen | SD | ||
| IL10 | SNV | Missense_Mutation | novel | c.383G>A | p.Arg128Gln | p.R128Q | P22301 | protein_coding | deleterious(0.03) | possibly_damaging(0.863) | TCGA-2W-A8YY-01 | Cervix | cervical & endocervical cancer | Female | <65 | I/II | Chemotherapy | cisplatin | CR |
| IL10 | SNV | Missense_Mutation | c.373C>T | p.Arg125Cys | p.R125C | P22301 | protein_coding | deleterious(0) | benign(0.02) | TCGA-AA-3977-01 | Colorectum | colon adenocarcinoma | Male | >=65 | I/II | Unknown | Unknown | SD | |
| IL10 | SNV | Missense_Mutation | c.337N>A | p.Gly113Arg | p.G113R | P22301 | protein_coding | deleterious(0) | probably_damaging(1) | TCGA-CK-6746-01 | Colorectum | colon adenocarcinoma | Female | >=65 | I/II | Unknown | Unknown | SD | |
| IL10 | SNV | Missense_Mutation | novel | c.342G>T | p.Glu114Asp | p.E114D | P22301 | protein_coding | tolerated(0.25) | probably_damaging(0.962) | TCGA-AG-A002-01 | Colorectum | rectum adenocarcinoma | Male | <65 | I/II | Unknown | Unknown | SD |
| IL10 | SNV | Missense_Mutation | novel | c.388N>A | p.Leu130Ile | p.L130I | P22301 | protein_coding | deleterious(0.03) | probably_damaging(0.934) | TCGA-EI-6917-01 | Colorectum | rectum adenocarcinoma | Male | <65 | III/IV | Chemotherapy | 5fluorouracil+oxaciplatina+l-folinian | SD |
| IL10 | SNV | Missense_Mutation | rs760738439 | c.445N>T | p.Leu149Phe | p.L149F | P22301 | protein_coding | deleterious(0) | probably_damaging(0.998) | TCGA-A5-A0G1-01 | Endometrium | uterine corpus endometrioid carcinoma | Female | >=65 | I/II | Unknown | Unknown | SD |
| IL10 | SNV | Missense_Mutation | novel | c.383N>A | p.Arg128Gln | p.R128Q | P22301 | protein_coding | deleterious(0.03) | possibly_damaging(0.863) | TCGA-A5-A2K5-01 | Endometrium | uterine corpus endometrioid carcinoma | Female | >=65 | I/II | Unknown | Unknown | SD |
| Page: 1 2 |
Top |
Related drugs of malignant transformation related genes |
| Identification of chemicals and drugs interact with genes involved in malignant transfromation |
| (DGIdb 4.0) |
| Entrez ID | Symbol | Category | Interaction Types | Drug Claim Name | Drug Name | PMIDs |
| 3586 | IL10 | CLINICALLY ACTIONABLE, DRUGGABLE GENOME, GROWTH FACTOR | FLUTICASONE PROPIONATE | 12372131 | ||
| 3586 | IL10 | CLINICALLY ACTIONABLE, DRUGGABLE GENOME, GROWTH FACTOR | tacrolimus | TACROLIMUS | 21359536 | |
| 3586 | IL10 | CLINICALLY ACTIONABLE, DRUGGABLE GENOME, GROWTH FACTOR | ROFECOXIB | ROFECOXIB | 15613743 | |
| 3586 | IL10 | CLINICALLY ACTIONABLE, DRUGGABLE GENOME, GROWTH FACTOR | RAPAMYCIN | SIROLIMUS | 12907620 | |
| 3586 | IL10 | CLINICALLY ACTIONABLE, DRUGGABLE GENOME, GROWTH FACTOR | MACROLIDE ANTIBIOTIC | 16476120 | ||
| 3586 | IL10 | CLINICALLY ACTIONABLE, DRUGGABLE GENOME, GROWTH FACTOR | AMOXICILLIN | AMOXICILLIN | 16815316 | |
| 3586 | IL10 | CLINICALLY ACTIONABLE, DRUGGABLE GENOME, GROWTH FACTOR | inhibitor | CHEMBL2109460 | SCH-708980 | |
| 3586 | IL10 | CLINICALLY ACTIONABLE, DRUGGABLE GENOME, GROWTH FACTOR | MESALAMINE | MESALAMINE | 15887108 | |
| 3586 | IL10 | CLINICALLY ACTIONABLE, DRUGGABLE GENOME, GROWTH FACTOR | efavirenz | EFAVIRENZ | 24819158 | |
| 3586 | IL10 | CLINICALLY ACTIONABLE, DRUGGABLE GENOME, GROWTH FACTOR | ATRA | TRETINOIN | 8982293 |
| Page: 1 2 3 |

Copyright 2023-Present -The University of Texas Health Science Center at Houston |