
|
|||||
|
 | |
| |
| |
| |
| |
| |
|
Gene: IKZF2 |
Gene summary for IKZF2 |
| Gene information | Species | Human | Gene symbol | IKZF2 | Gene ID | 22807 |
| Gene name | IKAROS family zinc finger 2 | |
| Gene Alias | ANF1A2 | |
| Cytomap | 2q34 | |
| Gene Type | protein-coding | GO ID | GO:0006139 | UniProtAcc | Q9UKS7 |
Top |
Malignant transformation analysis |
| Identification of the aberrant gene expression in precancerous and cancerous lesions by comparing the gene expression of stem-like cells in diseased tissues with normal stem cells |
| Entrez ID | Symbol | Replicates | Species | Organ | Tissue | Adj P-value | Log2FC | Malignancy |
| 22807 | IKZF2 | CCI_1 | Human | Cervix | CC | 8.67e-07 | 1.06e+00 | 0.528 |
| 22807 | IKZF2 | CCI_3 | Human | Cervix | CC | 4.41e-14 | 9.11e-01 | 0.516 |
| 22807 | IKZF2 | RNA-P17T-P17T-4 | Human | Lung | IAC | 1.49e-03 | 6.31e-01 | 0.343 |
| 22807 | IKZF2 | RNA-P17T-P17T-8 | Human | Lung | IAC | 3.17e-03 | 4.95e-01 | 0.3329 |
| 22807 | IKZF2 | RNA-P25T1-P25T1-1 | Human | Lung | AIS | 3.66e-03 | 3.53e-01 | -0.2116 |
| 22807 | IKZF2 | RNA-P25T1-P25T1-3 | Human | Lung | AIS | 8.31e-04 | 5.08e-01 | -0.2107 |
| 22807 | IKZF2 | RNA-P6T2-P6T2-1 | Human | Lung | IAC | 8.80e-05 | 2.86e-01 | -0.0166 |
| 22807 | IKZF2 | RNA-P6T2-P6T2-2 | Human | Lung | IAC | 2.14e-09 | 3.75e-01 | -0.0132 |
| 22807 | IKZF2 | RNA-P6T2-P6T2-3 | Human | Lung | IAC | 4.67e-10 | 4.03e-01 | -0.013 |
| 22807 | IKZF2 | RNA-P6T2-P6T2-4 | Human | Lung | IAC | 1.05e-06 | 3.35e-01 | -0.0121 |
| 22807 | IKZF2 | male-WTA | Human | Thyroid | PTC | 1.08e-32 | 4.07e-01 | 0.1037 |
| 22807 | IKZF2 | PTC01 | Human | Thyroid | PTC | 9.57e-17 | 3.21e-01 | 0.1899 |
| 22807 | IKZF2 | PTC03 | Human | Thyroid | PTC | 2.33e-03 | 2.28e-01 | 0.1784 |
| 22807 | IKZF2 | PTC04 | Human | Thyroid | PTC | 8.15e-44 | 9.35e-01 | 0.1927 |
| 22807 | IKZF2 | PTC05 | Human | Thyroid | PTC | 4.99e-22 | 8.52e-01 | 0.2065 |
| 22807 | IKZF2 | PTC06 | Human | Thyroid | PTC | 1.32e-53 | 1.14e+00 | 0.2057 |
| 22807 | IKZF2 | PTC07 | Human | Thyroid | PTC | 2.08e-45 | 7.43e-01 | 0.2044 |
| 22807 | IKZF2 | ATC12 | Human | Thyroid | ATC | 3.47e-02 | -8.11e-03 | 0.34 |
| 22807 | IKZF2 | ATC13 | Human | Thyroid | ATC | 2.82e-06 | -3.28e-04 | 0.34 |
| 22807 | IKZF2 | ATC5 | Human | Thyroid | ATC | 2.65e-03 | 5.52e-03 | 0.34 |
| Page: 1 |
| Tissue | Expression Dynamics | Abbreviation |
| Cervix |  | CC: Cervix cancer |
| HSIL_HPV: HPV-infected high-grade squamous intraepithelial lesions | ||
| N_HPV: HPV-infected normal cervix | ||
| Lung | 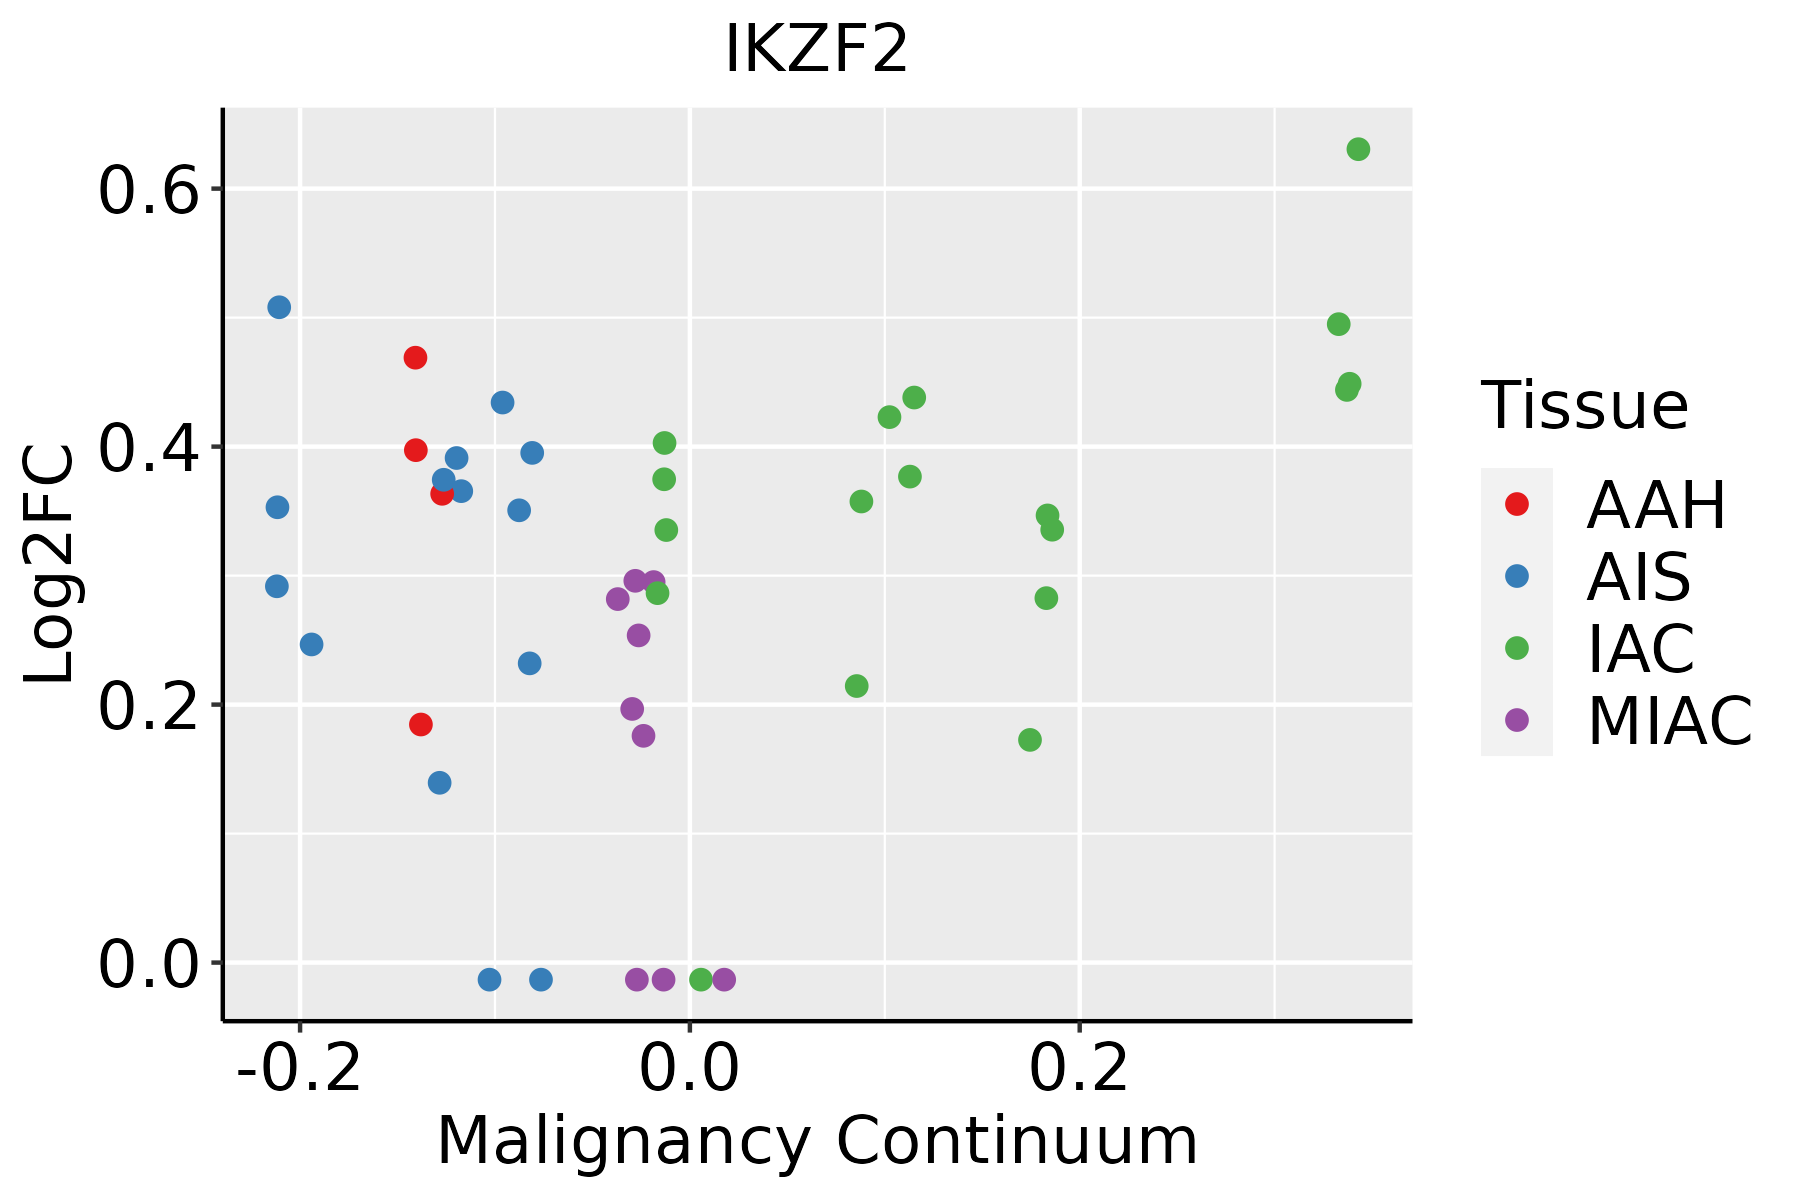 | AAH: Atypical adenomatous hyperplasia |
| AIS: Adenocarcinoma in situ | ||
| IAC: Invasive lung adenocarcinoma | ||
| MIA: Minimally invasive adenocarcinoma | ||
| Thyroid | 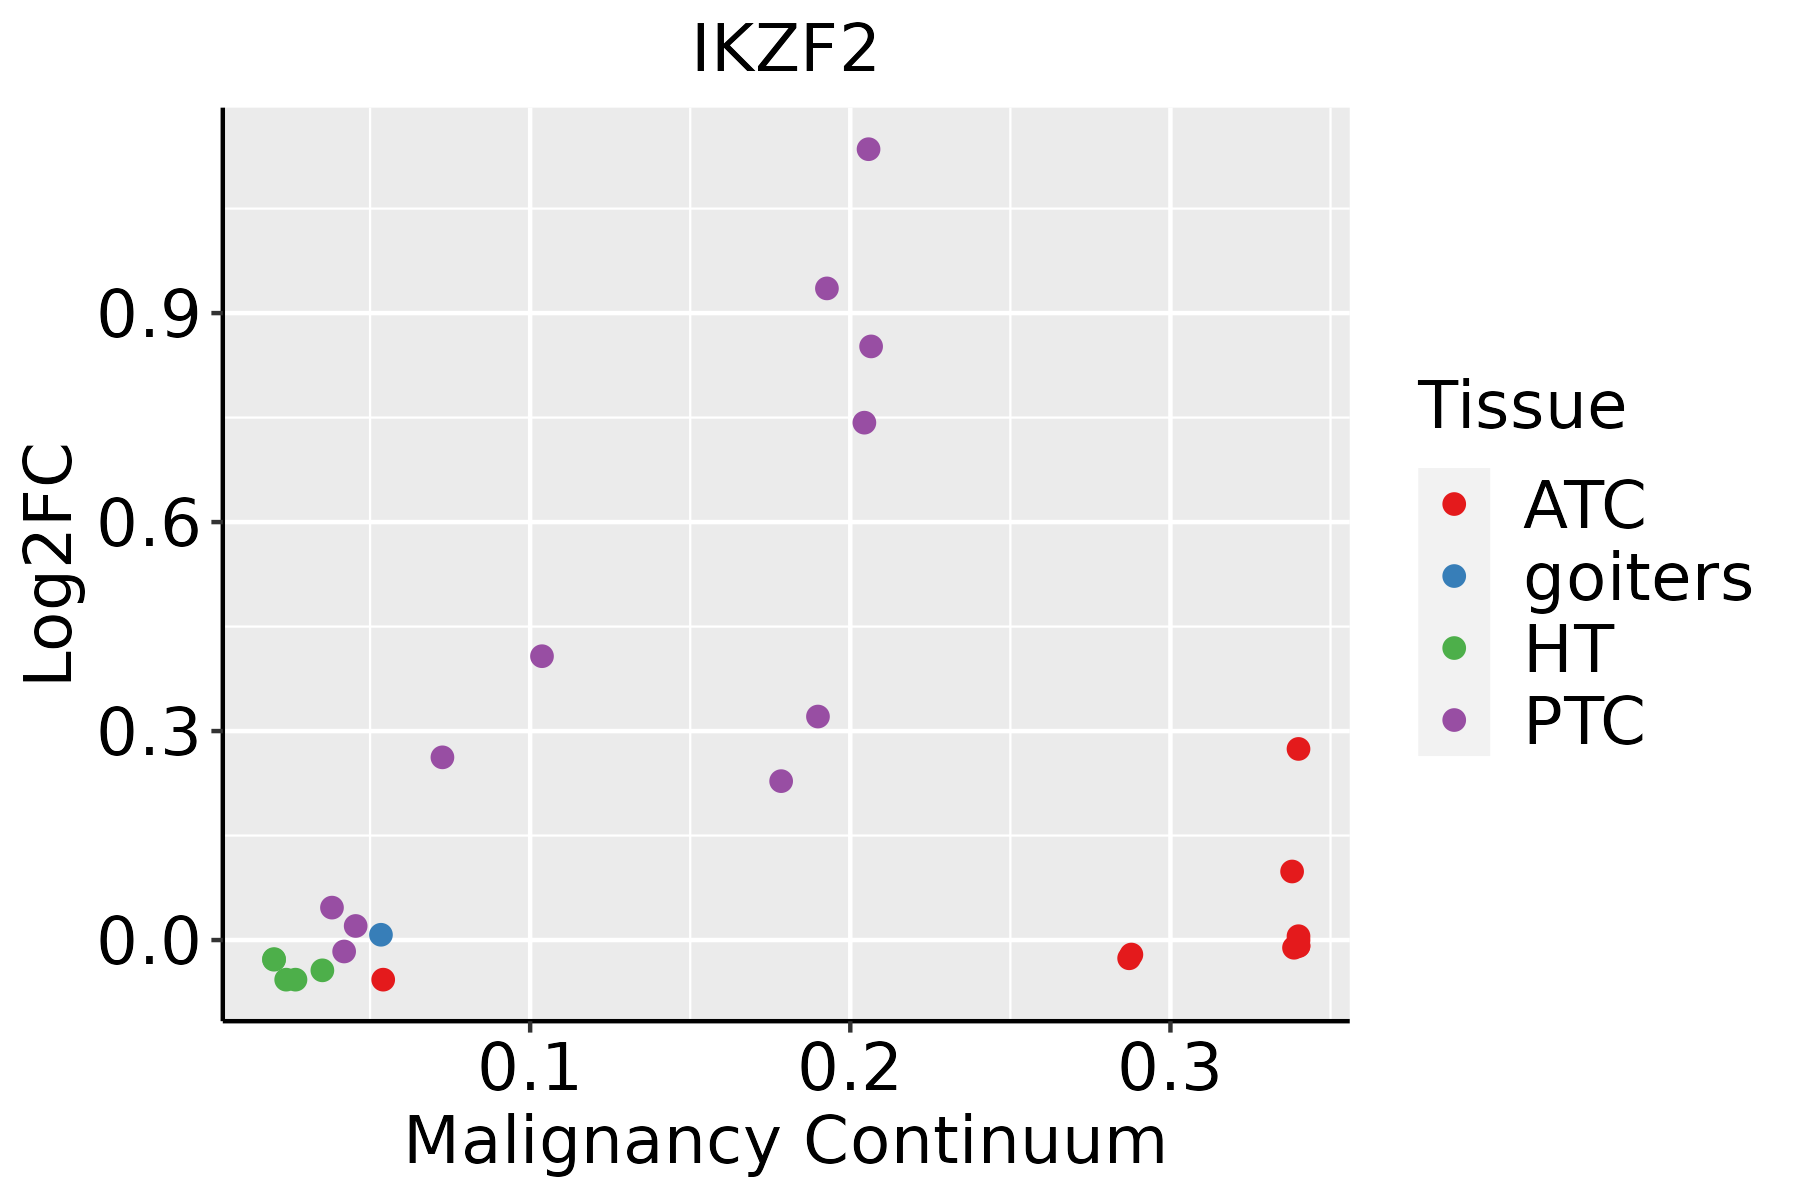 | ATC: Anaplastic thyroid cancer |
| HT: Hashimoto's thyroiditis | ||
| PTC: Papillary thyroid cancer |
| ∗log2FC in expression of this searched gene in stem-like cells from each diseased tissue sample relative to stem-like cells in normal samples in each tissue plotted against the malignancy continuum. Samples are colored based on if they are from different disease stage. |
Top |
Malignant transformation related pathway analysis |
| Find out the enriched GO biological processes and KEGG pathways involved in transition from healthy to precancer to cancer |
| Tissue | Disease Stage | Enriched GO biological Processes |
| Colorectum | AD |  |
| Colorectum | SER |  |
| Colorectum | MSS |  |
| Colorectum | MSI-H |  |
| Colorectum | FAP |  |
| ∗Top 15 enriched GO BP terms are showed in the bar plot of each disease state in each tissue. Each row represents a significant GO biological process which is colored according to the -log10(p.adjust). |
| Page: 1 2 3 4 5 6 7 8 9 |
| GO ID | Tissue | Disease Stage | Description | Gene Ratio | Bg Ratio | pvalue | p.adjust | Count |
| Page: 1 |
| Pathway ID | Tissue | Disease Stage | Description | Gene Ratio | Bg Ratio | pvalue | p.adjust | qvalue | Count |
| Page: 1 |
Top |
Cell-cell communication analysis |
| Identification of potential cell-cell interactions between two cell types and their ligand-receptor pairs for different disease states |
| Ligand | Receptor | LRpair | Pathway | Tissue | Disease Stage |
| Page: 1 |
Top |
Single-cell gene regulatory network inference analysis |
| Find out the significant the regulons (TFs) and the target genes of each regulon across cell types for different disease states |
| TF | Cell Type | Tissue | Disease Stage | Target Gene | RSS | Regulon Activity |
| IKZF2 | PLA | Breast | ADJ | FOXP3,RTKN2,TIGIT, etc. | 1.49e-01 |  |
| IKZF2 | TREG | Breast | DCIS | FOXP3,RTKN2,TIGIT, etc. | 2.77e-01 |  |
| IKZF2 | TREG | Breast | Healthy | FOXP3,RTKN2,TIGIT, etc. | 1.28e-01 |  |
| IKZF2 | TREG | Breast | IDC | FOXP3,RTKN2,TIGIT, etc. | 2.67e-01 |  |
| IKZF2 | CD8TEREX | Colorectum | AD | NCALD,ITGA1,CBLB, etc. | 2.67e-01 |  |
| IKZF2 | TFH | Colorectum | ADJ | NCALD,ITGA1,CBLB, etc. | 1.24e-01 |  |
| IKZF2 | MAIT | Colorectum | ADJ | NCALD,ITGA1,CBLB, etc. | 1.17e-01 | |
| IKZF2 | TREG | Colorectum | ADJ | NCALD,ITGA1,CBLB, etc. | 1.54e-01 | |
| IKZF2 | CD8TEREX | Colorectum | ADJ | NCALD,ITGA1,CBLB, etc. | 1.30e-01 | |
| IKZF2 | TREG | Colorectum | CRC | NCALD,ITGA1,CBLB, etc. | 1.48e-01 |  |
| ∗The dot plots of a searched regulon are shown for all cell subpopulations in each disease state of each tissue based on the regulon specific score inferred using pySCENIC and by calculating the average expression. |
| Page: 1 2 3 4 5 6 7 8 9 10 11 |
Top |
Somatic mutation of malignant transformation related genes |
| Annotation of somatic variants for genes involved in malignant transformation |
| Hugo Symbol | Variant Class | Variant Classification | dbSNP RS | HGVSc | HGVSp | HGVSp Short | SWISSPROT | BIOTYPE | SIFT | PolyPhen | Tumor Sample Barcode | Tissue | Histology | Sex | Age | Stage | Therapy Types | Drugs | Outcome |
| IKZF2 | SNV | Missense_Mutation | c.1079A>T | p.His360Leu | p.H360L | Q9UKS7 | protein_coding | tolerated(0.34) | benign(0.316) | TCGA-A1-A0SO-01 | Breast | breast invasive carcinoma | Female | >=65 | I/II | Chemotherapy | SD | ||
| IKZF2 | SNV | Missense_Mutation | novel | c.650N>A | p.Arg217His | p.R217H | Q9UKS7 | protein_coding | deleterious(0) | possibly_damaging(0.791) | TCGA-AN-A046-01 | Breast | breast invasive carcinoma | Female | >=65 | I/II | Unknown | Unknown | SD |
| IKZF2 | SNV | Missense_Mutation | c.1165C>A | p.Pro389Thr | p.P389T | Q9UKS7 | protein_coding | tolerated(0.2) | possibly_damaging(0.606) | TCGA-C8-A12X-01 | Breast | breast invasive carcinoma | Female | <65 | I/II | Unknown | Unknown | SD | |
| IKZF2 | SNV | Missense_Mutation | rs754170741 | c.623G>A | p.Arg208His | p.R208H | Q9UKS7 | protein_coding | deleterious(0.03) | probably_damaging(0.991) | TCGA-S3-AA17-01 | Breast | breast invasive carcinoma | Female | <65 | I/II | Hormone Therapy | anastrozole | SD |
| IKZF2 | insertion | Frame_Shift_Ins | novel | c.170_171insAATGTCATGGAAG | p.Asp57GlufsTer6 | p.D57Efs*6 | Q9UKS7 | protein_coding | TCGA-AO-A128-01 | Breast | breast invasive carcinoma | Female | <65 | I/II | Chemotherapy | doxorubicin | SD | ||
| IKZF2 | SNV | Missense_Mutation | c.500C>T | p.Pro167Leu | p.P167L | Q9UKS7 | protein_coding | deleterious(0) | probably_damaging(1) | TCGA-2W-A8YY-01 | Cervix | cervical & endocervical cancer | Female | <65 | I/II | Chemotherapy | cisplatin | CR | |
| IKZF2 | SNV | Missense_Mutation | novel | c.470N>A | p.Arg157Lys | p.R157K | Q9UKS7 | protein_coding | deleterious(0) | probably_damaging(0.992) | TCGA-C5-A3HD-01 | Cervix | cervical & endocervical cancer | Female | <65 | I/II | Chemotherapy | cisplatin | SD |
| IKZF2 | SNV | Missense_Mutation | c.605G>C | p.Gly202Ala | p.G202A | Q9UKS7 | protein_coding | deleterious(0) | benign(0.096) | TCGA-DG-A2KM-01 | Cervix | cervical & endocervical cancer | Female | <65 | I/II | Chemotherapy | cisplatin | SD | |
| IKZF2 | SNV | Missense_Mutation | novel | c.205G>A | p.Asp69Asn | p.D69N | Q9UKS7 | protein_coding | deleterious(0.02) | benign(0.001) | TCGA-HM-A4S6-01 | Cervix | cervical & endocervical cancer | Female | <65 | III/IV | Chemotherapy | cisplatin | CR |
| IKZF2 | SNV | Missense_Mutation | novel | c.547C>G | p.Leu183Val | p.L183V | Q9UKS7 | protein_coding | deleterious(0) | probably_damaging(0.996) | TCGA-VS-A9UL-01 | Cervix | cervical & endocervical cancer | Female | >=65 | III/IV | Unknown | Unknown | PD |
| Page: 1 2 3 4 5 6 7 8 |
Top |
Related drugs of malignant transformation related genes |
| Identification of chemicals and drugs interact with genes involved in malignant transfromation |
| (DGIdb 4.0) |
| Entrez ID | Symbol | Category | Interaction Types | Drug Claim Name | Drug Name | PMIDs |
| Page: 1 |

Copyright 2023-Present -The University of Texas Health Science Center at Houston |