
|
|||||
|
 | |
| |
| |
| |
| |
| |
|
Gene: IKBKG |
Gene summary for IKBKG |
| Gene information | Species | Human | Gene symbol | IKBKG | Gene ID | 8517 |
| Gene name | inhibitor of nuclear factor kappa B kinase regulatory subunit gamma | |
| Gene Alias | AMCBX1 | |
| Cytomap | Xq28 | |
| Gene Type | protein-coding | GO ID | GO:0002253 | UniProtAcc | Q9Y6K9 |
Top |
Malignant transformation analysis |
| Identification of the aberrant gene expression in precancerous and cancerous lesions by comparing the gene expression of stem-like cells in diseased tissues with normal stem cells |
| Entrez ID | Symbol | Replicates | Species | Organ | Tissue | Adj P-value | Log2FC | Malignancy |
| 8517 | IKBKG | LZE4T | Human | Esophagus | ESCC | 9.56e-12 | 3.45e-01 | 0.0811 |
| 8517 | IKBKG | LZE7T | Human | Esophagus | ESCC | 9.56e-23 | 7.24e-01 | 0.0667 |
| 8517 | IKBKG | LZE8T | Human | Esophagus | ESCC | 2.72e-03 | 1.33e-01 | 0.067 |
| 8517 | IKBKG | LZE20T | Human | Esophagus | ESCC | 3.16e-03 | 1.42e-01 | 0.0662 |
| 8517 | IKBKG | LZE22D1 | Human | Esophagus | HGIN | 5.14e-03 | 1.82e-01 | 0.0595 |
| 8517 | IKBKG | LZE22T | Human | Esophagus | ESCC | 1.00e-09 | 5.15e-01 | 0.068 |
| 8517 | IKBKG | LZE24T | Human | Esophagus | ESCC | 1.02e-31 | 6.14e-01 | 0.0596 |
| 8517 | IKBKG | LZE21T | Human | Esophagus | ESCC | 9.73e-05 | 3.44e-01 | 0.0655 |
| 8517 | IKBKG | P1T-E | Human | Esophagus | ESCC | 1.42e-19 | 8.50e-01 | 0.0875 |
| 8517 | IKBKG | P2T-E | Human | Esophagus | ESCC | 3.19e-23 | 3.71e-01 | 0.1177 |
| 8517 | IKBKG | P4T-E | Human | Esophagus | ESCC | 2.45e-12 | 2.61e-01 | 0.1323 |
| 8517 | IKBKG | P5T-E | Human | Esophagus | ESCC | 3.52e-19 | 3.20e-01 | 0.1327 |
| 8517 | IKBKG | P8T-E | Human | Esophagus | ESCC | 7.31e-14 | 2.95e-01 | 0.0889 |
| 8517 | IKBKG | P9T-E | Human | Esophagus | ESCC | 1.36e-37 | 6.93e-01 | 0.1131 |
| 8517 | IKBKG | P10T-E | Human | Esophagus | ESCC | 9.74e-22 | 4.32e-01 | 0.116 |
| 8517 | IKBKG | P11T-E | Human | Esophagus | ESCC | 6.27e-12 | 4.02e-01 | 0.1426 |
| 8517 | IKBKG | P12T-E | Human | Esophagus | ESCC | 5.17e-27 | 5.01e-01 | 0.1122 |
| 8517 | IKBKG | P15T-E | Human | Esophagus | ESCC | 1.87e-22 | 4.81e-01 | 0.1149 |
| 8517 | IKBKG | P16T-E | Human | Esophagus | ESCC | 9.56e-08 | 1.36e-01 | 0.1153 |
| 8517 | IKBKG | P17T-E | Human | Esophagus | ESCC | 9.15e-12 | 3.87e-01 | 0.1278 |
| Page: 1 2 3 4 5 6 |
| Tissue | Expression Dynamics | Abbreviation |
| Esophagus | 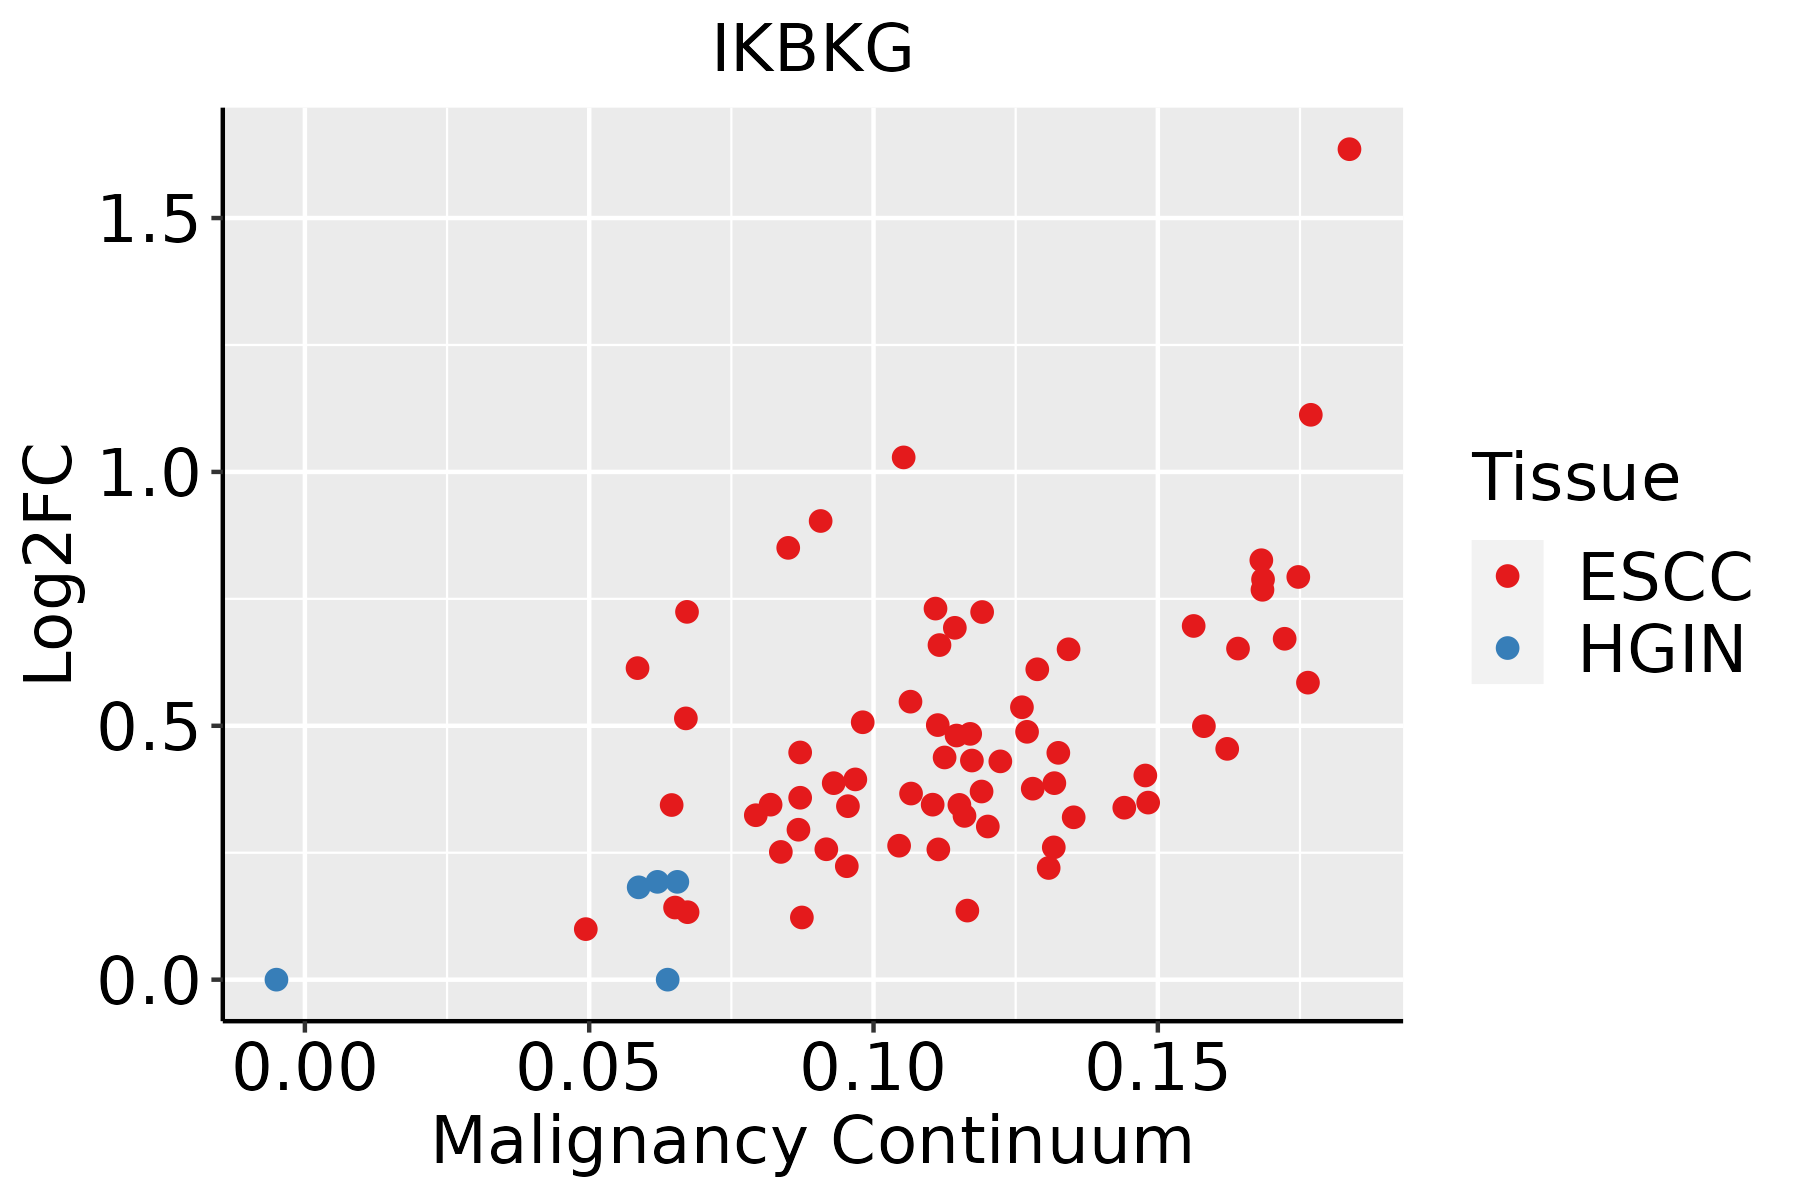 | ESCC: Esophageal squamous cell carcinoma |
| HGIN: High-grade intraepithelial neoplasias | ||
| LGIN: Low-grade intraepithelial neoplasias | ||
| Liver | 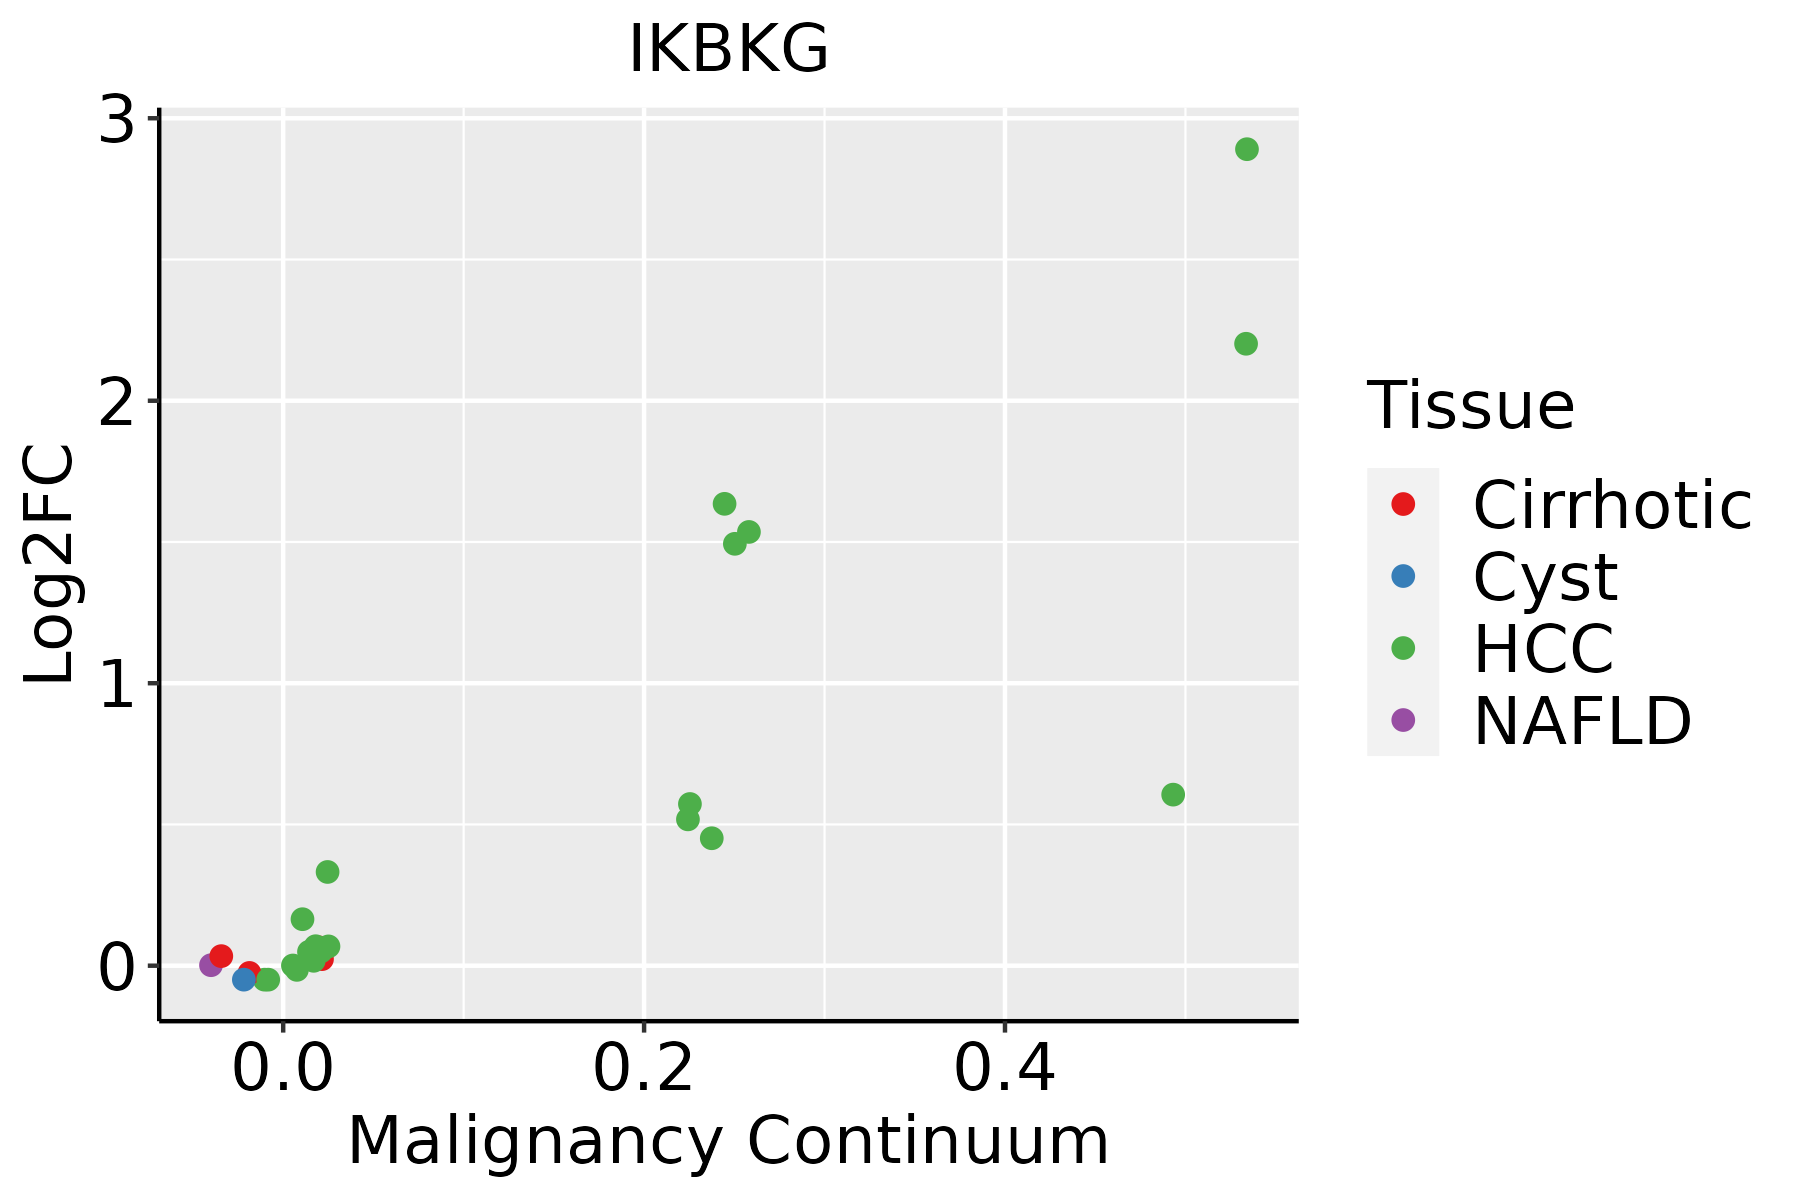 | HCC: Hepatocellular carcinoma |
| NAFLD: Non-alcoholic fatty liver disease | ||
| Oral Cavity |  | EOLP: Erosive Oral lichen planus |
| LP: leukoplakia | ||
| NEOLP: Non-erosive oral lichen planus | ||
| OSCC: Oral squamous cell carcinoma | ||
| Skin |  | AK: Actinic keratosis |
| cSCC: Cutaneous squamous cell carcinoma | ||
| SCCIS:squamous cell carcinoma in situ | ||
| Thyroid | 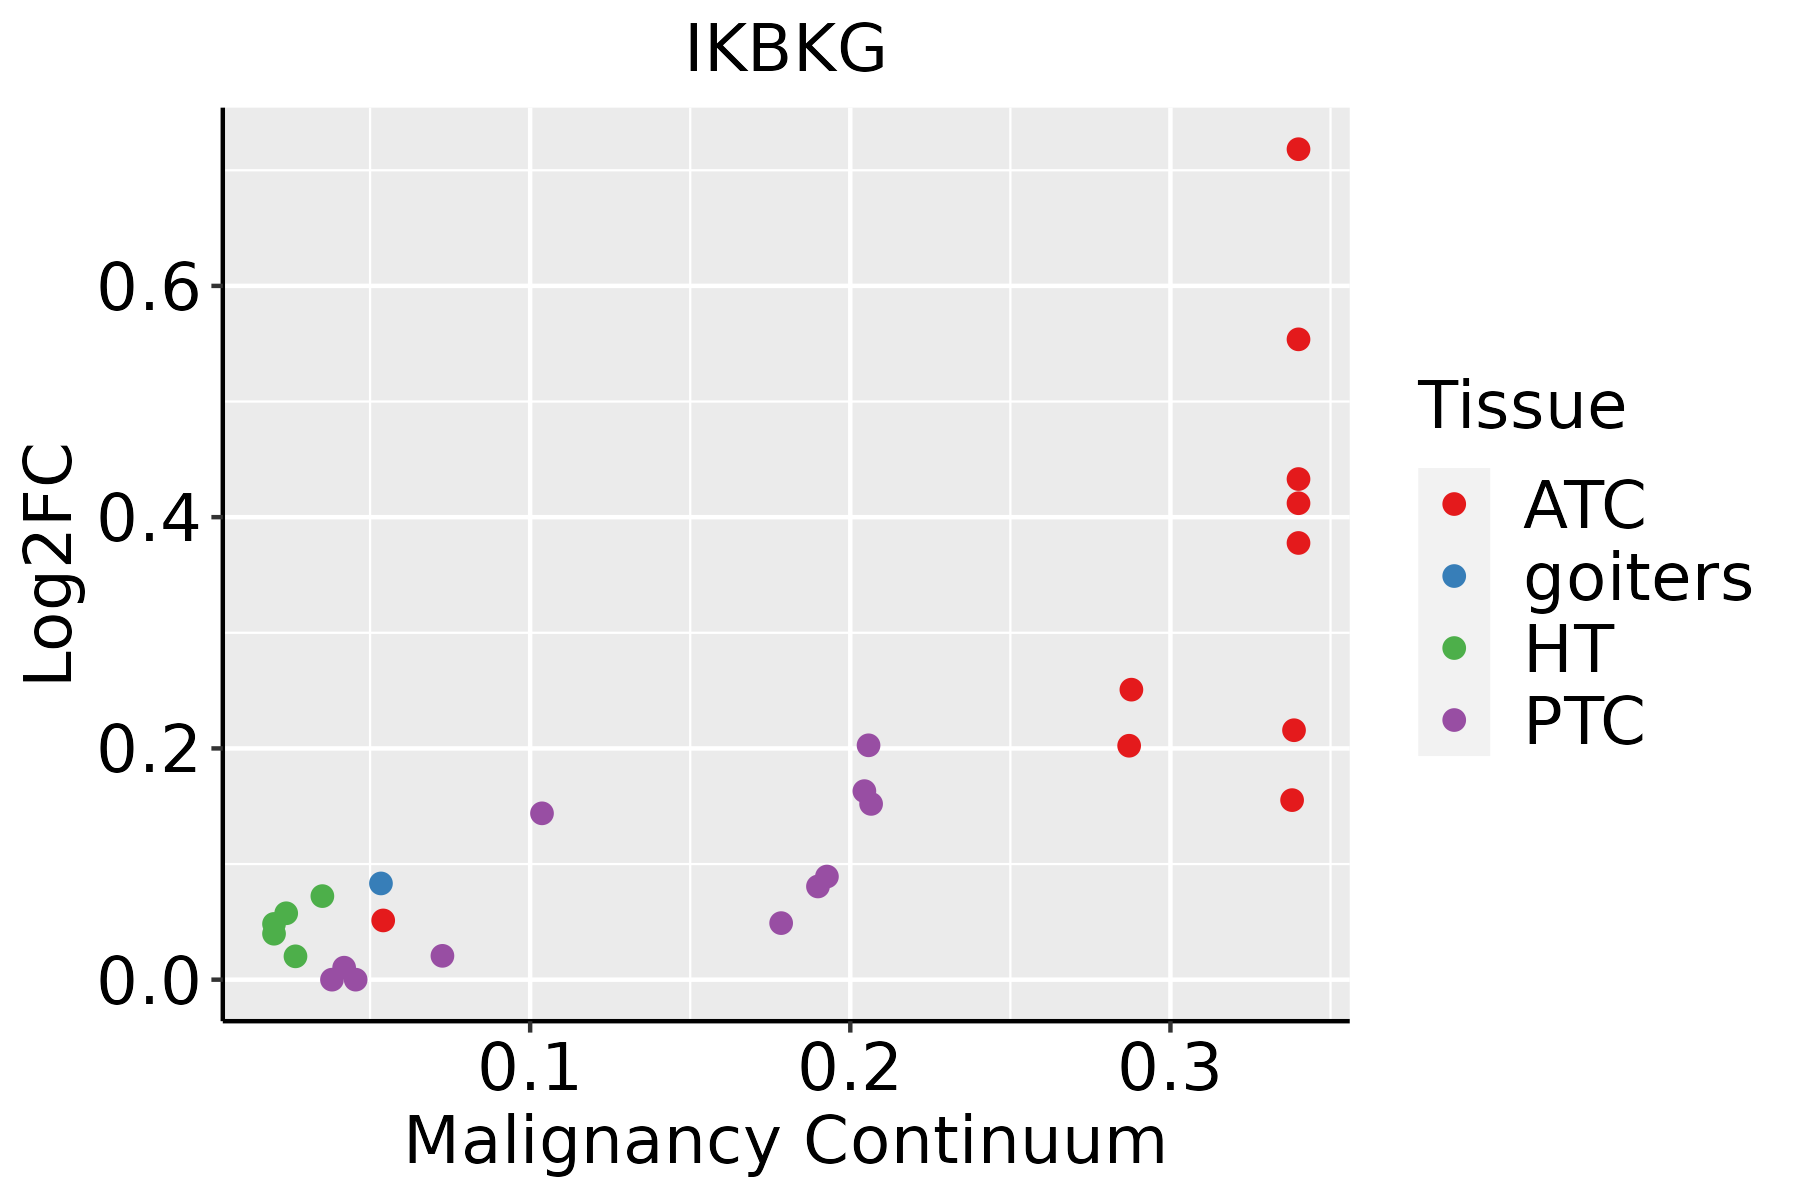 | ATC: Anaplastic thyroid cancer |
| HT: Hashimoto's thyroiditis | ||
| PTC: Papillary thyroid cancer |
| ∗log2FC in expression of this searched gene in stem-like cells from each diseased tissue sample relative to stem-like cells in normal samples in each tissue plotted against the malignancy continuum. Samples are colored based on if they are from different disease stage. |
Top |
Malignant transformation related pathway analysis |
| Find out the enriched GO biological processes and KEGG pathways involved in transition from healthy to precancer to cancer |
| Tissue | Disease Stage | Enriched GO biological Processes |
| Colorectum | AD |  |
| Colorectum | SER |  |
| Colorectum | MSS |  |
| Colorectum | MSI-H |  |
| Colorectum | FAP |  |
| ∗Top 15 enriched GO BP terms are showed in the bar plot of each disease state in each tissue. Each row represents a significant GO biological process which is colored according to the -log10(p.adjust). |
| Page: 1 2 3 4 5 6 7 8 9 |
| GO ID | Tissue | Disease Stage | Description | Gene Ratio | Bg Ratio | pvalue | p.adjust | Count |
| GO:000989626 | Esophagus | HGIN | positive regulation of catabolic process | 126/2587 | 492/18723 | 1.46e-12 | 2.09e-10 | 126 |
| GO:003133126 | Esophagus | HGIN | positive regulation of cellular catabolic process | 112/2587 | 427/18723 | 5.15e-12 | 6.72e-10 | 112 |
| GO:001050616 | Esophagus | HGIN | regulation of autophagy | 84/2587 | 317/18723 | 1.39e-09 | 1.08e-07 | 84 |
| GO:001623616 | Esophagus | HGIN | macroautophagy | 77/2587 | 291/18723 | 7.15e-09 | 4.61e-07 | 77 |
| GO:005165616 | Esophagus | HGIN | establishment of organelle localization | 90/2587 | 390/18723 | 4.27e-07 | 1.94e-05 | 90 |
| GO:004312220 | Esophagus | HGIN | regulation of I-kappaB kinase/NF-kappaB signaling | 63/2587 | 249/18723 | 8.91e-07 | 3.61e-05 | 63 |
| GO:000724918 | Esophagus | HGIN | I-kappaB kinase/NF-kappaB signaling | 67/2587 | 281/18723 | 3.84e-06 | 1.29e-04 | 67 |
| GO:004312317 | Esophagus | HGIN | positive regulation of I-kappaB kinase/NF-kappaB signaling | 49/2587 | 186/18723 | 4.22e-06 | 1.40e-04 | 49 |
| GO:007099727 | Esophagus | HGIN | neuron death | 81/2587 | 361/18723 | 5.01e-06 | 1.61e-04 | 81 |
| GO:00162418 | Esophagus | HGIN | regulation of macroautophagy | 38/2587 | 141/18723 | 2.80e-05 | 7.21e-04 | 38 |
| GO:190121424 | Esophagus | HGIN | regulation of neuron death | 68/2587 | 319/18723 | 1.46e-04 | 2.91e-03 | 68 |
| GO:005165010 | Esophagus | HGIN | establishment of vesicle localization | 35/2587 | 161/18723 | 3.89e-03 | 3.54e-02 | 35 |
| GO:190121510 | Esophagus | HGIN | negative regulation of neuron death | 43/2587 | 208/18723 | 4.04e-03 | 3.64e-02 | 43 |
| GO:000961517 | Esophagus | HGIN | response to virus | 69/2587 | 367/18723 | 4.39e-03 | 3.86e-02 | 69 |
| GO:00105088 | Esophagus | HGIN | positive regulation of autophagy | 28/2587 | 124/18723 | 5.34e-03 | 4.39e-02 | 28 |
| GO:005164810 | Esophagus | HGIN | vesicle localization | 37/2587 | 177/18723 | 6.03e-03 | 4.87e-02 | 37 |
| GO:001623617 | Esophagus | ESCC | macroautophagy | 216/8552 | 291/18723 | 1.94e-23 | 4.57e-21 | 216 |
| GO:0009896111 | Esophagus | ESCC | positive regulation of catabolic process | 332/8552 | 492/18723 | 4.36e-23 | 9.22e-21 | 332 |
| GO:005165617 | Esophagus | ESCC | establishment of organelle localization | 273/8552 | 390/18723 | 9.13e-23 | 1.81e-20 | 273 |
| GO:0031331111 | Esophagus | ESCC | positive regulation of cellular catabolic process | 292/8552 | 427/18723 | 8.67e-22 | 1.53e-19 | 292 |
| Page: 1 2 3 4 5 6 7 8 |
| Pathway ID | Tissue | Disease Stage | Description | Gene Ratio | Bg Ratio | pvalue | p.adjust | qvalue | Count |
| hsa0517139 | Esophagus | HGIN | Coronavirus disease - COVID-19 | 105/1383 | 232/8465 | 7.84e-26 | 5.11e-24 | 4.06e-24 | 105 |
| hsa0520839 | Esophagus | HGIN | Chemical carcinogenesis - reactive oxygen species | 92/1383 | 223/8465 | 2.41e-19 | 9.83e-18 | 7.80e-18 | 92 |
| hsa0501030 | Esophagus | HGIN | Alzheimer disease | 130/1383 | 384/8465 | 5.26e-18 | 1.71e-16 | 1.36e-16 | 130 |
| hsa0513139 | Esophagus | HGIN | Shigellosis | 71/1383 | 247/8465 | 4.89e-07 | 7.98e-06 | 6.34e-06 | 71 |
| hsa0513239 | Esophagus | HGIN | Salmonella infection | 69/1383 | 249/8465 | 3.02e-06 | 4.47e-05 | 3.55e-05 | 69 |
| hsa0541839 | Esophagus | HGIN | Fluid shear stress and atherosclerosis | 42/1383 | 139/8465 | 2.92e-05 | 3.81e-04 | 3.02e-04 | 42 |
| hsa0513039 | Esophagus | HGIN | Pathogenic Escherichia coli infection | 54/1383 | 197/8465 | 4.91e-05 | 6.15e-04 | 4.89e-04 | 54 |
| hsa0516930 | Esophagus | HGIN | Epstein-Barr virus infection | 55/1383 | 202/8465 | 5.13e-05 | 6.19e-04 | 4.92e-04 | 55 |
| hsa0516730 | Esophagus | HGIN | Kaposi sarcoma-associated herpesvirus infection | 51/1383 | 194/8465 | 2.46e-04 | 2.69e-03 | 2.14e-03 | 51 |
| hsa052039 | Esophagus | HGIN | Viral carcinogenesis | 53/1383 | 204/8465 | 2.58e-04 | 2.71e-03 | 2.15e-03 | 53 |
| hsa0421020 | Esophagus | HGIN | Apoptosis | 36/1383 | 136/8465 | 1.67e-03 | 1.52e-02 | 1.20e-02 | 36 |
| hsa0517029 | Esophagus | HGIN | Human immunodeficiency virus 1 infection | 51/1383 | 212/8465 | 2.16e-03 | 1.90e-02 | 1.51e-02 | 51 |
| hsa0541739 | Esophagus | HGIN | Lipid and atherosclerosis | 51/1383 | 215/8465 | 2.95e-03 | 2.41e-02 | 1.91e-02 | 51 |
| hsa046219 | Esophagus | HGIN | NOD-like receptor signaling pathway | 45/1383 | 186/8465 | 3.40e-03 | 2.54e-02 | 2.02e-02 | 45 |
| hsa0516420 | Esophagus | HGIN | Influenza A | 42/1383 | 171/8465 | 3.41e-03 | 2.54e-02 | 2.02e-02 | 42 |
| hsa0516639 | Esophagus | HGIN | Human T-cell leukemia virus 1 infection | 51/1383 | 222/8465 | 5.84e-03 | 4.05e-02 | 3.22e-02 | 51 |
| hsa0465726 | Esophagus | HGIN | IL-17 signaling pathway | 25/1383 | 94/8465 | 7.52e-03 | 4.63e-02 | 3.68e-02 | 25 |
| hsa0516330 | Esophagus | HGIN | Human cytomegalovirus infection | 51/1383 | 225/8465 | 7.67e-03 | 4.63e-02 | 3.68e-02 | 51 |
| hsa05171115 | Esophagus | HGIN | Coronavirus disease - COVID-19 | 105/1383 | 232/8465 | 7.84e-26 | 5.11e-24 | 4.06e-24 | 105 |
| hsa05208115 | Esophagus | HGIN | Chemical carcinogenesis - reactive oxygen species | 92/1383 | 223/8465 | 2.41e-19 | 9.83e-18 | 7.80e-18 | 92 |
| Page: 1 2 3 4 5 6 7 8 9 10 11 12 13 14 15 16 17 |
Top |
Cell-cell communication analysis |
| Identification of potential cell-cell interactions between two cell types and their ligand-receptor pairs for different disease states |
| Ligand | Receptor | LRpair | Pathway | Tissue | Disease Stage |
| Page: 1 |
Top |
Single-cell gene regulatory network inference analysis |
| Find out the significant the regulons (TFs) and the target genes of each regulon across cell types for different disease states |
| TF | Cell Type | Tissue | Disease Stage | Target Gene | RSS | Regulon Activity |
| ∗The dot plots of a searched regulon are shown for all cell subpopulations in each disease state of each tissue based on the regulon specific score inferred using pySCENIC and by calculating the average expression. |
| Page: 1 |
Top |
Somatic mutation of malignant transformation related genes |
| Annotation of somatic variants for genes involved in malignant transformation |
| Hugo Symbol | Variant Class | Variant Classification | dbSNP RS | HGVSc | HGVSp | HGVSp Short | SWISSPROT | BIOTYPE | SIFT | PolyPhen | Tumor Sample Barcode | Tissue | Histology | Sex | Age | Stage | Therapy Types | Drugs | Outcome |
| IKBKG | SNV | Missense_Mutation | novel | c.671N>T | p.Ser224Ile | p.S224I | Q9Y6K9 | protein_coding | deleterious(0.01) | possibly_damaging(0.868) | TCGA-AA-3947-01 | Colorectum | colon adenocarcinoma | Female | <65 | I/II | Unknown | Unknown | SD |
| IKBKG | SNV | Missense_Mutation | novel | c.1042N>A | p.Val348Met | p.V348M | Q9Y6K9 | protein_coding | tolerated(0.17) | benign(0.242) | TCGA-AG-3731-01 | Colorectum | rectum adenocarcinoma | Male | >=65 | III/IV | Chemotherapy | folinic | PR |
| IKBKG | SNV | Missense_Mutation | novel | c.710N>A | p.Ala237Asp | p.A237D | Q9Y6K9 | protein_coding | tolerated(0.32) | benign(0.112) | TCGA-DY-A1DG-01 | Colorectum | rectum adenocarcinoma | Male | >=65 | I/II | Unknown | Unknown | PD |
| IKBKG | SNV | Missense_Mutation | novel | c.272A>C | p.Asp91Ala | p.D91A | Q9Y6K9 | protein_coding | deleterious(0.01) | possibly_damaging(0.465) | TCGA-A5-A1OF-01 | Endometrium | uterine corpus endometrioid carcinoma | Female | <65 | I/II | Unknown | Unknown | SD |
| IKBKG | SNV | Missense_Mutation | c.658G>A | p.Glu220Lys | p.E220K | Q9Y6K9 | protein_coding | deleterious(0) | possibly_damaging(0.695) | TCGA-A5-A1OF-01 | Endometrium | uterine corpus endometrioid carcinoma | Female | <65 | I/II | Unknown | Unknown | SD | |
| IKBKG | SNV | Missense_Mutation | novel | c.491N>C | p.Lys164Thr | p.K164T | Q9Y6K9 | protein_coding | deleterious(0) | possibly_damaging(0.901) | TCGA-A5-A2K5-01 | Endometrium | uterine corpus endometrioid carcinoma | Female | >=65 | I/II | Unknown | Unknown | SD |
| IKBKG | SNV | Missense_Mutation | novel | c.1048N>A | p.Asp350Asn | p.D350N | Q9Y6K9 | protein_coding | deleterious(0) | probably_damaging(0.987) | TCGA-A5-A2K5-01 | Endometrium | uterine corpus endometrioid carcinoma | Female | >=65 | I/II | Unknown | Unknown | SD |
| IKBKG | SNV | Missense_Mutation | novel | c.639N>T | p.Gln213His | p.Q213H | Q9Y6K9 | protein_coding | deleterious(0.01) | probably_damaging(0.934) | TCGA-AJ-A3EL-01 | Endometrium | uterine corpus endometrioid carcinoma | Female | <65 | I/II | Unknown | Unknown | SD |
| IKBKG | SNV | Missense_Mutation | rs782201526 | c.149N>A | p.Arg50His | p.R50H | Q9Y6K9 | protein_coding | deleterious_low_confidence(0.03) | benign(0.003) | TCGA-AP-A056-01 | Endometrium | uterine corpus endometrioid carcinoma | Female | <65 | I/II | Unknown | Unknown | SD |
| IKBKG | SNV | Missense_Mutation | novel | c.1089G>A | p.Met363Ile | p.M363I | Q9Y6K9 | protein_coding | deleterious(0.03) | benign(0.006) | TCGA-AP-A1DK-01 | Endometrium | uterine corpus endometrioid carcinoma | Female | <65 | I/II | Unknown | Unknown | SD |
| Page: 1 2 3 |
Top |
Related drugs of malignant transformation related genes |
| Identification of chemicals and drugs interact with genes involved in malignant transfromation |
| (DGIdb 4.0) |
| Entrez ID | Symbol | Category | Interaction Types | Drug Claim Name | Drug Name | PMIDs |
| 8517 | IKBKG | KINASE, DRUGGABLE GENOME | artesunate | ARTESUNATE | ||
| 8517 | IKBKG | KINASE, DRUGGABLE GENOME | primaquine | PRIMAQUINE | ||
| 8517 | IKBKG | KINASE, DRUGGABLE GENOME | sulfadoxine | SULFADOXINE | ||
| 8517 | IKBKG | KINASE, DRUGGABLE GENOME | pyrimethamine | PYRIMETHAMINE |
| Page: 1 |

Copyright 2023-Present -The University of Texas Health Science Center at Houston |