
|
|||||
|
 | |
| |
| |
| |
| |
| |
|
Gene: IGSF9 |
Gene summary for IGSF9 |
| Gene information | Species | Human | Gene symbol | IGSF9 | Gene ID | 57549 |
| Gene name | immunoglobulin superfamily member 9 | |
| Gene Alias | FP18798 | |
| Cytomap | 1q23.2 | |
| Gene Type | protein-coding | GO ID | GO:0000902 | UniProtAcc | Q9P2J2 |
Top |
Malignant transformation analysis |
| Identification of the aberrant gene expression in precancerous and cancerous lesions by comparing the gene expression of stem-like cells in diseased tissues with normal stem cells |
| Entrez ID | Symbol | Replicates | Species | Organ | Tissue | Adj P-value | Log2FC | Malignancy |
| 57549 | IGSF9 | HTA11_2487_2000001011 | Human | Colorectum | SER | 5.50e-11 | 4.38e-01 | -0.1808 |
| 57549 | IGSF9 | HTA11_78_2000001011 | Human | Colorectum | AD | 9.55e-03 | 1.81e-01 | -0.1088 |
| 57549 | IGSF9 | HTA11_347_2000001011 | Human | Colorectum | AD | 1.24e-14 | 3.84e-01 | -0.1954 |
| 57549 | IGSF9 | HTA11_411_2000001011 | Human | Colorectum | SER | 9.25e-05 | 5.38e-01 | -0.2602 |
| 57549 | IGSF9 | HTA11_2112_2000001011 | Human | Colorectum | SER | 7.90e-06 | 5.79e-01 | -0.2196 |
| 57549 | IGSF9 | HTA11_83_2000001011 | Human | Colorectum | SER | 4.87e-06 | 3.99e-01 | -0.1526 |
| 57549 | IGSF9 | HTA11_696_2000001011 | Human | Colorectum | AD | 1.07e-17 | 4.23e-01 | -0.1464 |
| 57549 | IGSF9 | HTA11_1391_2000001011 | Human | Colorectum | AD | 3.65e-02 | 1.76e-01 | -0.059 |
| 57549 | IGSF9 | HTA11_5212_2000001011 | Human | Colorectum | AD | 3.20e-07 | 4.83e-01 | -0.2061 |
| 57549 | IGSF9 | HTA11_99999970781_79442 | Human | Colorectum | MSS | 4.90e-05 | 1.76e-01 | 0.294 |
| 57549 | IGSF9 | HTA11_99999971662_82457 | Human | Colorectum | MSS | 1.52e-03 | 1.97e-01 | 0.3859 |
| 57549 | IGSF9 | HTA11_99999974143_84620 | Human | Colorectum | MSS | 1.64e-09 | 2.65e-01 | 0.3005 |
| 57549 | IGSF9 | LZE24T | Human | Esophagus | ESCC | 1.20e-05 | 1.57e-01 | 0.0596 |
| 57549 | IGSF9 | P1T-E | Human | Esophagus | ESCC | 1.20e-07 | 2.65e-01 | 0.0875 |
| 57549 | IGSF9 | P2T-E | Human | Esophagus | ESCC | 1.15e-59 | 1.06e+00 | 0.1177 |
| 57549 | IGSF9 | P4T-E | Human | Esophagus | ESCC | 2.88e-20 | 4.54e-01 | 0.1323 |
| 57549 | IGSF9 | P5T-E | Human | Esophagus | ESCC | 3.60e-11 | 1.45e-01 | 0.1327 |
| 57549 | IGSF9 | P8T-E | Human | Esophagus | ESCC | 6.30e-05 | 3.45e-02 | 0.0889 |
| 57549 | IGSF9 | P9T-E | Human | Esophagus | ESCC | 1.04e-13 | 2.96e-01 | 0.1131 |
| 57549 | IGSF9 | P10T-E | Human | Esophagus | ESCC | 1.88e-15 | 3.20e-01 | 0.116 |
| Page: 1 2 3 4 |
| Tissue | Expression Dynamics | Abbreviation |
| Colorectum (GSE201348) |  | FAP: Familial adenomatous polyposis |
| CRC: Colorectal cancer | ||
| Colorectum (HTA11) |  | AD: Adenomas |
| SER: Sessile serrated lesions | ||
| MSI-H: Microsatellite-high colorectal cancer | ||
| MSS: Microsatellite stable colorectal cancer | ||
| Esophagus | 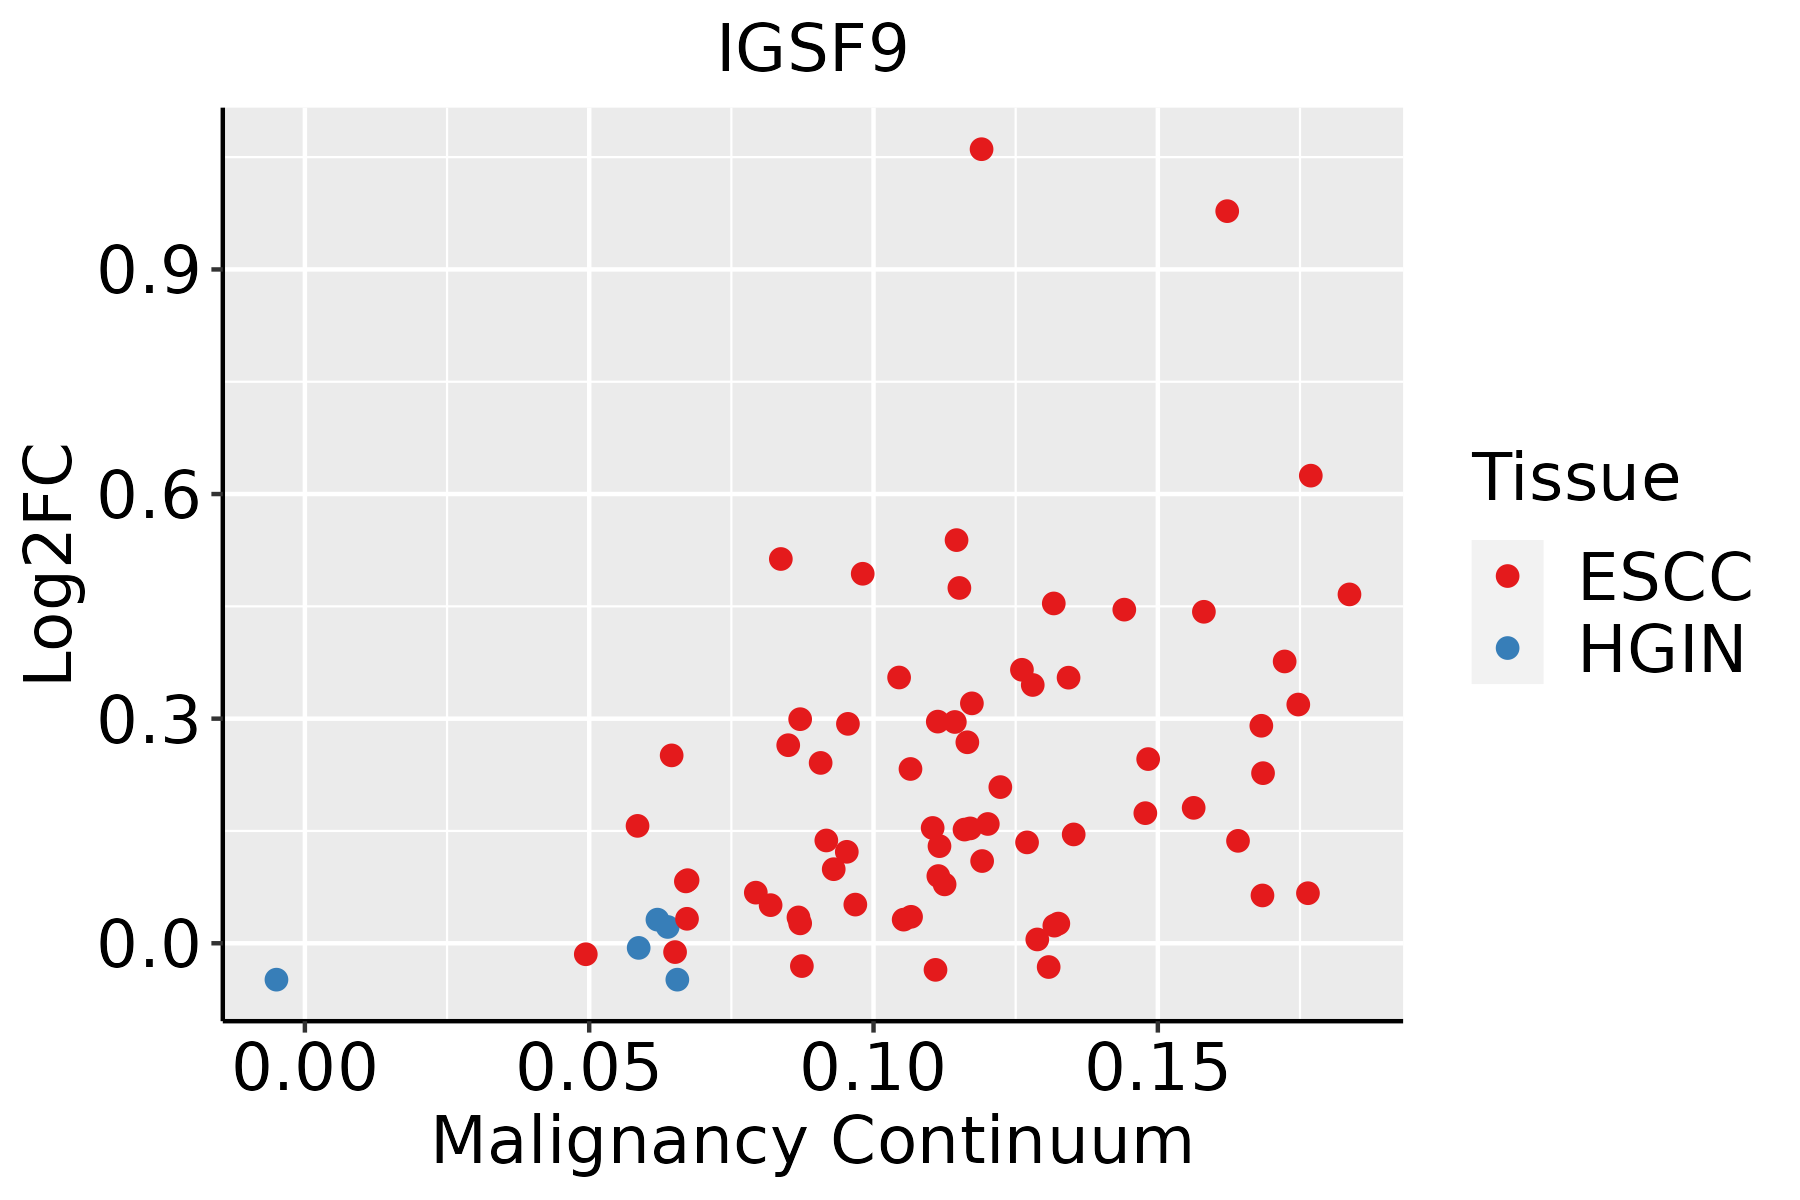 | ESCC: Esophageal squamous cell carcinoma |
| HGIN: High-grade intraepithelial neoplasias | ||
| LGIN: Low-grade intraepithelial neoplasias | ||
| Oral Cavity | 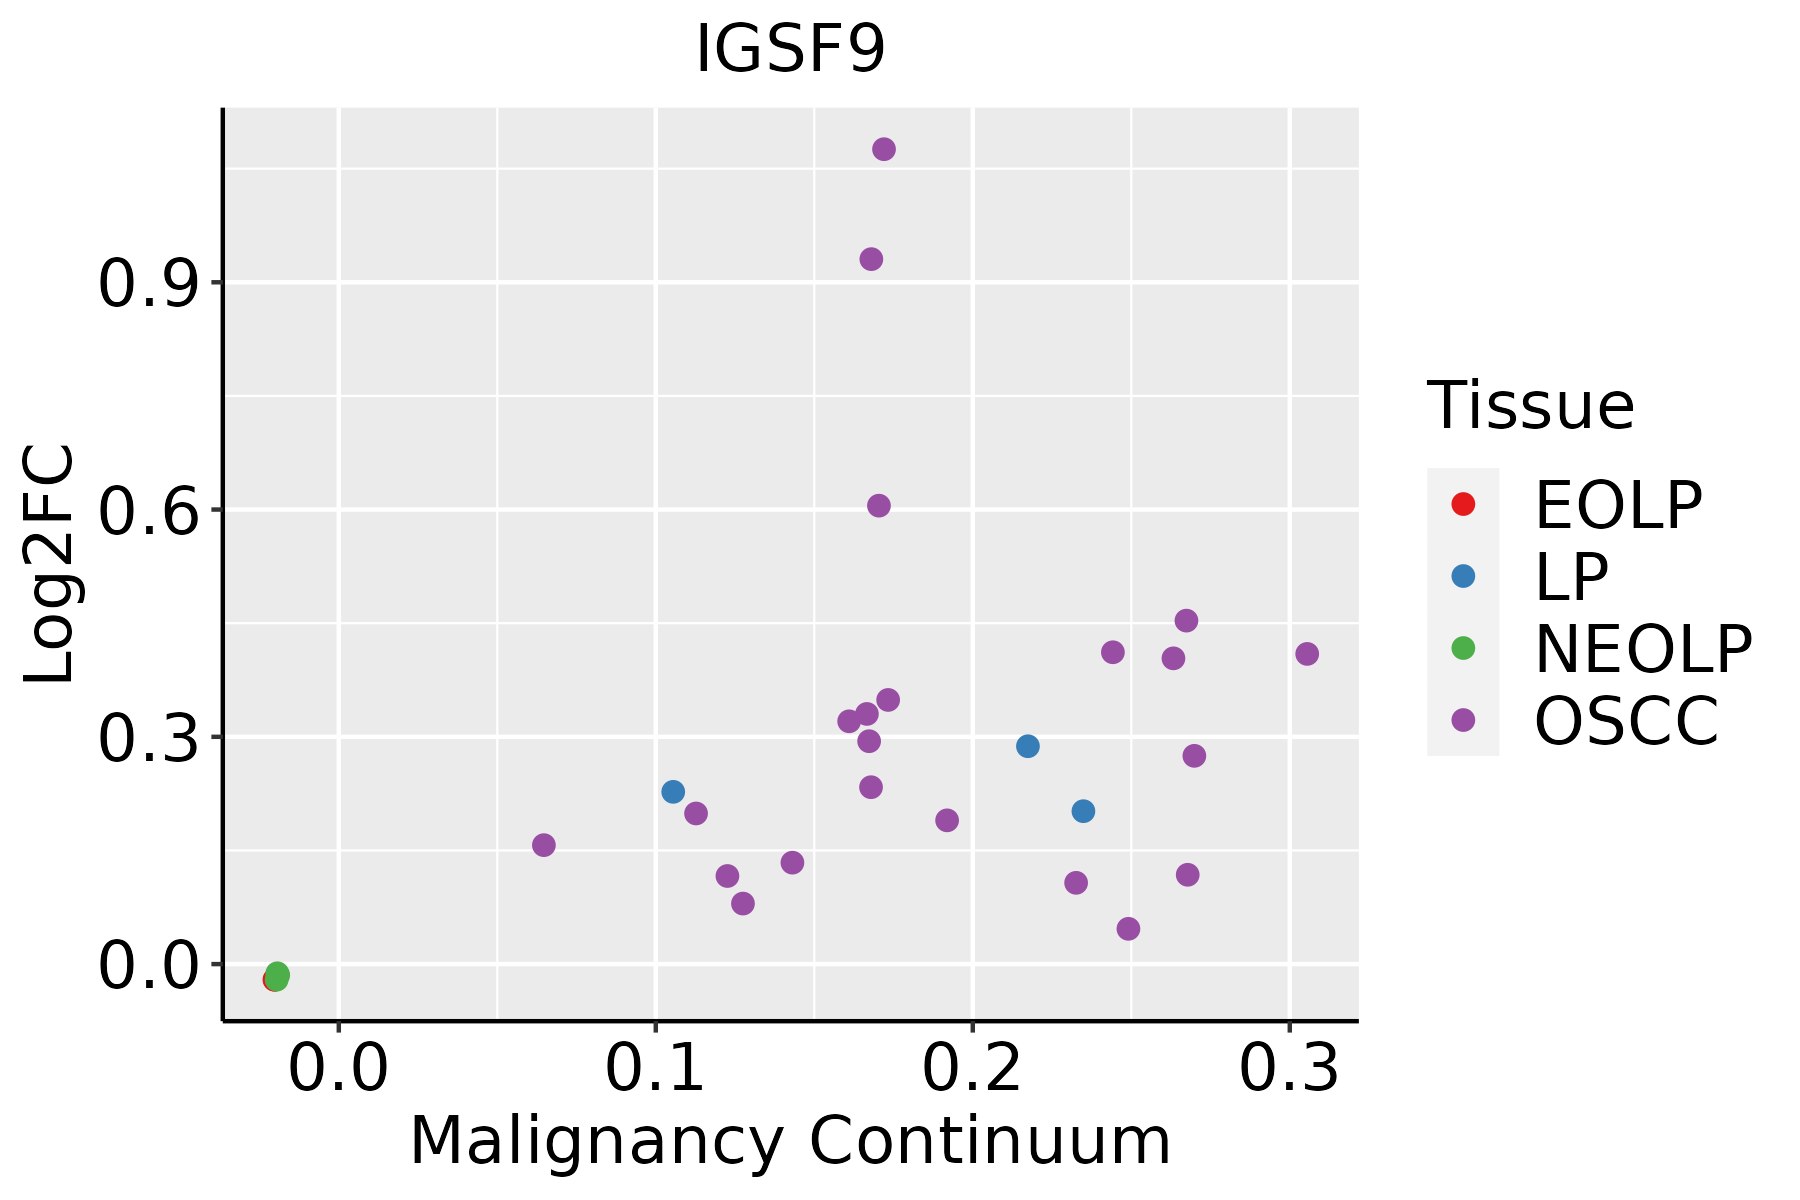 | EOLP: Erosive Oral lichen planus |
| LP: leukoplakia | ||
| NEOLP: Non-erosive oral lichen planus | ||
| OSCC: Oral squamous cell carcinoma |
| ∗log2FC in expression of this searched gene in stem-like cells from each diseased tissue sample relative to stem-like cells in normal samples in each tissue plotted against the malignancy continuum. Samples are colored based on if they are from different disease stage. |
Top |
Malignant transformation related pathway analysis |
| Find out the enriched GO biological processes and KEGG pathways involved in transition from healthy to precancer to cancer |
| Tissue | Disease Stage | Enriched GO biological Processes |
| Colorectum | AD |  |
| Colorectum | SER |  |
| Colorectum | MSS |  |
| Colorectum | MSI-H |  |
| Colorectum | FAP |  |
| ∗Top 15 enriched GO BP terms are showed in the bar plot of each disease state in each tissue. Each row represents a significant GO biological process which is colored according to the -log10(p.adjust). |
| Page: 1 2 3 4 5 6 7 8 9 |
| GO ID | Tissue | Disease Stage | Description | Gene Ratio | Bg Ratio | pvalue | p.adjust | Count |
| GO:0007409 | Colorectum | AD | axonogenesis | 122/3918 | 418/18723 | 3.36e-05 | 6.15e-04 | 122 |
| GO:0061564 | Colorectum | AD | axon development | 132/3918 | 467/18723 | 8.40e-05 | 1.31e-03 | 132 |
| GO:0016358 | Colorectum | AD | dendrite development | 69/3918 | 243/18723 | 3.32e-03 | 2.42e-02 | 69 |
| GO:0050808 | Colorectum | AD | synapse organization | 112/3918 | 426/18723 | 4.25e-03 | 2.92e-02 | 112 |
| GO:0007411 | Colorectum | AD | axon guidance | 64/3918 | 227/18723 | 5.41e-03 | 3.55e-02 | 64 |
| GO:0050807 | Colorectum | AD | regulation of synapse organization | 60/3918 | 211/18723 | 5.67e-03 | 3.64e-02 | 60 |
| GO:0097485 | Colorectum | AD | neuron projection guidance | 64/3918 | 228/18723 | 6.02e-03 | 3.78e-02 | 64 |
| GO:00163581 | Colorectum | SER | dendrite development | 58/2897 | 243/18723 | 3.82e-04 | 5.81e-03 | 58 |
| GO:00074111 | Colorectum | SER | axon guidance | 51/2897 | 227/18723 | 3.29e-03 | 2.82e-02 | 51 |
| GO:00974851 | Colorectum | SER | neuron projection guidance | 51/2897 | 228/18723 | 3.61e-03 | 3.03e-02 | 51 |
| GO:00615641 | Colorectum | SER | axon development | 94/2897 | 467/18723 | 3.78e-03 | 3.13e-02 | 94 |
| GO:00074091 | Colorectum | SER | axonogenesis | 84/2897 | 418/18723 | 6.20e-03 | 4.49e-02 | 84 |
| GO:00508081 | Colorectum | SER | synapse organization | 85/2897 | 426/18723 | 7.17e-03 | 4.99e-02 | 85 |
| GO:00074092 | Colorectum | MSS | axonogenesis | 105/3467 | 418/18723 | 4.32e-04 | 5.23e-03 | 105 |
| GO:00615642 | Colorectum | MSS | axon development | 115/3467 | 467/18723 | 5.33e-04 | 6.00e-03 | 115 |
| GO:00163582 | Colorectum | MSS | dendrite development | 65/3467 | 243/18723 | 9.41e-04 | 9.50e-03 | 65 |
| GO:00508082 | Colorectum | MSS | synapse organization | 101/3467 | 426/18723 | 3.96e-03 | 2.89e-02 | 101 |
| GO:006156415 | Esophagus | ESCC | axon development | 251/8552 | 467/18723 | 2.41e-04 | 1.49e-03 | 251 |
| GO:000740915 | Esophagus | ESCC | axonogenesis | 219/8552 | 418/18723 | 3.14e-03 | 1.31e-02 | 219 |
| GO:001635816 | Esophagus | ESCC | dendrite development | 130/8552 | 243/18723 | 8.33e-03 | 2.95e-02 | 130 |
| Page: 1 2 |
| Pathway ID | Tissue | Disease Stage | Description | Gene Ratio | Bg Ratio | pvalue | p.adjust | qvalue | Count |
| Page: 1 |
Top |
Cell-cell communication analysis |
| Identification of potential cell-cell interactions between two cell types and their ligand-receptor pairs for different disease states |
| Ligand | Receptor | LRpair | Pathway | Tissue | Disease Stage |
| Page: 1 |
Top |
Single-cell gene regulatory network inference analysis |
| Find out the significant the regulons (TFs) and the target genes of each regulon across cell types for different disease states |
| TF | Cell Type | Tissue | Disease Stage | Target Gene | RSS | Regulon Activity |
| ∗The dot plots of a searched regulon are shown for all cell subpopulations in each disease state of each tissue based on the regulon specific score inferred using pySCENIC and by calculating the average expression. |
| Page: 1 |
Top |
Somatic mutation of malignant transformation related genes |
| Annotation of somatic variants for genes involved in malignant transformation |
| Hugo Symbol | Variant Class | Variant Classification | dbSNP RS | HGVSc | HGVSp | HGVSp Short | SWISSPROT | BIOTYPE | SIFT | PolyPhen | Tumor Sample Barcode | Tissue | Histology | Sex | Age | Stage | Therapy Types | Drugs | Outcome |
| IGSF9 | SNV | Missense_Mutation | novel | c.1301N>C | p.Arg434Pro | p.R434P | Q9P2J2 | protein_coding | deleterious(0) | probably_damaging(0.997) | TCGA-A2-A3Y0-01 | Breast | breast invasive carcinoma | Female | <65 | I/II | Chemotherapy | adriamycin | CR |
| IGSF9 | SNV | Missense_Mutation | novel | c.2893N>G | p.Ser965Ala | p.S965A | Q9P2J2 | protein_coding | tolerated(0.37) | benign(0.097) | TCGA-A8-A085-01 | Breast | breast invasive carcinoma | Male | <65 | I/II | Hormone Therapy | tamoxiphen | SD |
| IGSF9 | SNV | Missense_Mutation | novel | c.866N>C | p.Leu289Pro | p.L289P | Q9P2J2 | protein_coding | tolerated(0.35) | benign(0.003) | TCGA-A8-A09Q-01 | Breast | breast invasive carcinoma | Female | >=65 | III/IV | Hormone Therapy | anastrozole | SD |
| IGSF9 | SNV | Missense_Mutation | c.1953G>T | p.Lys651Asn | p.K651N | Q9P2J2 | protein_coding | tolerated(0.61) | benign(0.079) | TCGA-AC-A23H-01 | Breast | breast invasive carcinoma | Female | >=65 | I/II | Unknown | Unknown | PD | |
| IGSF9 | SNV | Missense_Mutation | novel | c.2802G>T | p.Glu934Asp | p.E934D | Q9P2J2 | protein_coding | deleterious(0.01) | probably_damaging(0.97) | TCGA-AN-A046-01 | Breast | breast invasive carcinoma | Female | >=65 | I/II | Unknown | Unknown | SD |
| IGSF9 | SNV | Missense_Mutation | novel | c.489N>G | p.Ser163Arg | p.S163R | Q9P2J2 | protein_coding | deleterious(0) | benign(0.405) | TCGA-AN-A0G0-01 | Breast | breast invasive carcinoma | Female | <65 | I/II | Unknown | Unknown | SD |
| IGSF9 | SNV | Missense_Mutation | novel | c.912N>A | p.Ser304Arg | p.S304R | Q9P2J2 | protein_coding | deleterious(0) | probably_damaging(0.986) | TCGA-C8-A275-01 | Breast | breast invasive carcinoma | Female | <65 | I/II | Unknown | Unknown | SD |
| IGSF9 | insertion | In_Frame_Ins | novel | c.306_307insTGCTGTGTTGGAAGTGCA | p.Asp102_Gln103insCysCysValGlySerAla | p.D102_Q103insCCVGSA | Q9P2J2 | protein_coding | TCGA-A8-A079-01 | Breast | breast invasive carcinoma | Female | >=65 | III/IV | Chemotherapy | 5-fluorouracil | SD | ||
| IGSF9 | insertion | Frame_Shift_Ins | novel | c.2892_2893insC | p.Ser965LeufsTer37 | p.S965Lfs*37 | Q9P2J2 | protein_coding | TCGA-AR-A0TY-01 | Breast | breast invasive carcinoma | Female | <65 | I/II | Unspecific | Paclitaxel | PD | ||
| IGSF9 | insertion | Frame_Shift_Ins | novel | c.2891_2892insCAGTCATCTCTATGACGGTCCCCTG | p.Phe966HisfsTer44 | p.F966Hfs*44 | Q9P2J2 | protein_coding | TCGA-AR-A0TY-01 | Breast | breast invasive carcinoma | Female | <65 | I/II | Unspecific | Paclitaxel | PD |
| Page: 1 2 3 4 5 6 7 8 9 10 11 12 13 14 |
Top |
Related drugs of malignant transformation related genes |
| Identification of chemicals and drugs interact with genes involved in malignant transfromation |
| (DGIdb 4.0) |
| Entrez ID | Symbol | Category | Interaction Types | Drug Claim Name | Drug Name | PMIDs |
| Page: 1 |

Copyright 2023-Present -The University of Texas Health Science Center at Houston |