
|
|||||
|
 | |
| |
| |
| |
| |
| |
|
Gene: IGSF8 |
Gene summary for IGSF8 |
| Gene information | Species | Human | Gene symbol | IGSF8 | Gene ID | 93185 |
| Gene name | immunoglobulin superfamily member 8 | |
| Gene Alias | CD316 | |
| Cytomap | 1q23.2 | |
| Gene Type | protein-coding | GO ID | GO:0000003 | UniProtAcc | Q969P0 |
Top |
Malignant transformation analysis |
| Identification of the aberrant gene expression in precancerous and cancerous lesions by comparing the gene expression of stem-like cells in diseased tissues with normal stem cells |
| Entrez ID | Symbol | Replicates | Species | Organ | Tissue | Adj P-value | Log2FC | Malignancy |
| 93185 | IGSF8 | HTA11_3410_2000001011 | Human | Colorectum | AD | 5.91e-06 | 2.30e-01 | 0.0155 |
| 93185 | IGSF8 | HTA11_2487_2000001011 | Human | Colorectum | SER | 4.47e-07 | 4.26e-01 | -0.1808 |
| 93185 | IGSF8 | HTA11_1938_2000001011 | Human | Colorectum | AD | 3.33e-06 | 3.93e-01 | -0.0811 |
| 93185 | IGSF8 | HTA11_78_2000001011 | Human | Colorectum | AD | 3.22e-08 | 3.65e-01 | -0.1088 |
| 93185 | IGSF8 | HTA11_347_2000001011 | Human | Colorectum | AD | 7.19e-17 | 4.28e-01 | -0.1954 |
| 93185 | IGSF8 | HTA11_3361_2000001011 | Human | Colorectum | AD | 1.69e-04 | 3.21e-01 | -0.1207 |
| 93185 | IGSF8 | HTA11_83_2000001011 | Human | Colorectum | SER | 9.22e-04 | 3.84e-01 | -0.1526 |
| 93185 | IGSF8 | HTA11_696_2000001011 | Human | Colorectum | AD | 1.98e-15 | 3.96e-01 | -0.1464 |
| 93185 | IGSF8 | HTA11_866_2000001011 | Human | Colorectum | AD | 1.32e-05 | 2.35e-01 | -0.1001 |
| 93185 | IGSF8 | HTA11_1391_2000001011 | Human | Colorectum | AD | 1.12e-06 | 3.51e-01 | -0.059 |
| 93185 | IGSF8 | HTA11_866_3004761011 | Human | Colorectum | AD | 2.21e-03 | 1.97e-01 | 0.096 |
| 93185 | IGSF8 | HTA11_7663_2000001011 | Human | Colorectum | SER | 1.32e-04 | 3.25e-01 | 0.0131 |
| 93185 | IGSF8 | HTA11_10711_2000001011 | Human | Colorectum | AD | 2.94e-07 | 3.70e-01 | 0.0338 |
| 93185 | IGSF8 | HTA11_7696_3000711011 | Human | Colorectum | AD | 1.81e-09 | 3.09e-01 | 0.0674 |
| 93185 | IGSF8 | HTA11_99999970781_79442 | Human | Colorectum | MSS | 8.47e-10 | 3.35e-01 | 0.294 |
| 93185 | IGSF8 | HTA11_99999971662_82457 | Human | Colorectum | MSS | 8.26e-24 | 6.09e-01 | 0.3859 |
| 93185 | IGSF8 | HTA11_99999974143_84620 | Human | Colorectum | MSS | 2.15e-06 | 2.45e-01 | 0.3005 |
| 93185 | IGSF8 | LZE4T | Human | Esophagus | ESCC | 2.53e-10 | 1.92e-01 | 0.0811 |
| 93185 | IGSF8 | LZE7T | Human | Esophagus | ESCC | 1.02e-04 | 5.30e-01 | 0.0667 |
| 93185 | IGSF8 | LZE8T | Human | Esophagus | ESCC | 2.70e-02 | 5.10e-02 | 0.067 |
| Page: 1 2 3 4 5 6 7 |
| Tissue | Expression Dynamics | Abbreviation |
| Colorectum (GSE201348) |  | FAP: Familial adenomatous polyposis |
| CRC: Colorectal cancer | ||
| Colorectum (HTA11) | 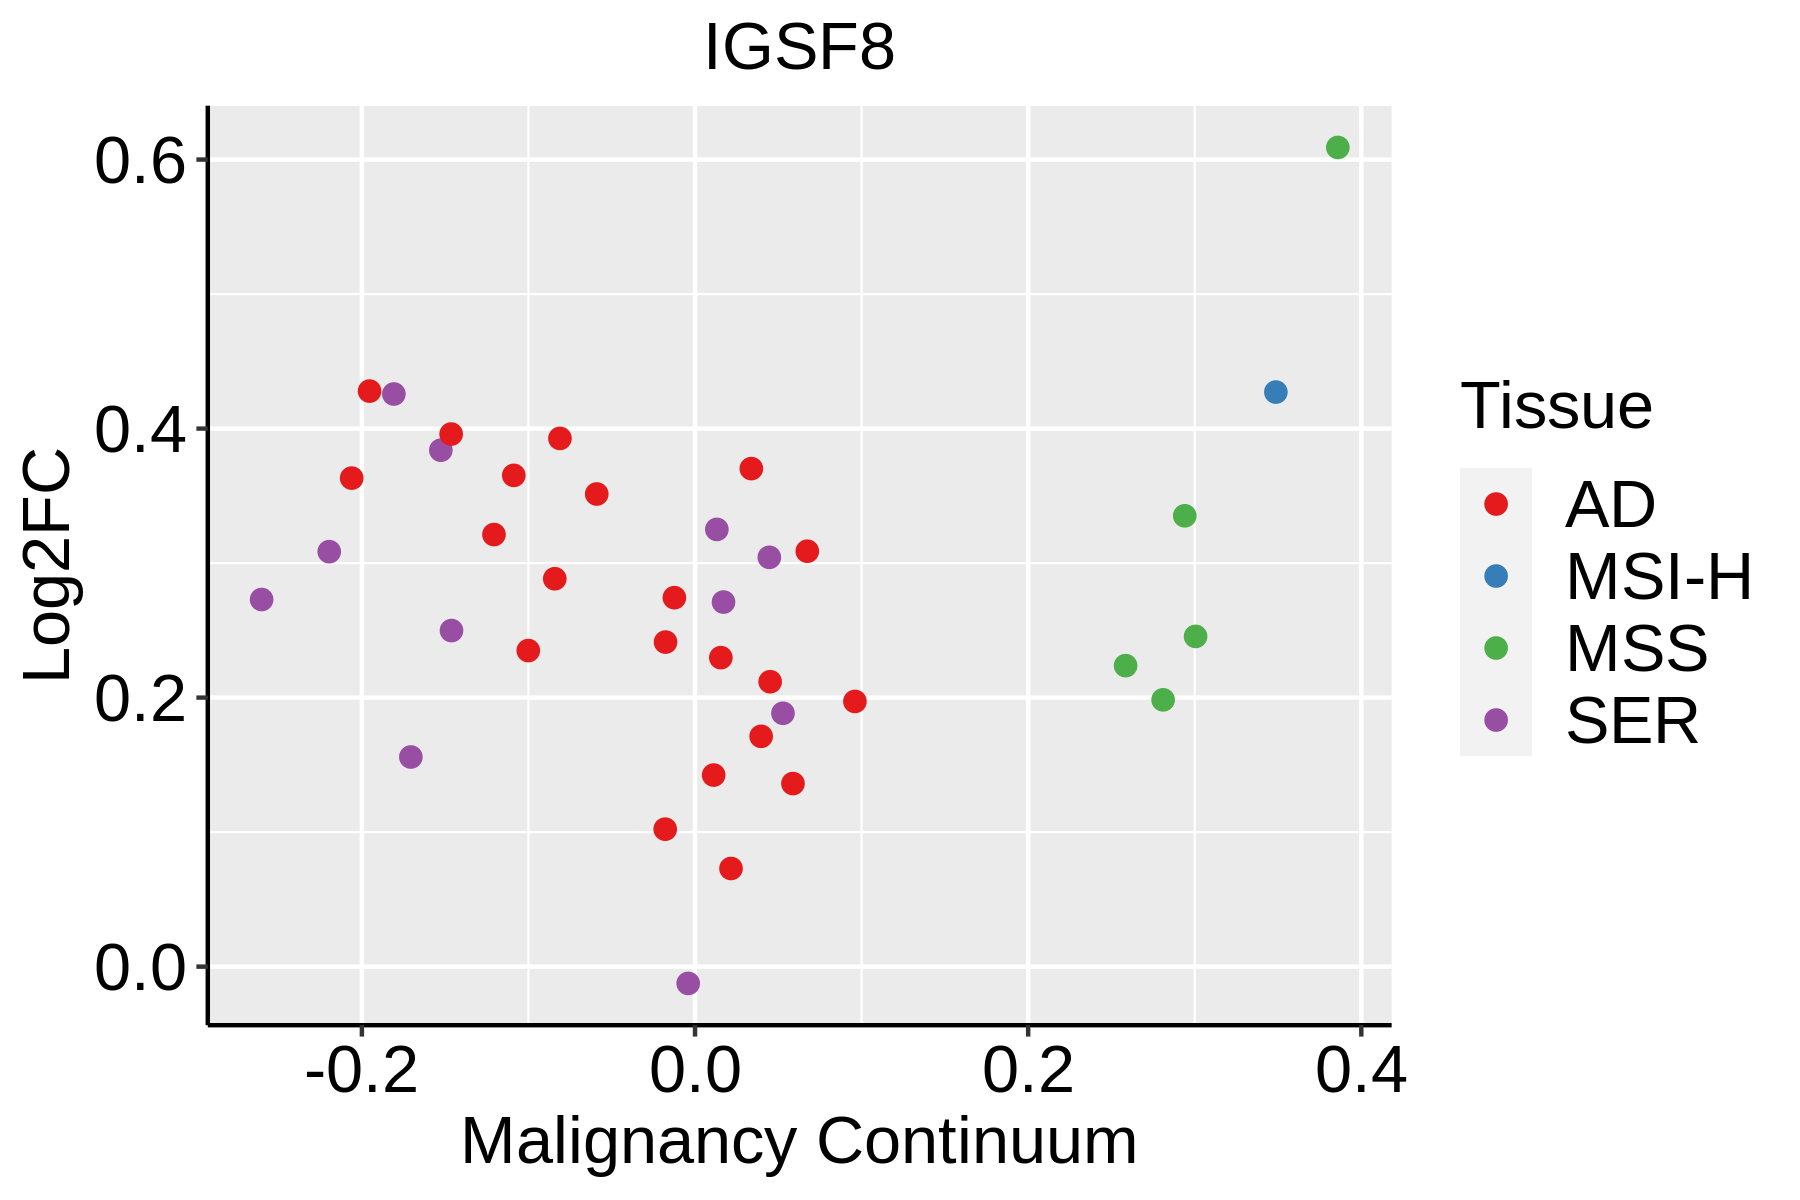 | AD: Adenomas |
| SER: Sessile serrated lesions | ||
| MSI-H: Microsatellite-high colorectal cancer | ||
| MSS: Microsatellite stable colorectal cancer | ||
| Esophagus |  | ESCC: Esophageal squamous cell carcinoma |
| HGIN: High-grade intraepithelial neoplasias | ||
| LGIN: Low-grade intraepithelial neoplasias | ||
| Liver |  | HCC: Hepatocellular carcinoma |
| NAFLD: Non-alcoholic fatty liver disease | ||
| Oral Cavity |  | EOLP: Erosive Oral lichen planus |
| LP: leukoplakia | ||
| NEOLP: Non-erosive oral lichen planus | ||
| OSCC: Oral squamous cell carcinoma | ||
| Skin | 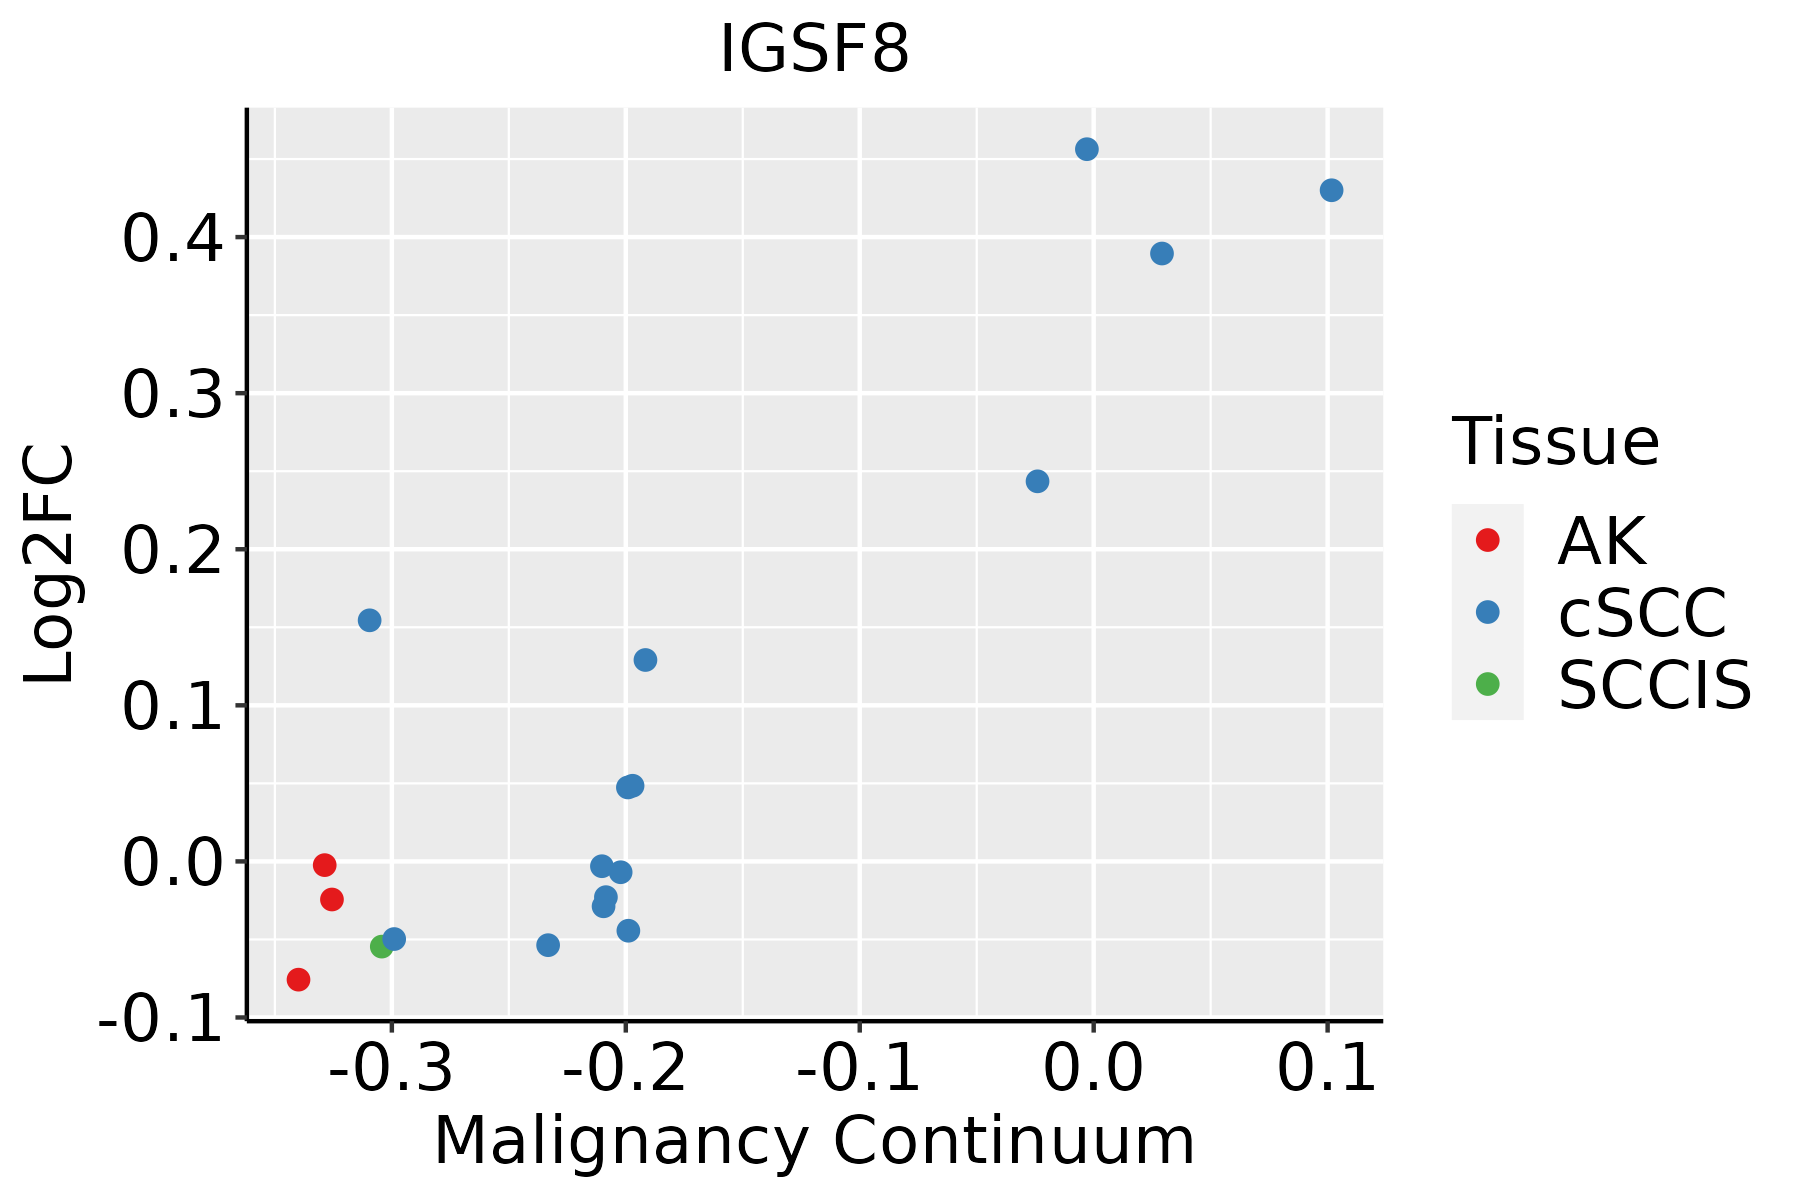 | AK: Actinic keratosis |
| cSCC: Cutaneous squamous cell carcinoma | ||
| SCCIS:squamous cell carcinoma in situ | ||
| Thyroid | 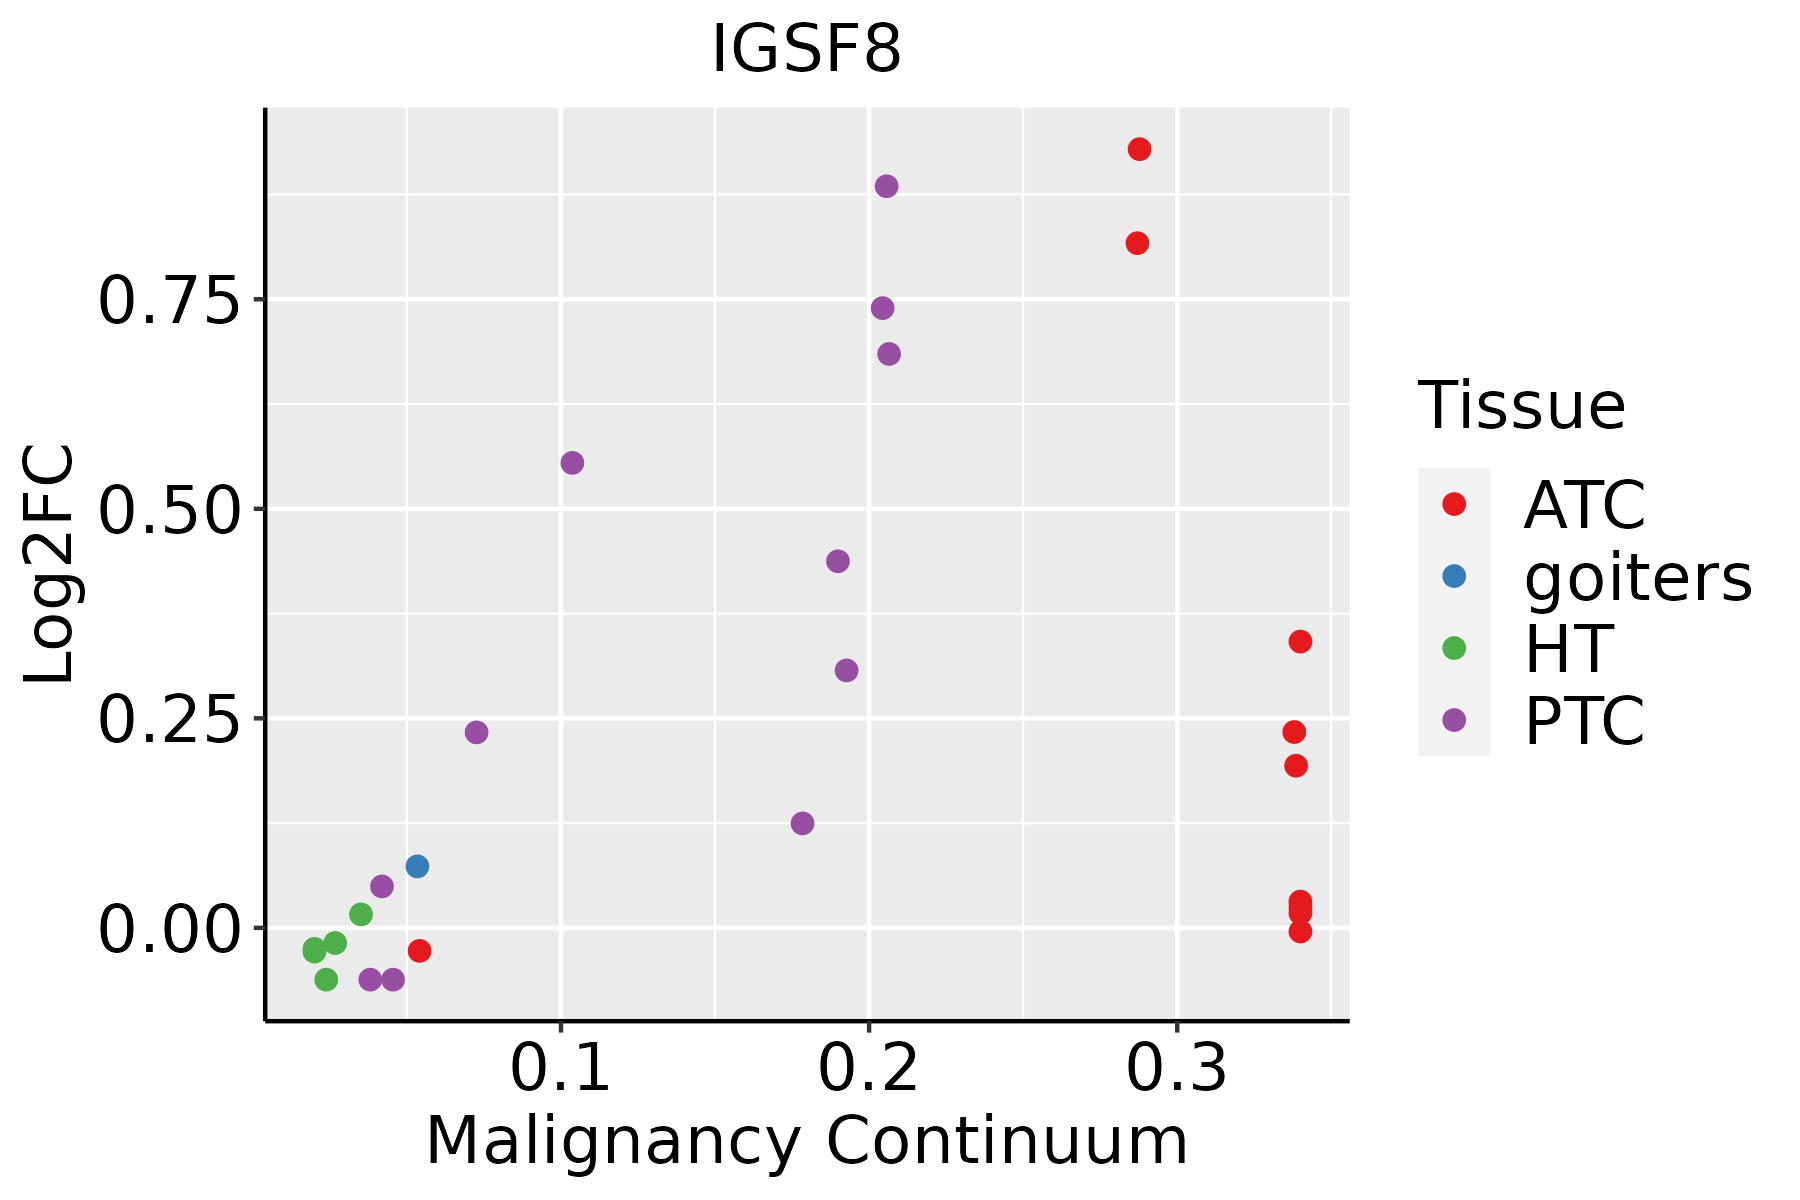 | ATC: Anaplastic thyroid cancer |
| HT: Hashimoto's thyroiditis | ||
| PTC: Papillary thyroid cancer |
| ∗log2FC in expression of this searched gene in stem-like cells from each diseased tissue sample relative to stem-like cells in normal samples in each tissue plotted against the malignancy continuum. Samples are colored based on if they are from different disease stage. |
Top |
Malignant transformation related pathway analysis |
| Find out the enriched GO biological processes and KEGG pathways involved in transition from healthy to precancer to cancer |
| Tissue | Disease Stage | Enriched GO biological Processes |
| Colorectum | AD |  |
| Colorectum | SER |  |
| Colorectum | MSS |  |
| Colorectum | MSI-H |  |
| Colorectum | FAP |  |
| ∗Top 15 enriched GO BP terms are showed in the bar plot of each disease state in each tissue. Each row represents a significant GO biological process which is colored according to the -log10(p.adjust). |
| Page: 1 2 3 4 5 6 7 8 9 |
| GO ID | Tissue | Disease Stage | Description | Gene Ratio | Bg Ratio | pvalue | p.adjust | Count |
| GO:006053716 | Esophagus | ESCC | muscle tissue development | 211/8552 | 403/18723 | 3.84e-03 | 1.56e-02 | 211 |
| GO:001470615 | Esophagus | ESCC | striated muscle tissue development | 197/8552 | 384/18723 | 1.46e-02 | 4.74e-02 | 197 |
| GO:00605378 | Oral cavity | OSCC | muscle tissue development | 185/7305 | 403/18723 | 2.60e-03 | 1.14e-02 | 185 |
| GO:00147067 | Oral cavity | OSCC | striated muscle tissue development | 174/7305 | 384/18723 | 6.45e-03 | 2.40e-02 | 174 |
| GO:006053719 | Thyroid | PTC | muscle tissue development | 156/5968 | 403/18723 | 1.98e-03 | 1.06e-02 | 156 |
| GO:001470617 | Thyroid | PTC | striated muscle tissue development | 144/5968 | 384/18723 | 1.05e-02 | 4.22e-02 | 144 |
| GO:006053724 | Thyroid | ATC | muscle tissue development | 181/6293 | 403/18723 | 1.27e-06 | 1.62e-05 | 181 |
| GO:001470622 | Thyroid | ATC | striated muscle tissue development | 168/6293 | 384/18723 | 1.91e-05 | 1.73e-04 | 168 |
| GO:000751716 | Thyroid | ATC | muscle organ development | 139/6293 | 327/18723 | 4.45e-04 | 2.64e-03 | 139 |
| GO:006053814 | Thyroid | ATC | skeletal muscle organ development | 71/6293 | 166/18723 | 8.39e-03 | 3.22e-02 | 71 |
| GO:000751913 | Thyroid | ATC | skeletal muscle tissue development | 66/6293 | 155/18723 | 1.20e-02 | 4.27e-02 | 66 |
| Page: 1 |
| Pathway ID | Tissue | Disease Stage | Description | Gene Ratio | Bg Ratio | pvalue | p.adjust | qvalue | Count |
| Page: 1 |
Top |
Cell-cell communication analysis |
| Identification of potential cell-cell interactions between two cell types and their ligand-receptor pairs for different disease states |
| Ligand | Receptor | LRpair | Pathway | Tissue | Disease Stage |
| Page: 1 |
Top |
Single-cell gene regulatory network inference analysis |
| Find out the significant the regulons (TFs) and the target genes of each regulon across cell types for different disease states |
| TF | Cell Type | Tissue | Disease Stage | Target Gene | RSS | Regulon Activity |
| ∗The dot plots of a searched regulon are shown for all cell subpopulations in each disease state of each tissue based on the regulon specific score inferred using pySCENIC and by calculating the average expression. |
| Page: 1 |
Top |
Somatic mutation of malignant transformation related genes |
| Annotation of somatic variants for genes involved in malignant transformation |
| Hugo Symbol | Variant Class | Variant Classification | dbSNP RS | HGVSc | HGVSp | HGVSp Short | SWISSPROT | BIOTYPE | SIFT | PolyPhen | Tumor Sample Barcode | Tissue | Histology | Sex | Age | Stage | Therapy Types | Drugs | Outcome |
| IGSF8 | SNV | Missense_Mutation | c.1247N>A | p.Gly416Glu | p.G416E | Q969P0 | protein_coding | deleterious(0.01) | probably_damaging(0.983) | TCGA-AN-A0AR-01 | Breast | breast invasive carcinoma | Female | <65 | I/II | Unknown | Unknown | SD | |
| IGSF8 | SNV | Missense_Mutation | rs145403328 | c.328N>A | p.Val110Met | p.V110M | Q969P0 | protein_coding | deleterious(0.03) | possibly_damaging(0.692) | TCGA-AO-A128-01 | Breast | breast invasive carcinoma | Female | <65 | I/II | Chemotherapy | doxorubicin | SD |
| IGSF8 | SNV | Missense_Mutation | c.721N>C | p.Gly241Arg | p.G241R | Q969P0 | protein_coding | tolerated(0.09) | possibly_damaging(0.484) | TCGA-AR-A256-01 | Breast | breast invasive carcinoma | Female | <65 | I/II | Chemotherapy | doxorubicin | PD | |
| IGSF8 | SNV | Missense_Mutation | c.219N>G | p.Asp73Glu | p.D73E | Q969P0 | protein_coding | tolerated(1) | benign(0) | TCGA-BH-A0AZ-01 | Breast | breast invasive carcinoma | Female | <65 | III/IV | Chemotherapy | doxorubicin | CR | |
| IGSF8 | SNV | Missense_Mutation | c.802N>A | p.Tyr268Asn | p.Y268N | Q969P0 | protein_coding | deleterious(0) | probably_damaging(0.998) | TCGA-BH-A0HY-01 | Breast | breast invasive carcinoma | Female | <65 | I/II | Hormone Therapy | taxotere | CR | |
| IGSF8 | SNV | Missense_Mutation | rs745732374 | c.799A>C | p.Thr267Pro | p.T267P | Q969P0 | protein_coding | deleterious(0.02) | possibly_damaging(0.806) | TCGA-EW-A1J3-01 | Breast | breast invasive carcinoma | Female | <65 | I/II | Chemotherapy | carboplatin | SD |
| IGSF8 | insertion | In_Frame_Ins | novel | c.1425_1426insAGACAGAGTCTTGCTCTGTCACCCAGCCTGGGATGCAGT | p.Leu475_Ala476insArgGlnSerLeuAlaLeuSerProSerLeuGlyCysSer | p.L475_A476insRQSLALSPSLGCS | Q969P0 | protein_coding | TCGA-A8-A0AB-01 | Breast | breast invasive carcinoma | Female | <65 | I/II | Chemotherapy | 5-fluorouracil | CR | ||
| IGSF8 | deletion | Frame_Shift_Del | novel | c.488_503delNNNNNNNNNNNNNNNN | p.Arg163GlnfsTer7 | p.R163Qfs*7 | Q969P0 | protein_coding | TCGA-B6-A400-01 | Breast | breast invasive carcinoma | Female | <65 | III/IV | Unknown | Unknown | SD | ||
| IGSF8 | insertion | Frame_Shift_Ins | rs754902711 | c.479dupC | p.Gly161ArgfsTer18 | p.G161Rfs*18 | Q969P0 | protein_coding | TCGA-BH-A18G-01 | Breast | breast invasive carcinoma | Female | >=65 | I/II | Unknown | Unknown | SD | ||
| IGSF8 | deletion | Frame_Shift_Del | novel | c.1115delC | p.Pro372LeufsTer22 | p.P372Lfs*22 | Q969P0 | protein_coding | TCGA-D8-A27V-01 | Breast | breast invasive carcinoma | Female | <65 | I/II | Hormone Therapy | tamoxiphen | SD |
| Page: 1 2 3 4 5 6 7 8 9 |
Top |
Related drugs of malignant transformation related genes |
| Identification of chemicals and drugs interact with genes involved in malignant transfromation |
| (DGIdb 4.0) |
| Entrez ID | Symbol | Category | Interaction Types | Drug Claim Name | Drug Name | PMIDs |
| Page: 1 |

Copyright 2023-Present -The University of Texas Health Science Center at Houston |