
|
|||||
|
 | |
| |
| |
| |
| |
| |
|
Gene: IGSF1 |
Gene summary for IGSF1 |
| Gene information | Species | Human | Gene symbol | IGSF1 | Gene ID | 3547 |
| Gene name | immunoglobulin superfamily member 1 | |
| Gene Alias | CHTE | |
| Cytomap | Xq26.1 | |
| Gene Type | protein-coding | GO ID | GO:0006139 | UniProtAcc | Q8N6C5 |
Top |
Malignant transformation analysis |
| Identification of the aberrant gene expression in precancerous and cancerous lesions by comparing the gene expression of stem-like cells in diseased tissues with normal stem cells |
| Entrez ID | Symbol | Replicates | Species | Organ | Tissue | Adj P-value | Log2FC | Malignancy |
| 3547 | IGSF1 | HTA11_3410_2000001011 | Human | Colorectum | AD | 2.09e-15 | 3.02e-01 | 0.0155 |
| 3547 | IGSF1 | HTA11_2487_2000001011 | Human | Colorectum | SER | 9.26e-25 | 6.02e-01 | -0.1808 |
| 3547 | IGSF1 | HTA11_2951_2000001011 | Human | Colorectum | AD | 3.48e-05 | 4.53e-01 | 0.0216 |
| 3547 | IGSF1 | HTA11_1938_2000001011 | Human | Colorectum | AD | 4.91e-37 | 1.16e+00 | -0.0811 |
| 3547 | IGSF1 | HTA11_78_2000001011 | Human | Colorectum | AD | 2.11e-07 | 2.64e-01 | -0.1088 |
| 3547 | IGSF1 | HTA11_347_2000001011 | Human | Colorectum | AD | 6.14e-23 | 4.44e-01 | -0.1954 |
| 3547 | IGSF1 | HTA11_411_2000001011 | Human | Colorectum | SER | 9.77e-07 | 5.87e-01 | -0.2602 |
| 3547 | IGSF1 | HTA11_2112_2000001011 | Human | Colorectum | SER | 4.27e-11 | 7.61e-01 | -0.2196 |
| 3547 | IGSF1 | HTA11_3361_2000001011 | Human | Colorectum | AD | 1.78e-23 | 7.06e-01 | -0.1207 |
| 3547 | IGSF1 | HTA11_83_2000001011 | Human | Colorectum | SER | 5.52e-18 | 6.43e-01 | -0.1526 |
| 3547 | IGSF1 | HTA11_696_2000001011 | Human | Colorectum | AD | 2.40e-50 | 9.80e-01 | -0.1464 |
| 3547 | IGSF1 | HTA11_866_2000001011 | Human | Colorectum | AD | 5.92e-30 | 5.18e-01 | -0.1001 |
| 3547 | IGSF1 | HTA11_1391_2000001011 | Human | Colorectum | AD | 2.27e-33 | 7.50e-01 | -0.059 |
| 3547 | IGSF1 | HTA11_2992_2000001011 | Human | Colorectum | SER | 2.39e-04 | 4.52e-01 | -0.1706 |
| 3547 | IGSF1 | HTA11_5212_2000001011 | Human | Colorectum | AD | 4.40e-03 | 2.88e-01 | -0.2061 |
| 3547 | IGSF1 | HTA11_5216_2000001011 | Human | Colorectum | SER | 2.56e-07 | 4.28e-01 | -0.1462 |
| 3547 | IGSF1 | HTA11_546_2000001011 | Human | Colorectum | AD | 3.96e-05 | 2.91e-01 | -0.0842 |
| 3547 | IGSF1 | HTA11_9341_2000001011 | Human | Colorectum | SER | 1.69e-04 | 4.25e-01 | -0.00410000000000005 |
| 3547 | IGSF1 | HTA11_7862_2000001011 | Human | Colorectum | AD | 4.26e-18 | 6.68e-01 | -0.0179 |
| 3547 | IGSF1 | HTA11_866_3004761011 | Human | Colorectum | AD | 2.19e-16 | 4.36e-01 | 0.096 |
| Page: 1 2 3 |
| Tissue | Expression Dynamics | Abbreviation |
| Colorectum (GSE201348) | 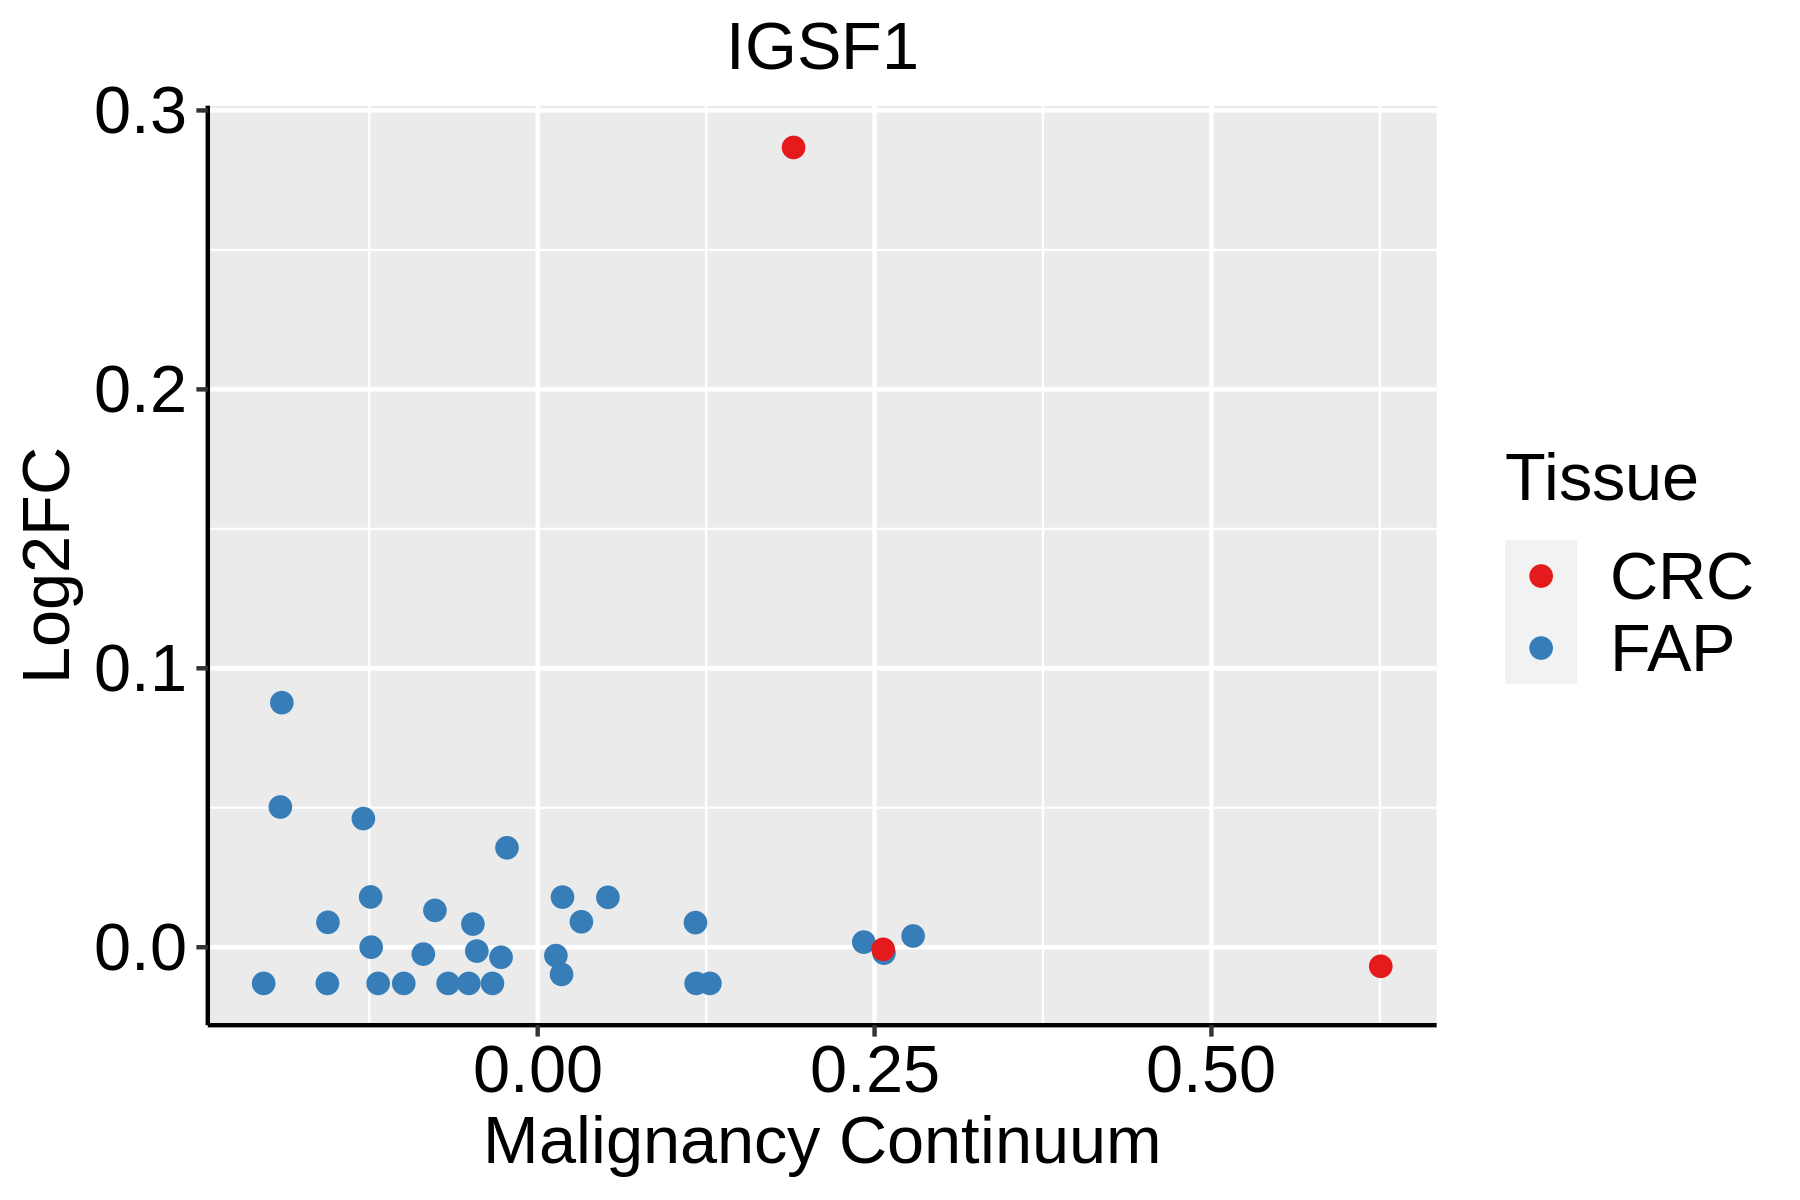 | FAP: Familial adenomatous polyposis |
| CRC: Colorectal cancer | ||
| Colorectum (HTA11) | 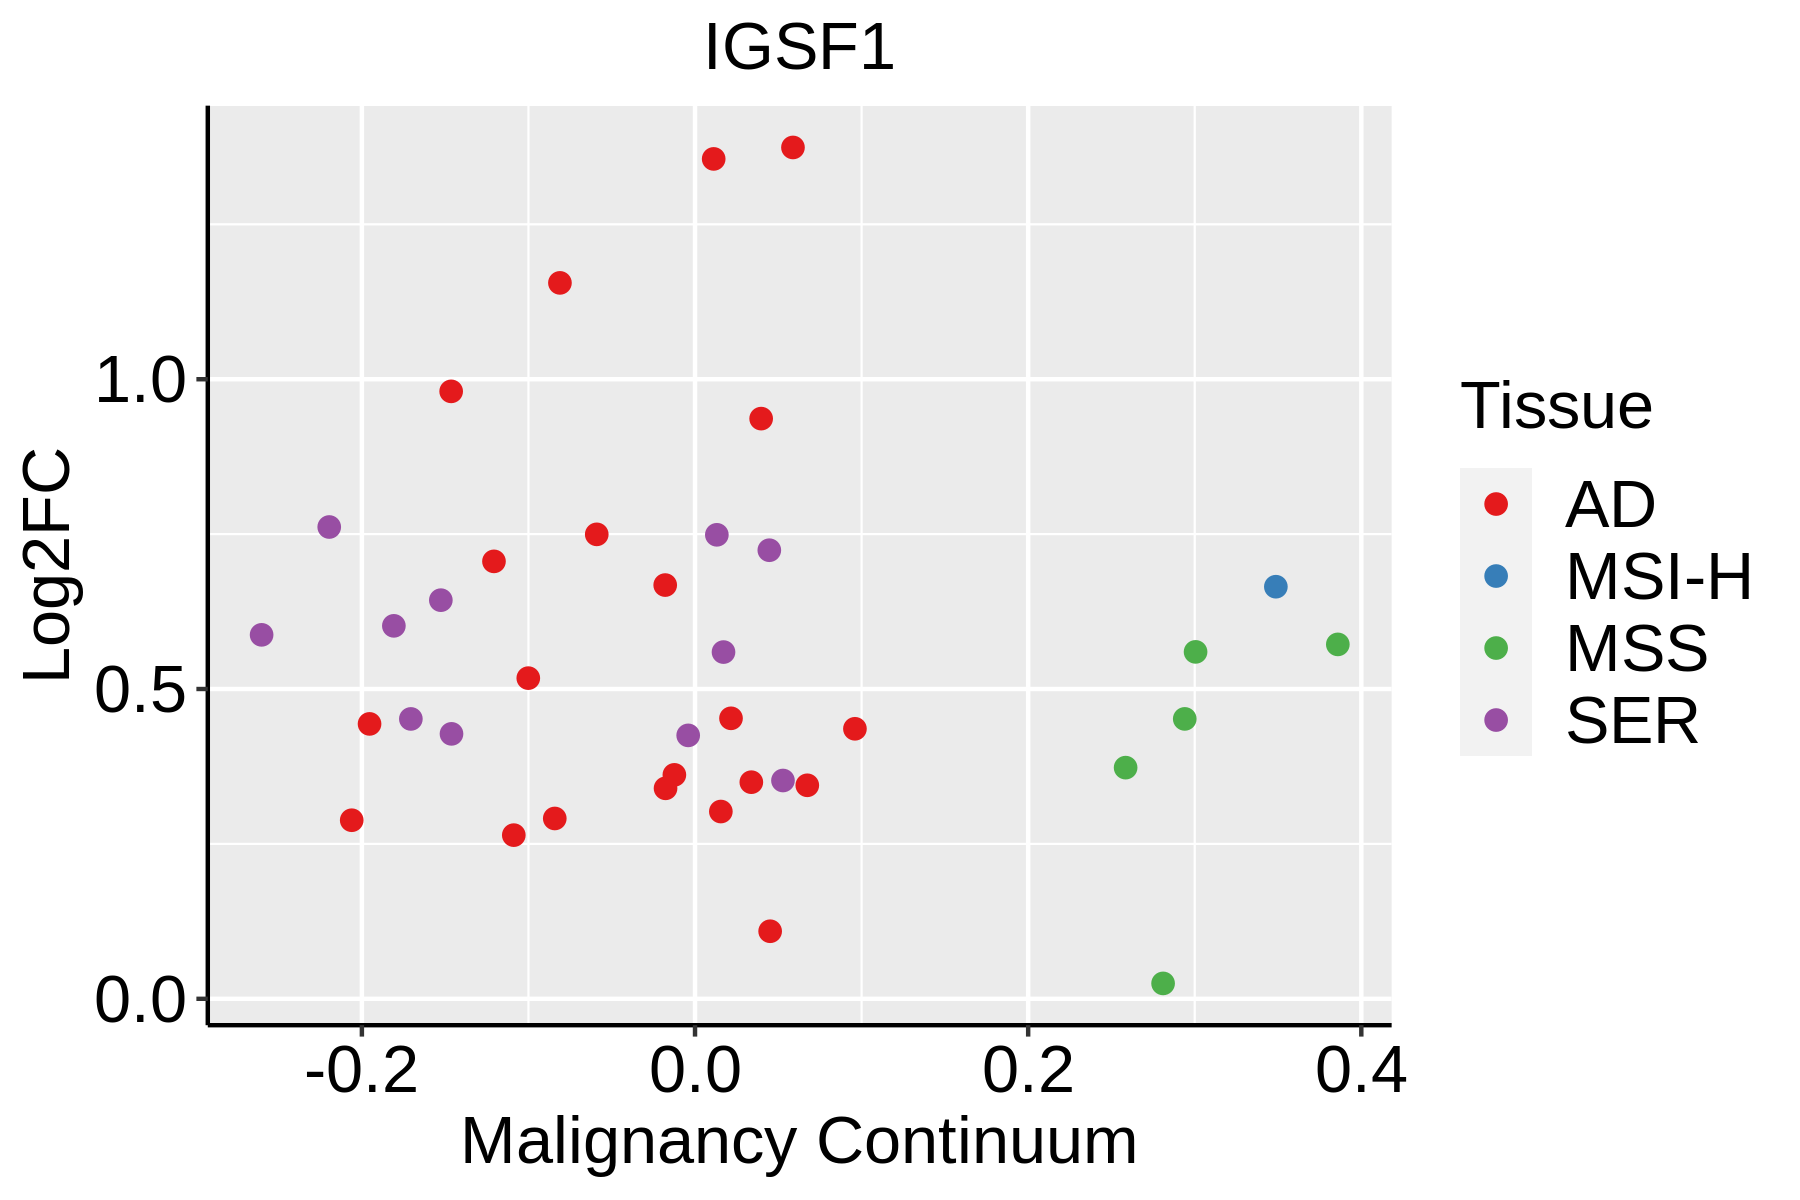 | AD: Adenomas |
| SER: Sessile serrated lesions | ||
| MSI-H: Microsatellite-high colorectal cancer | ||
| MSS: Microsatellite stable colorectal cancer | ||
| Lung | 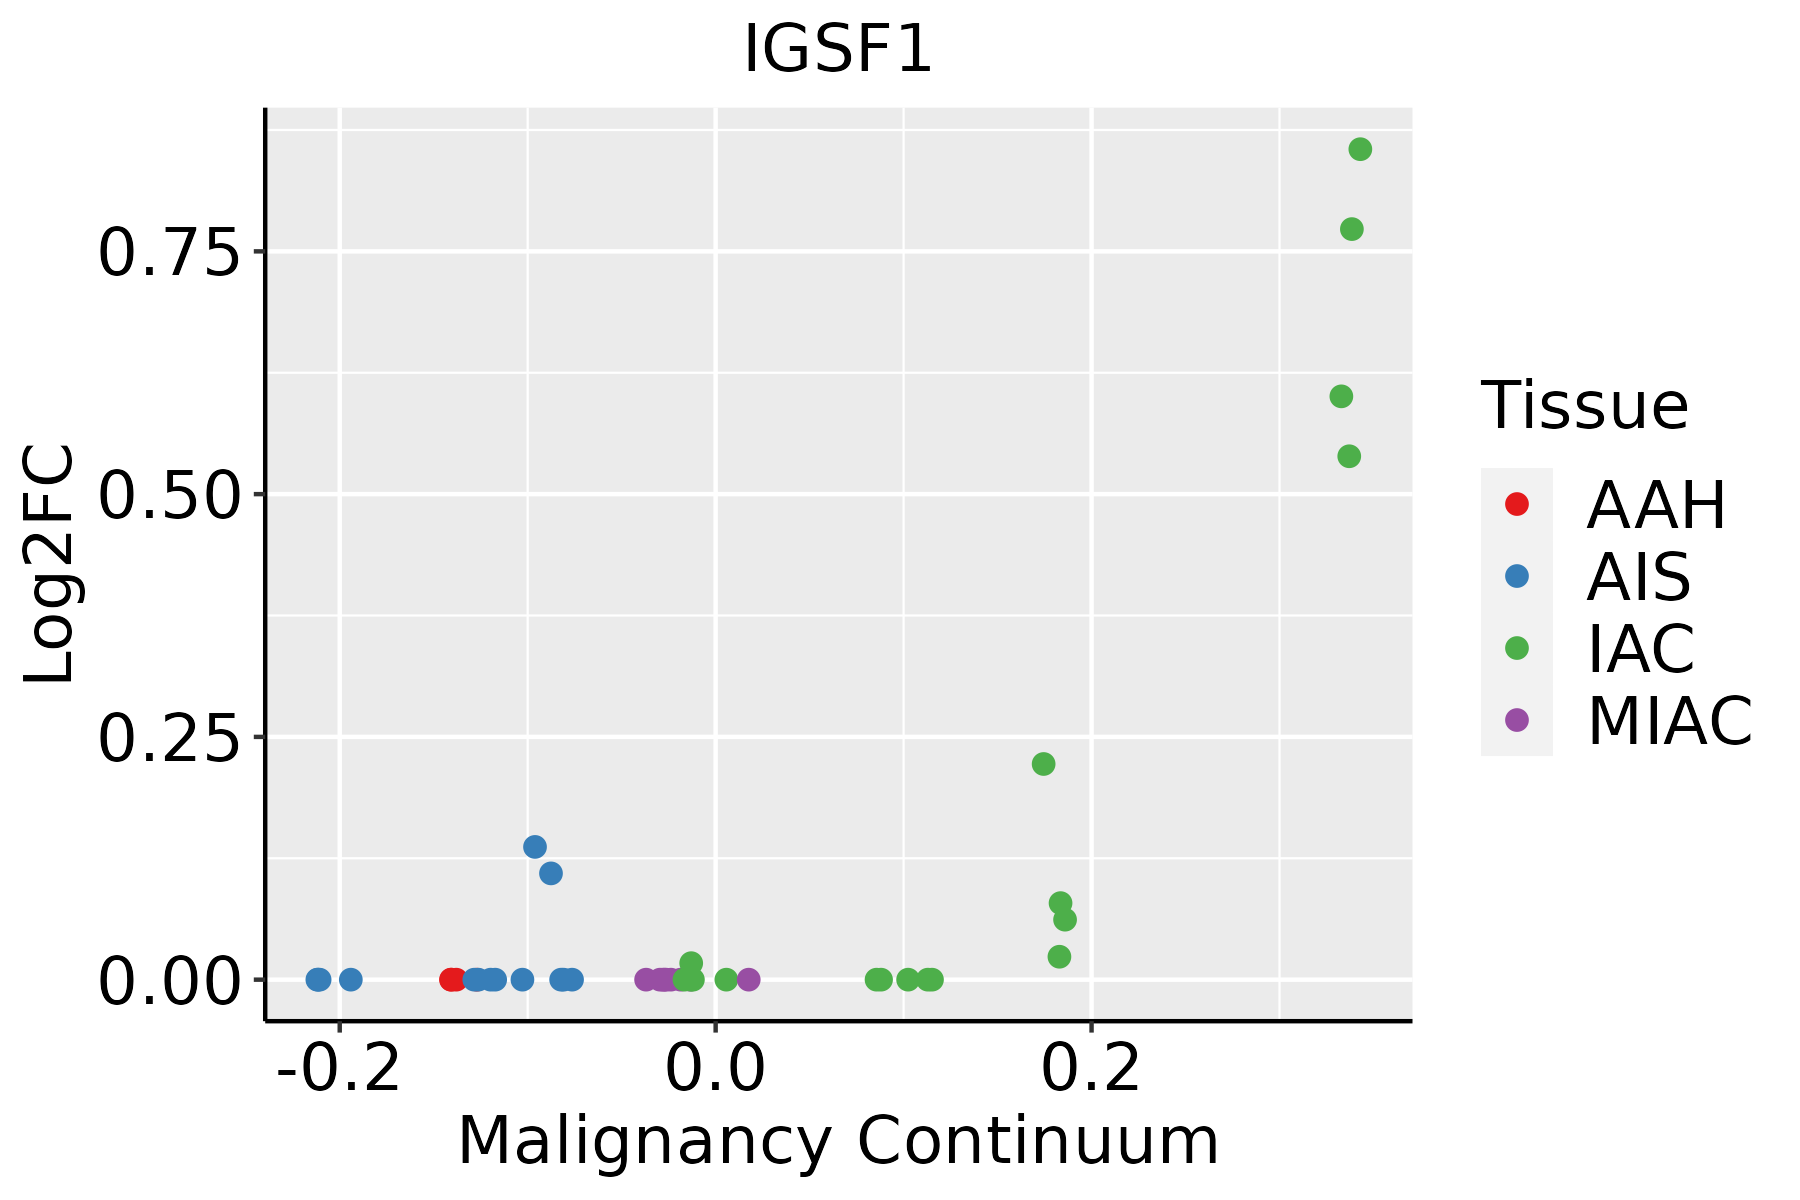 | AAH: Atypical adenomatous hyperplasia |
| AIS: Adenocarcinoma in situ | ||
| IAC: Invasive lung adenocarcinoma | ||
| MIA: Minimally invasive adenocarcinoma | ||
| Thyroid | 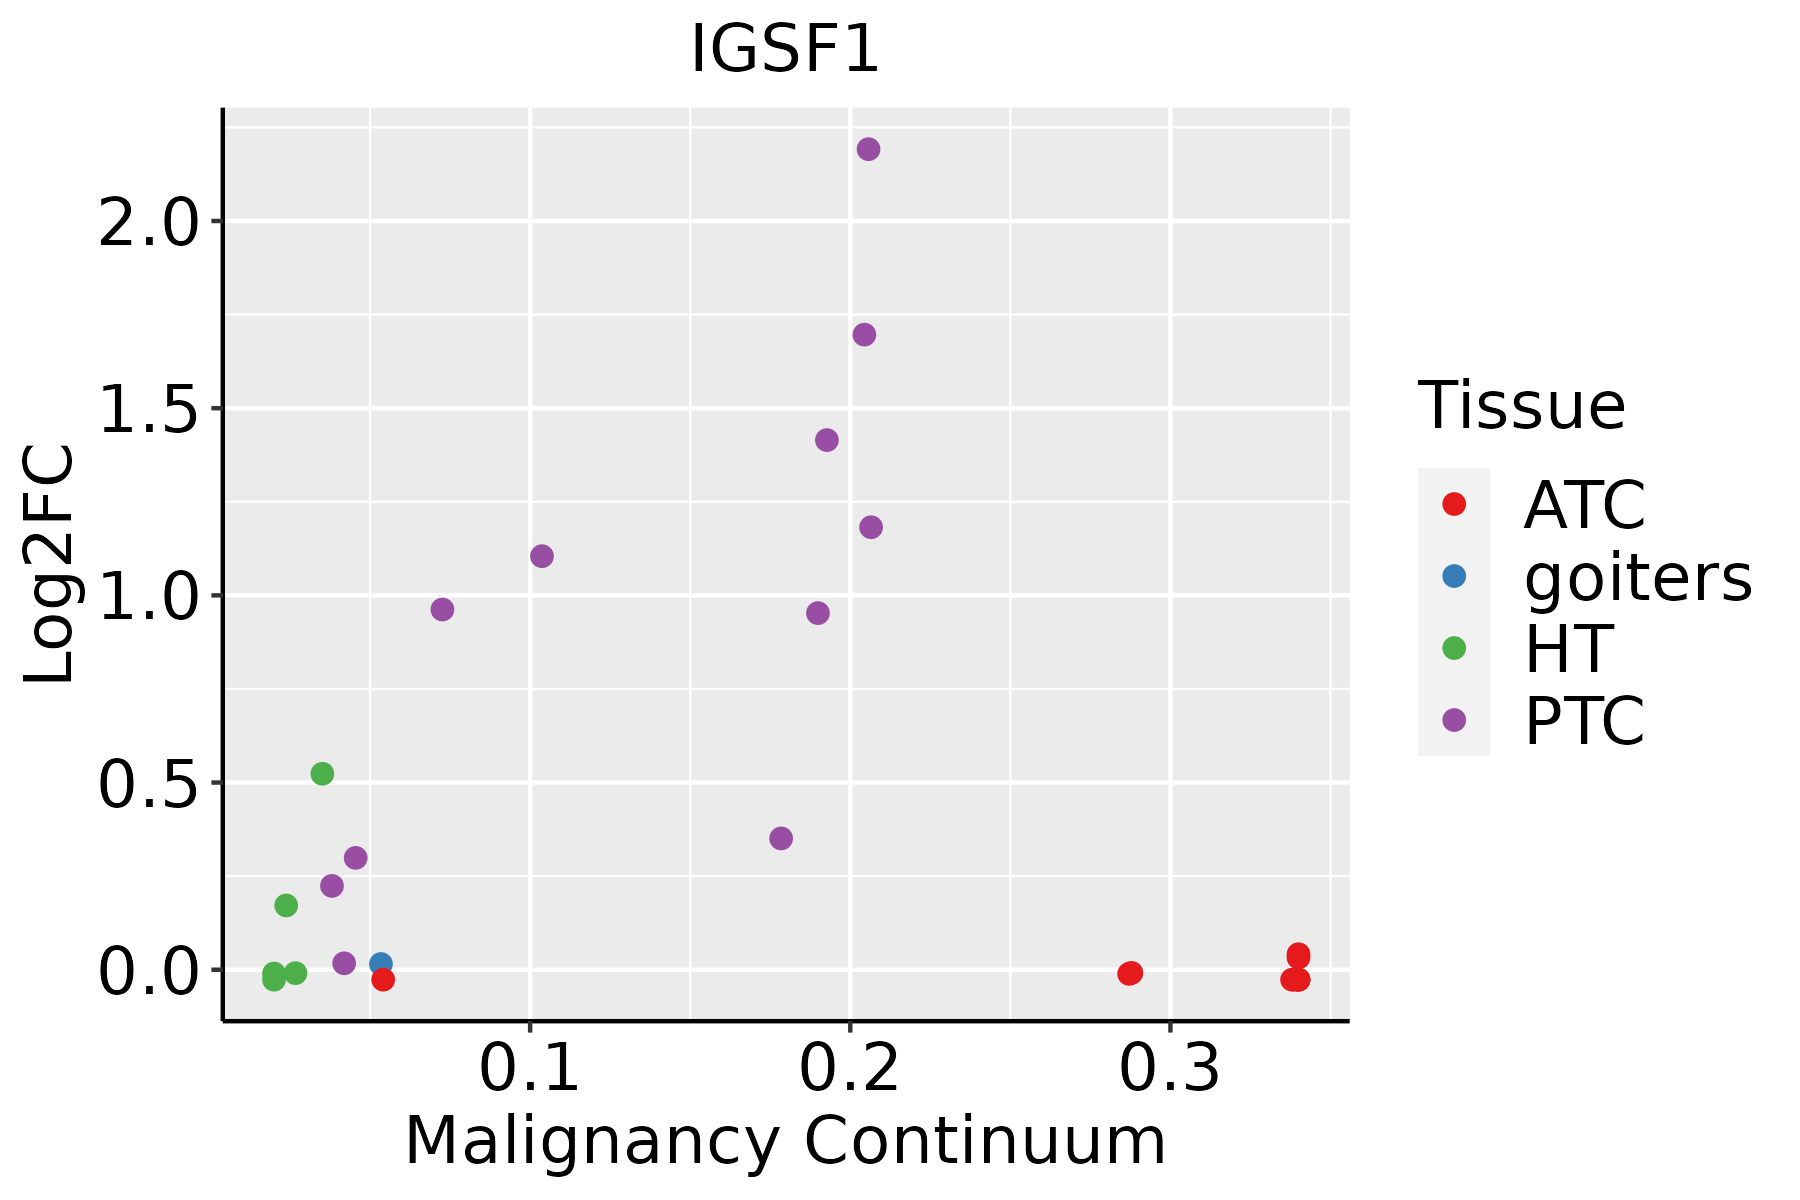 | ATC: Anaplastic thyroid cancer |
| HT: Hashimoto's thyroiditis | ||
| PTC: Papillary thyroid cancer |
| ∗log2FC in expression of this searched gene in stem-like cells from each diseased tissue sample relative to stem-like cells in normal samples in each tissue plotted against the malignancy continuum. Samples are colored based on if they are from different disease stage. |
Top |
Malignant transformation related pathway analysis |
| Find out the enriched GO biological processes and KEGG pathways involved in transition from healthy to precancer to cancer |
| Tissue | Disease Stage | Enriched GO biological Processes |
| Colorectum | AD |  |
| Colorectum | SER |  |
| Colorectum | MSS |  |
| Colorectum | MSI-H |  |
| Colorectum | FAP |  |
| ∗Top 15 enriched GO BP terms are showed in the bar plot of each disease state in each tissue. Each row represents a significant GO biological process which is colored according to the -log10(p.adjust). |
| Page: 1 2 3 4 5 6 7 8 9 |
| GO ID | Tissue | Disease Stage | Description | Gene Ratio | Bg Ratio | pvalue | p.adjust | Count |
| GO:0007178 | Colorectum | AD | transmembrane receptor protein serine/threonine kinase signaling pathway | 99/3918 | 355/18723 | 9.92e-04 | 9.28e-03 | 99 |
| GO:00451851 | Colorectum | SER | maintenance of protein location | 26/2897 | 94/18723 | 1.76e-03 | 1.81e-02 | 26 |
| GO:00071781 | Colorectum | MSS | transmembrane receptor protein serine/threonine kinase signaling pathway | 86/3467 | 355/18723 | 4.04e-03 | 2.95e-02 | 86 |
| GO:00071783 | Colorectum | CRC | transmembrane receptor protein serine/threonine kinase signaling pathway | 66/2078 | 355/18723 | 1.74e-05 | 5.28e-04 | 66 |
| GO:00900921 | Colorectum | CRC | regulation of transmembrane receptor protein serine/threonine kinase signaling pathway | 46/2078 | 256/18723 | 6.66e-04 | 8.77e-03 | 46 |
| GO:00071785 | Lung | IAC | transmembrane receptor protein serine/threonine kinase signaling pathway | 60/2061 | 355/18723 | 4.82e-04 | 7.03e-03 | 60 |
| GO:000717818 | Thyroid | HT | transmembrane receptor protein serine/threonine kinase signaling pathway | 42/1272 | 355/18723 | 3.21e-04 | 4.20e-03 | 42 |
| GO:000717819 | Thyroid | PTC | transmembrane receptor protein serine/threonine kinase signaling pathway | 156/5968 | 355/18723 | 1.02e-06 | 1.51e-05 | 156 |
| GO:00900925 | Thyroid | PTC | regulation of transmembrane receptor protein serine/threonine kinase signaling pathway | 108/5968 | 256/18723 | 3.07e-04 | 2.14e-03 | 108 |
| GO:00901013 | Thyroid | PTC | negative regulation of transmembrane receptor protein serine/threonine kinase signaling pathway | 56/5968 | 131/18723 | 5.63e-03 | 2.55e-02 | 56 |
| GO:000717823 | Thyroid | ATC | transmembrane receptor protein serine/threonine kinase signaling pathway | 170/6293 | 355/18723 | 1.40e-08 | 2.87e-07 | 170 |
| GO:009009214 | Thyroid | ATC | regulation of transmembrane receptor protein serine/threonine kinase signaling pathway | 120/6293 | 256/18723 | 6.62e-06 | 6.85e-05 | 120 |
| GO:009010111 | Thyroid | ATC | negative regulation of transmembrane receptor protein serine/threonine kinase signaling pathway | 62/6293 | 131/18723 | 7.59e-04 | 4.20e-03 | 62 |
| Page: 1 |
| Pathway ID | Tissue | Disease Stage | Description | Gene Ratio | Bg Ratio | pvalue | p.adjust | qvalue | Count |
| hsa04350 | Colorectum | SER | TGF-beta signaling pathway | 31/1580 | 108/8465 | 7.00e-03 | 3.77e-02 | 2.74e-02 | 31 |
| hsa043501 | Colorectum | SER | TGF-beta signaling pathway | 31/1580 | 108/8465 | 7.00e-03 | 3.77e-02 | 2.74e-02 | 31 |
| Page: 1 |
Top |
Cell-cell communication analysis |
| Identification of potential cell-cell interactions between two cell types and their ligand-receptor pairs for different disease states |
| Ligand | Receptor | LRpair | Pathway | Tissue | Disease Stage |
| Page: 1 |
Top |
Single-cell gene regulatory network inference analysis |
| Find out the significant the regulons (TFs) and the target genes of each regulon across cell types for different disease states |
| TF | Cell Type | Tissue | Disease Stage | Target Gene | RSS | Regulon Activity |
| ∗The dot plots of a searched regulon are shown for all cell subpopulations in each disease state of each tissue based on the regulon specific score inferred using pySCENIC and by calculating the average expression. |
| Page: 1 |
Top |
Somatic mutation of malignant transformation related genes |
| Annotation of somatic variants for genes involved in malignant transformation |
| Hugo Symbol | Variant Class | Variant Classification | dbSNP RS | HGVSc | HGVSp | HGVSp Short | SWISSPROT | BIOTYPE | SIFT | PolyPhen | Tumor Sample Barcode | Tissue | Histology | Sex | Age | Stage | Therapy Types | Drugs | Outcome |
| IGSF1 | SNV | Missense_Mutation | novel | c.1810A>C | p.Asn604His | p.N604H | Q8N6C5 | protein_coding | deleterious(0.05) | probably_damaging(0.999) | TCGA-A2-A0EO-01 | Breast | breast invasive carcinoma | Female | <65 | I/II | Hormone Therapy | tamoxiphen | SD |
| IGSF1 | SNV | Missense_Mutation | c.3122A>G | p.Tyr1041Cys | p.Y1041C | Q8N6C5 | protein_coding | deleterious(0) | probably_damaging(0.999) | TCGA-A2-A0EU-01 | Breast | breast invasive carcinoma | Female | >=65 | I/II | Unknown | Unknown | SD | |
| IGSF1 | SNV | Missense_Mutation | novel | c.3174N>A | p.Ser1058Arg | p.S1058R | Q8N6C5 | protein_coding | deleterious(0) | probably_damaging(0.991) | TCGA-A2-A4S1-01 | Breast | breast invasive carcinoma | Female | >=65 | I/II | Unknown | Unknown | SD |
| IGSF1 | SNV | Missense_Mutation | novel | c.1640N>A | p.Arg547Lys | p.R547K | Q8N6C5 | protein_coding | deleterious(0.04) | probably_damaging(0.97) | TCGA-A8-A07U-01 | Breast | breast invasive carcinoma | Female | >=65 | III/IV | Chemotherapy | 5-fluorouracil | SD |
| IGSF1 | SNV | Missense_Mutation | c.2645N>A | p.Leu882His | p.L882H | Q8N6C5 | protein_coding | deleterious(0) | probably_damaging(0.967) | TCGA-A8-A096-01 | Breast | breast invasive carcinoma | Female | >=65 | I/II | Unknown | Unknown | SD | |
| IGSF1 | SNV | Missense_Mutation | c.2217N>G | p.Phe739Leu | p.F739L | Q8N6C5 | protein_coding | tolerated(0.75) | benign(0.006) | TCGA-A8-A0A7-01 | Breast | breast invasive carcinoma | Female | <65 | I/II | Unknown | Unknown | SD | |
| IGSF1 | SNV | Missense_Mutation | novel | c.3995G>T | p.Arg1332Ile | p.R1332I | Q8N6C5 | protein_coding | deleterious_low_confidence(0.03) | benign(0.169) | TCGA-AN-A046-01 | Breast | breast invasive carcinoma | Female | >=65 | I/II | Unknown | Unknown | SD |
| IGSF1 | SNV | Missense_Mutation | rs201712796 | c.2767C>T | p.Arg923Trp | p.R923W | Q8N6C5 | protein_coding | tolerated(0.07) | possibly_damaging(0.655) | TCGA-AN-A046-01 | Breast | breast invasive carcinoma | Female | >=65 | I/II | Unknown | Unknown | SD |
| IGSF1 | SNV | Missense_Mutation | novel | c.1151A>G | p.Tyr384Cys | p.Y384C | Q8N6C5 | protein_coding | tolerated(0.17) | possibly_damaging(0.819) | TCGA-AN-A046-01 | Breast | breast invasive carcinoma | Female | >=65 | I/II | Unknown | Unknown | SD |
| IGSF1 | SNV | Missense_Mutation | novel | c.3085N>A | p.Pro1029Thr | p.P1029T | Q8N6C5 | protein_coding | tolerated(0.39) | benign(0.197) | TCGA-B6-A409-01 | Breast | breast invasive carcinoma | Female | <65 | III/IV | Chemotherapy | cyclophosphamide | PD |
| Page: 1 2 3 4 5 6 7 8 9 10 11 12 13 14 15 16 17 18 19 20 21 22 23 24 25 |
Top |
Related drugs of malignant transformation related genes |
| Identification of chemicals and drugs interact with genes involved in malignant transfromation |
| (DGIdb 4.0) |
| Entrez ID | Symbol | Category | Interaction Types | Drug Claim Name | Drug Name | PMIDs |
| Page: 1 |

Copyright 2023-Present -The University of Texas Health Science Center at Houston |