
|
|||||
|
 | |
| |
| |
| |
| |
| |
|
Gene: IGLL5 |
Gene summary for IGLL5 |
| Gene information | Species | Human | Gene symbol | IGLL5 | Gene ID | 100423062 |
| Gene name | immunoglobulin lambda like polypeptide 5 | |
| Gene Alias | IGL | |
| Cytomap | 22q11.22 | |
| Gene Type | protein-coding | GO ID | GO:0001775 | UniProtAcc | B9A064 |
Top |
Malignant transformation analysis |
| Identification of the aberrant gene expression in precancerous and cancerous lesions by comparing the gene expression of stem-like cells in diseased tissues with normal stem cells |
| Entrez ID | Symbol | Replicates | Species | Organ | Tissue | Adj P-value | Log2FC | Malignancy |
| 100423062 | IGLL5 | GSM6177620_NYU_UCEC1_lib1_lib1 | Human | Endometrium | EEC | 2.87e-25 | 7.98e-01 | -0.1869 |
| 100423062 | IGLL5 | GSM6177620_NYU_UCEC1_lib2_lib2 | Human | Endometrium | EEC | 3.00e-19 | 6.67e-01 | -0.1875 |
| 100423062 | IGLL5 | GSM6177620_NYU_UCEC1_lib3_lib3 | Human | Endometrium | EEC | 4.66e-18 | 6.68e-01 | -0.1883 |
| 100423062 | IGLL5 | NAG_2 | Human | Stomach | CSG | 3.99e-23 | 8.04e-01 | -0.3324 |
| 100423062 | IGLL5 | CAG_1 | Human | Stomach | CAG | 2.40e-17 | 1.01e+00 | -0.3206 |
| 100423062 | IGLL5 | CAG_2 | Human | Stomach | CAG | 2.07e-17 | 5.84e-01 | -0.2831 |
| 100423062 | IGLL5 | WIM_1 | Human | Stomach | WIM | 2.02e-02 | 3.38e-01 | 0.0335 |
| 100423062 | IGLL5 | WIM_2 | Human | Stomach | WIM | 4.79e-22 | 9.05e-01 | 0.1159 |
| 100423062 | IGLL5 | SIM_1 | Human | Stomach | SIM | 8.05e-63 | 1.31e+00 | 0.3573 |
| 100423062 | IGLL5 | SIM_2 | Human | Stomach | SIM | 8.54e-29 | 7.68e-01 | 0.3139 |
| 100423062 | IGLL5 | SIM_4 | Human | Stomach | SIM | 3.34e-04 | 3.82e-01 | 0.2664 |
| 100423062 | IGLL5 | Pt1_Superficial | Human | Stomach | GC | 5.55e-21 | 9.76e-01 | 0.1036 |
| 100423062 | IGLL5 | Pt2_Superficial | Human | Stomach | GC | 2.31e-07 | 8.92e-01 | 0.2977 |
| Page: 1 |
| Tissue | Expression Dynamics | Abbreviation |
| Endometrium | 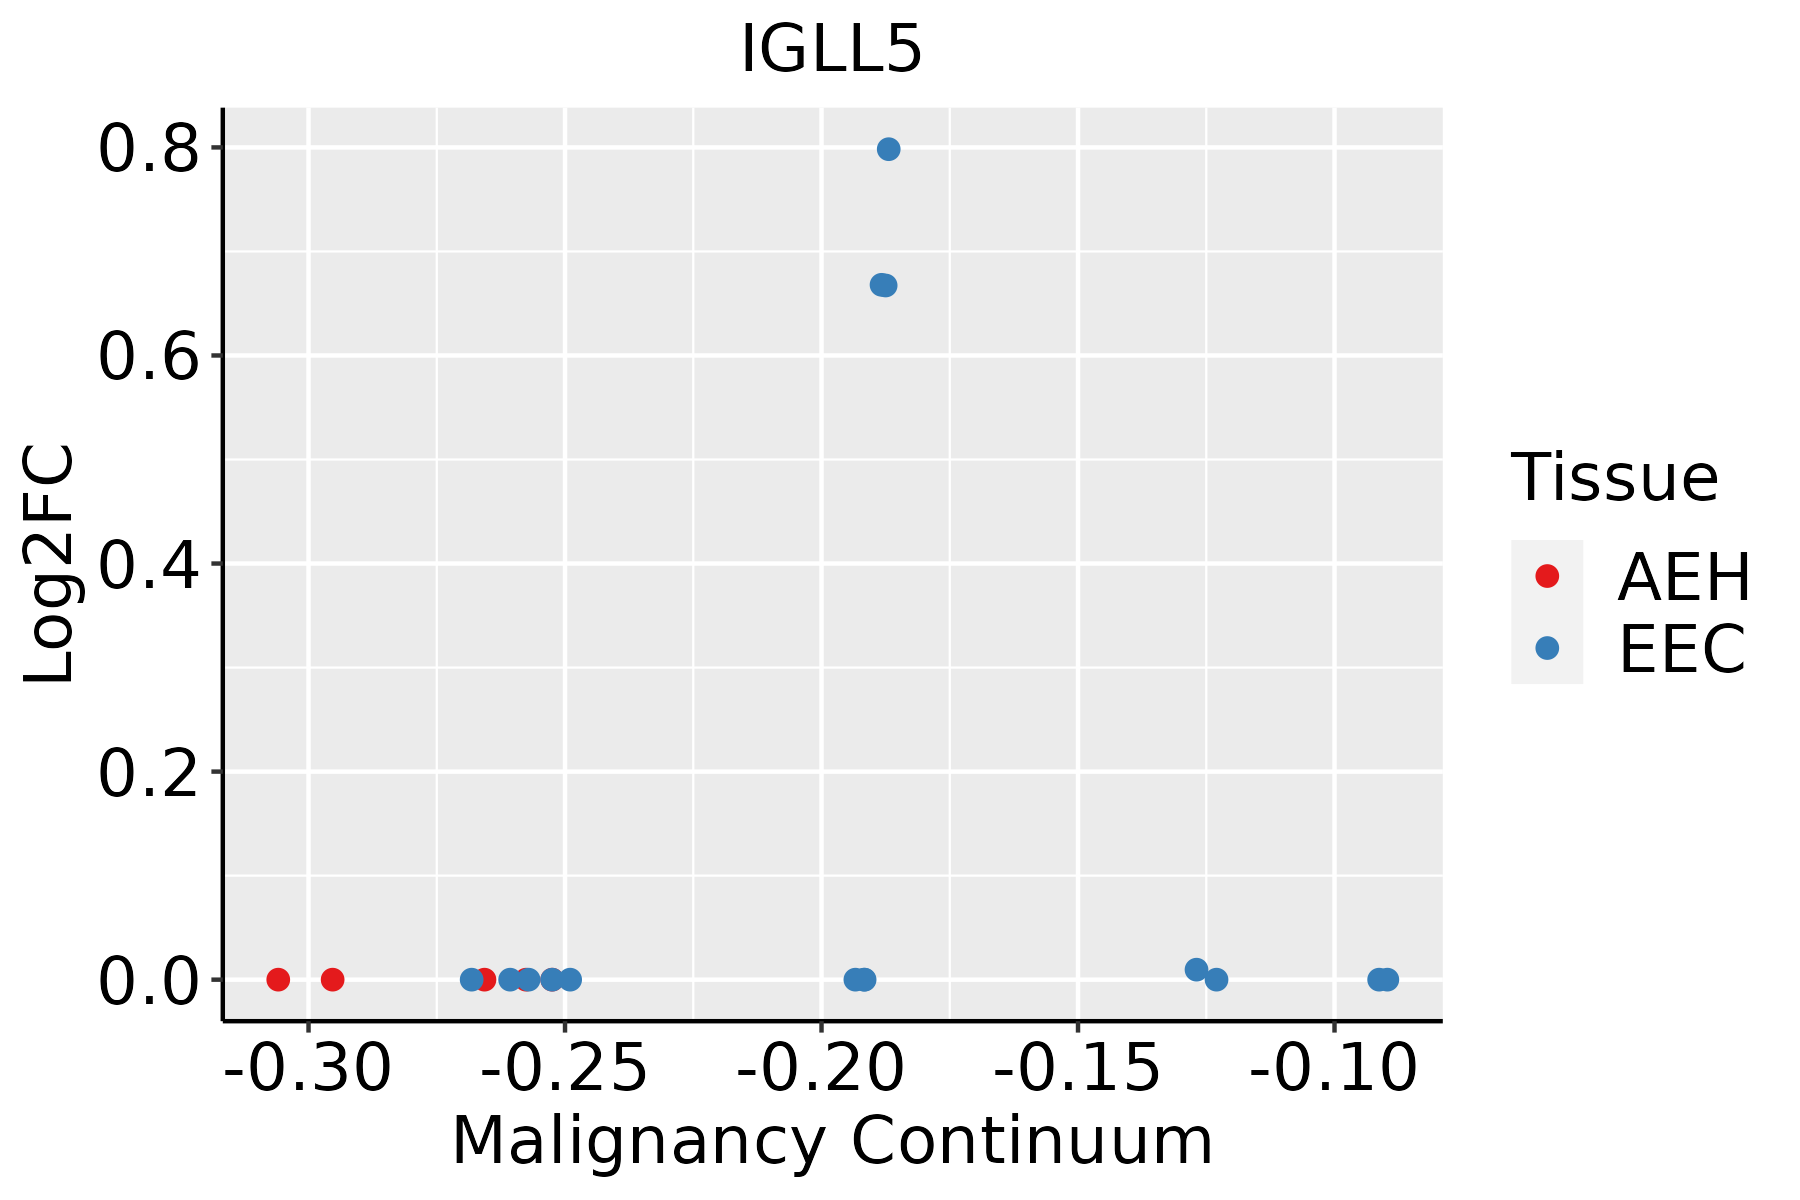 | AEH: Atypical endometrial hyperplasia |
| EEC: Endometrioid Cancer | ||
| GC |  | CAG: Chronic atrophic gastritis |
| CAG with IM: Chronic atrophic gastritis with intestinal metaplasia | ||
| CSG: Chronic superficial gastritis | ||
| GC: Gastric cancer | ||
| SIM: Severe intestinal metaplasia | ||
| WIM: Wild intestinal metaplasia |
| ∗log2FC in expression of this searched gene in stem-like cells from each diseased tissue sample relative to stem-like cells in normal samples in each tissue plotted against the malignancy continuum. Samples are colored based on if they are from different disease stage. |
Top |
Malignant transformation related pathway analysis |
| Find out the enriched GO biological processes and KEGG pathways involved in transition from healthy to precancer to cancer |
| Tissue | Disease Stage | Enriched GO biological Processes |
| Colorectum | AD |  |
| Colorectum | SER |  |
| Colorectum | MSS |  |
| Colorectum | MSI-H |  |
| Colorectum | FAP |  |
| ∗Top 15 enriched GO BP terms are showed in the bar plot of each disease state in each tissue. Each row represents a significant GO biological process which is colored according to the -log10(p.adjust). |
| Page: 1 2 3 4 5 6 7 8 9 |
| GO ID | Tissue | Disease Stage | Description | Gene Ratio | Bg Ratio | pvalue | p.adjust | Count |
| GO:000276412 | Endometrium | EEC | immune response-regulating signaling pathway | 80/2168 | 468/18723 | 2.20e-04 | 2.64e-03 | 80 |
| GO:0006959 | Stomach | GC | humoral immune response | 42/1159 | 317/18723 | 2.59e-06 | 1.10e-04 | 42 |
| GO:0051251 | Stomach | GC | positive regulation of lymphocyte activation | 43/1159 | 362/18723 | 3.12e-05 | 8.51e-04 | 43 |
| GO:0002696 | Stomach | GC | positive regulation of leukocyte activation | 46/1159 | 409/18723 | 6.50e-05 | 1.46e-03 | 46 |
| GO:0050867 | Stomach | GC | positive regulation of cell activation | 46/1159 | 420/18723 | 1.22e-04 | 2.33e-03 | 46 |
| GO:0016064 | Stomach | GC | immunoglobulin mediated immune response | 26/1159 | 207/18723 | 4.66e-04 | 6.83e-03 | 26 |
| GO:0019724 | Stomach | GC | B cell mediated immunity | 26/1159 | 210/18723 | 5.82e-04 | 7.99e-03 | 26 |
| GO:0042742 | Stomach | GC | defense response to bacterium | 37/1159 | 350/18723 | 1.05e-03 | 1.23e-02 | 37 |
| GO:0002764 | Stomach | GC | immune response-regulating signaling pathway | 46/1159 | 468/18723 | 1.31e-03 | 1.46e-02 | 46 |
| GO:0010324 | Stomach | GC | membrane invagination | 19/1159 | 144/18723 | 1.44e-03 | 1.57e-02 | 19 |
| GO:0050851 | Stomach | GC | antigen receptor-mediated signaling pathway | 27/1159 | 240/18723 | 1.96e-03 | 2.00e-02 | 27 |
| GO:0099024 | Stomach | GC | plasma membrane invagination | 17/1159 | 136/18723 | 4.41e-03 | 3.60e-02 | 17 |
| GO:0002460 | Stomach | GC | adaptive immune response based on somatic recombination of immune receptors built from immunoglobulin superfamily domains | 35/1159 | 356/18723 | 4.64e-03 | 3.76e-02 | 35 |
| GO:0006911 | Stomach | GC | phagocytosis, engulfment | 16/1159 | 127/18723 | 5.22e-03 | 4.11e-02 | 16 |
| GO:0002253 | Stomach | GC | activation of immune response | 36/1159 | 375/18723 | 6.03e-03 | 4.55e-02 | 36 |
| GO:0002449 | Stomach | GC | lymphocyte mediated immunity | 34/1159 | 350/18723 | 6.25e-03 | 4.69e-02 | 34 |
| GO:0006956 | Stomach | GC | complement activation | 16/1159 | 130/18723 | 6.54e-03 | 4.83e-02 | 16 |
| GO:0006958 | Stomach | GC | complement activation, classical pathway | 14/1159 | 108/18723 | 6.75e-03 | 4.90e-02 | 14 |
| GO:00069592 | Stomach | CSG | humoral immune response | 40/1034 | 317/18723 | 9.26e-07 | 4.76e-05 | 40 |
| GO:00512512 | Stomach | CSG | positive regulation of lymphocyte activation | 38/1034 | 362/18723 | 1.13e-04 | 2.42e-03 | 38 |
| Page: 1 2 3 |
| Pathway ID | Tissue | Disease Stage | Description | Gene Ratio | Bg Ratio | pvalue | p.adjust | qvalue | Count |
| Page: 1 |
Top |
Cell-cell communication analysis |
| Identification of potential cell-cell interactions between two cell types and their ligand-receptor pairs for different disease states |
| Ligand | Receptor | LRpair | Pathway | Tissue | Disease Stage |
| Page: 1 |
Top |
Single-cell gene regulatory network inference analysis |
| Find out the significant the regulons (TFs) and the target genes of each regulon across cell types for different disease states |
| TF | Cell Type | Tissue | Disease Stage | Target Gene | RSS | Regulon Activity |
| ∗The dot plots of a searched regulon are shown for all cell subpopulations in each disease state of each tissue based on the regulon specific score inferred using pySCENIC and by calculating the average expression. |
| Page: 1 |
Top |
Somatic mutation of malignant transformation related genes |
| Annotation of somatic variants for genes involved in malignant transformation |
| Hugo Symbol | Variant Class | Variant Classification | dbSNP RS | HGVSc | HGVSp | HGVSp Short | SWISSPROT | BIOTYPE | SIFT | PolyPhen | Tumor Sample Barcode | Tissue | Histology | Sex | Age | Stage | Therapy Types | Drugs | Outcome |
| IGLL5 | SNV | Missense_Mutation | c.313N>C | p.Val105Leu | p.V105L | B9A064 | protein_coding | tolerated_low_confidence(1) | benign(0) | TCGA-D8-A1XQ-01 | Breast | breast invasive carcinoma | Female | >=65 | I/II | Unknown | Unknown | SD | |
| IGLL5 | deletion | Frame_Shift_Del | novel | c.592_628delACGCATGAAGGGAGCACCGTGGAGAAGACAGTGGCCC | p.Thr198LeufsTer41 | p.T198Lfs*41 | B9A064 | protein_coding | TCGA-AN-A0FX-01 | Breast | breast invasive carcinoma | Female | <65 | I/II | Unknown | Unknown | SD | ||
| IGLL5 | SNV | Missense_Mutation | novel | c.484G>A | p.Glu162Lys | p.E162K | B9A064 | protein_coding | deleterious_low_confidence(0.01) | benign(0.282) | TCGA-C5-A1BK-01 | Cervix | cervical & endocervical cancer | Female | <65 | I/II | Unknown | Unknown | SD |
| IGLL5 | SNV | Missense_Mutation | novel | c.391A>G | p.Lys131Glu | p.K131E | B9A064 | protein_coding | deleterious_low_confidence(0) | possibly_damaging(0.541) | TCGA-C5-A8XH-01 | Cervix | cervical & endocervical cancer | Female | <65 | I/II | Unknown | Unknown | SD |
| IGLL5 | SNV | Missense_Mutation | rs565314713 | c.119N>A | p.Arg40His | p.R40H | B9A064 | protein_coding | tolerated_low_confidence(0.4) | benign(0) | TCGA-AA-3492-01 | Colorectum | colon adenocarcinoma | Female | >=65 | I/II | Unknown | Unknown | SD |
| IGLL5 | SNV | Missense_Mutation | rs560170702 | c.148N>G | p.Pro50Ala | p.P50A | B9A064 | protein_coding | tolerated_low_confidence(0.29) | benign(0.074) | TCGA-AA-3494-01 | Colorectum | colon adenocarcinoma | Male | <65 | III/IV | Chemotherapy | folinic | PR |
| IGLL5 | SNV | Missense_Mutation | c.305N>T | p.Gly102Val | p.G102V | B9A064 | protein_coding | deleterious_low_confidence(0.01) | probably_damaging(0.958) | TCGA-AA-3854-01 | Colorectum | colon adenocarcinoma | Female | >=65 | I/II | Unknown | Unknown | SD | |
| IGLL5 | SNV | Missense_Mutation | novel | c.194N>A | p.Ser65Asn | p.S65N | B9A064 | protein_coding | tolerated_low_confidence(0.22) | benign(0.006) | TCGA-AZ-4315-01 | Colorectum | colon adenocarcinoma | Male | <65 | I/II | Unknown | Unknown | SD |
| IGLL5 | SNV | Missense_Mutation | novel | c.179G>A | p.Arg60Gln | p.R60Q | B9A064 | protein_coding | tolerated_low_confidence(0.39) | benign(0.003) | TCGA-AJ-A3EL-01 | Endometrium | uterine corpus endometrioid carcinoma | Female | <65 | I/II | Unknown | Unknown | SD |
| IGLL5 | SNV | Missense_Mutation | rs201375434 | c.548C>T | p.Thr183Met | p.T183M | B9A064 | protein_coding | tolerated_low_confidence(0.12) | possibly_damaging(0.624) | TCGA-AJ-A3OK-01 | Endometrium | uterine corpus endometrioid carcinoma | Female | >=65 | I/II | Chemotherapy | carboplatin | CR |
| Page: 1 2 3 |
Top |
Related drugs of malignant transformation related genes |
| Identification of chemicals and drugs interact with genes involved in malignant transfromation |
| (DGIdb 4.0) |
| Entrez ID | Symbol | Category | Interaction Types | Drug Claim Name | Drug Name | PMIDs |
| Page: 1 |

Copyright 2023-Present -The University of Texas Health Science Center at Houston |