
|
|||||
|
 | |
| |
| |
| |
| |
| |
|
Gene: IGLC1 |
Gene summary for IGLC1 |
| Gene information | Species | Human | Gene symbol | IGLC1 | Gene ID | 3537 |
| Gene name | immunoglobulin lambda constant 1 | |
| Gene Alias | IGLC | |
| Cytomap | 22q11.22 | |
| Gene Type | other | GO ID | GO:0001775 | UniProtAcc | NA |
Top |
Malignant transformation analysis |
| Identification of the aberrant gene expression in precancerous and cancerous lesions by comparing the gene expression of stem-like cells in diseased tissues with normal stem cells |
| Entrez ID | Symbol | Replicates | Species | Organ | Tissue | Adj P-value | Log2FC | Malignancy |
| 3537 | IGLC1 | Pat01-B | Human | Stomach | GC | 2.85e-30 | 5.68e-01 | 0.5754 |
| 3537 | IGLC1 | Pat02-B | Human | Stomach | GC | 5.32e-108 | 1.22e+00 | 0.0368 |
| 3537 | IGLC1 | Pat03-B | Human | Stomach | GC | 7.83e-16 | 3.44e-01 | 0.3693 |
| 3537 | IGLC1 | Pat04-B | Human | Stomach | GC | 3.38e-88 | 1.44e+00 | -0.1483 |
| 3537 | IGLC1 | Pat05-B | Human | Stomach | GC | 4.70e-36 | 7.84e-01 | -0.0353 |
| 3537 | IGLC1 | Pat06-B | Human | Stomach | GC | 4.46e-113 | 1.32e+00 | -0.1961 |
| 3537 | IGLC1 | Pat07-B | Human | Stomach | GC | 1.52e-15 | 5.63e-01 | 0.0935 |
| 3537 | IGLC1 | Pat08-B | Human | Stomach | GC | 9.13e-15 | 6.06e-01 | 0.0182 |
| 3537 | IGLC1 | Pat09-B | Human | Stomach | GC | 3.31e-20 | 5.06e-01 | -0.0359 |
| 3537 | IGLC1 | Pat10-B | Human | Stomach | GC | 5.83e-31 | 9.81e-01 | 0.084 |
| 3537 | IGLC1 | Pat11-B | Human | Stomach | GC | 2.15e-80 | 1.66e+00 | -0.182 |
| 3537 | IGLC1 | Pat12-B | Human | Stomach | GC | 4.34e-22 | 4.41e-01 | 0.0325 |
| 3537 | IGLC1 | Pat13-B | Human | Stomach | GC | 1.98e-28 | 6.52e-01 | 0.0555 |
| 3537 | IGLC1 | Pat16-B | Human | Stomach | GC | 2.61e-20 | 4.61e-01 | 0.1918 |
| 3537 | IGLC1 | Pat17-B | Human | Stomach | GC | 3.75e-22 | 5.16e-01 | 0.3109 |
| 3537 | IGLC1 | Pat18-B | Human | Stomach | GC | 6.77e-25 | 5.57e-01 | -0.0432 |
| 3537 | IGLC1 | Pat19-B | Human | Stomach | GC | 1.99e-45 | 8.32e-01 | 0.0826 |
| 3537 | IGLC1 | Pat22-B | Human | Stomach | GC | 3.26e-62 | 8.76e-01 | -0.1042 |
| 3537 | IGLC1 | Pat24-B | Human | Stomach | GC | 1.47e-81 | 1.46e+00 | -0.1184 |
| 3537 | IGLC1 | Pat25-A | Human | Stomach | CAG with IM | 8.58e-32 | 5.14e-01 | -0.1648 |
| Page: 1 2 |
| Tissue | Expression Dynamics | Abbreviation |
| GC | 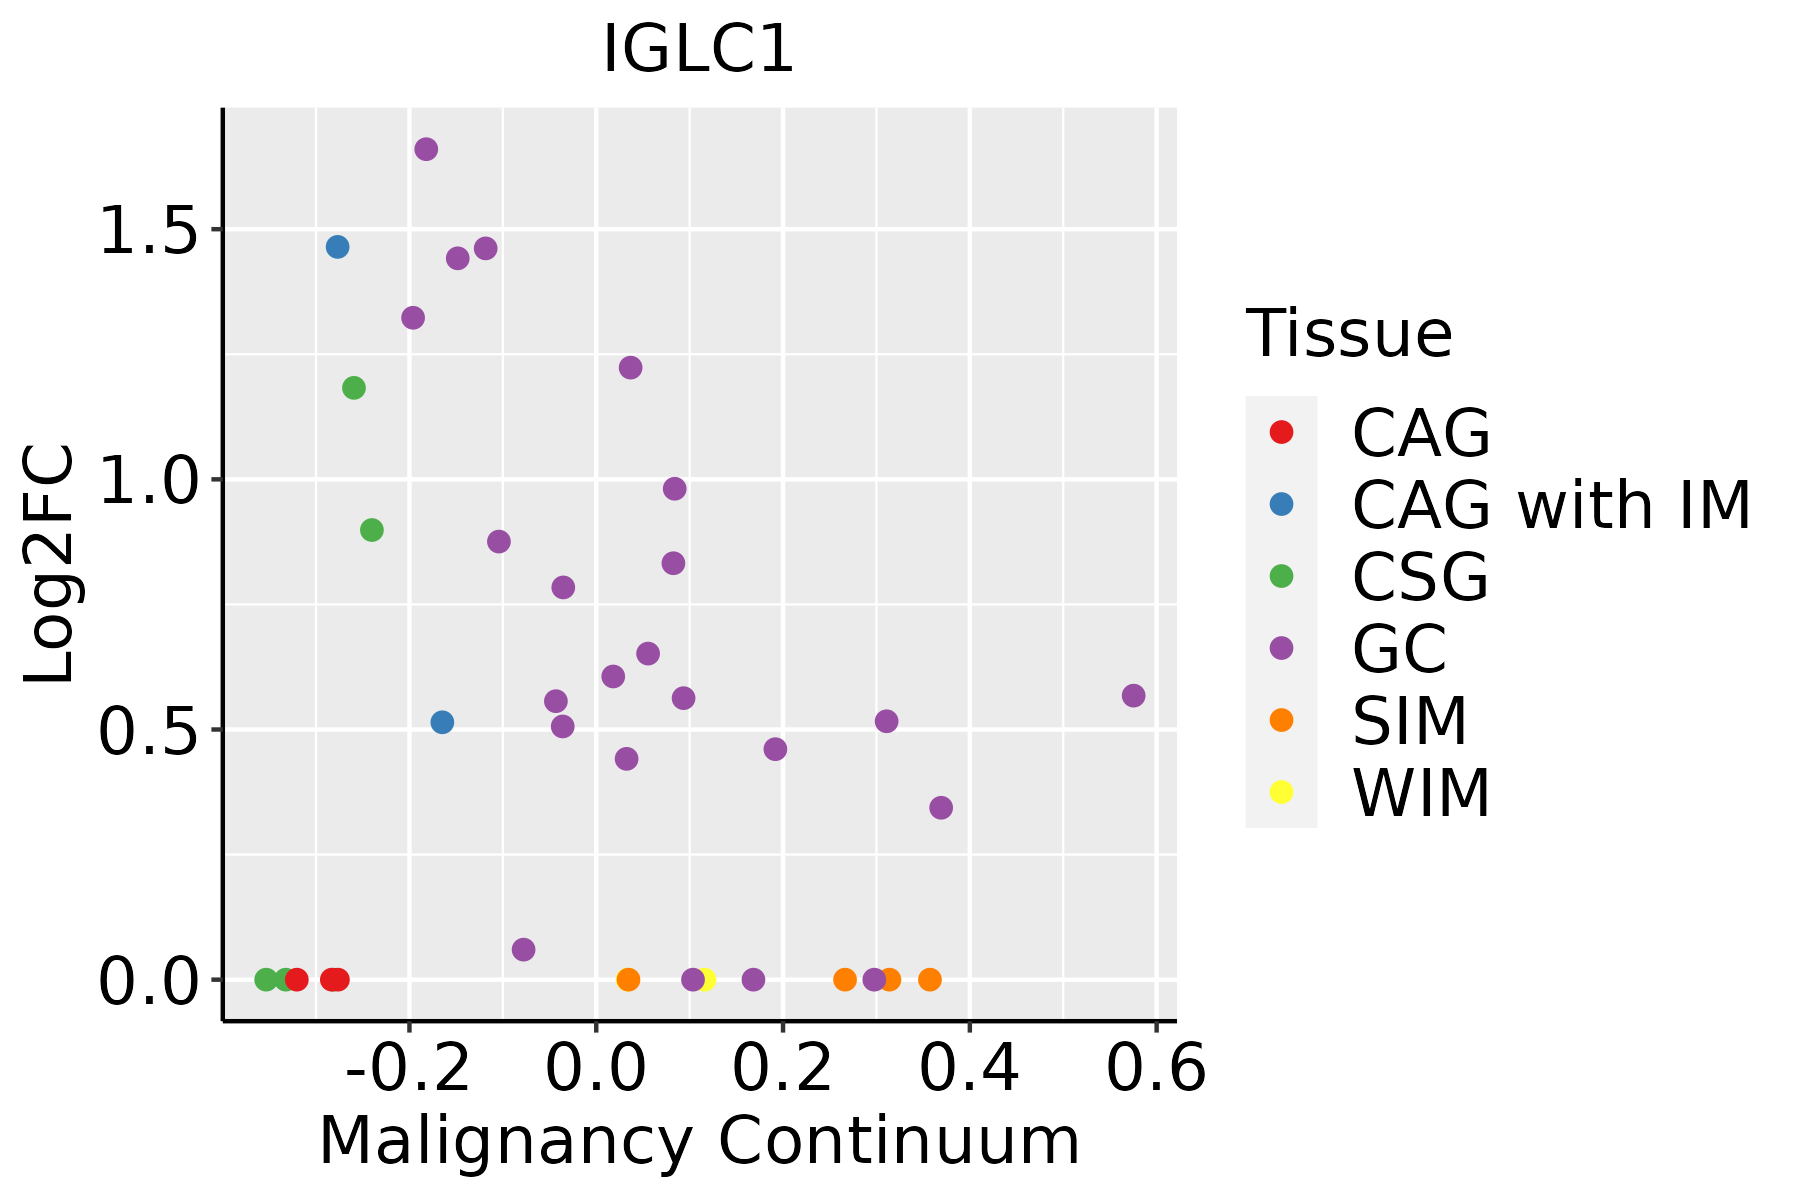 | CAG: Chronic atrophic gastritis |
| CAG with IM: Chronic atrophic gastritis with intestinal metaplasia | ||
| CSG: Chronic superficial gastritis | ||
| GC: Gastric cancer | ||
| SIM: Severe intestinal metaplasia | ||
| WIM: Wild intestinal metaplasia |
| ∗log2FC in expression of this searched gene in stem-like cells from each diseased tissue sample relative to stem-like cells in normal samples in each tissue plotted against the malignancy continuum. Samples are colored based on if they are from different disease stage. |
Top |
Malignant transformation related pathway analysis |
| Find out the enriched GO biological processes and KEGG pathways involved in transition from healthy to precancer to cancer |
| Tissue | Disease Stage | Enriched GO biological Processes |
| Colorectum | AD |  |
| Colorectum | SER |  |
| Colorectum | MSS |  |
| Colorectum | MSI-H |  |
| Colorectum | FAP |  |
| ∗Top 15 enriched GO BP terms are showed in the bar plot of each disease state in each tissue. Each row represents a significant GO biological process which is colored according to the -log10(p.adjust). |
| Page: 1 2 3 4 5 6 7 8 9 |
| GO ID | Tissue | Disease Stage | Description | Gene Ratio | Bg Ratio | pvalue | p.adjust | Count |
| GO:0006959 | Stomach | GC | humoral immune response | 42/1159 | 317/18723 | 2.59e-06 | 1.10e-04 | 42 |
| GO:0051251 | Stomach | GC | positive regulation of lymphocyte activation | 43/1159 | 362/18723 | 3.12e-05 | 8.51e-04 | 43 |
| GO:0002696 | Stomach | GC | positive regulation of leukocyte activation | 46/1159 | 409/18723 | 6.50e-05 | 1.46e-03 | 46 |
| GO:0050867 | Stomach | GC | positive regulation of cell activation | 46/1159 | 420/18723 | 1.22e-04 | 2.33e-03 | 46 |
| GO:0016064 | Stomach | GC | immunoglobulin mediated immune response | 26/1159 | 207/18723 | 4.66e-04 | 6.83e-03 | 26 |
| GO:0019724 | Stomach | GC | B cell mediated immunity | 26/1159 | 210/18723 | 5.82e-04 | 7.99e-03 | 26 |
| GO:0042742 | Stomach | GC | defense response to bacterium | 37/1159 | 350/18723 | 1.05e-03 | 1.23e-02 | 37 |
| GO:0002764 | Stomach | GC | immune response-regulating signaling pathway | 46/1159 | 468/18723 | 1.31e-03 | 1.46e-02 | 46 |
| GO:0010324 | Stomach | GC | membrane invagination | 19/1159 | 144/18723 | 1.44e-03 | 1.57e-02 | 19 |
| GO:0050851 | Stomach | GC | antigen receptor-mediated signaling pathway | 27/1159 | 240/18723 | 1.96e-03 | 2.00e-02 | 27 |
| GO:0099024 | Stomach | GC | plasma membrane invagination | 17/1159 | 136/18723 | 4.41e-03 | 3.60e-02 | 17 |
| GO:0002460 | Stomach | GC | adaptive immune response based on somatic recombination of immune receptors built from immunoglobulin superfamily domains | 35/1159 | 356/18723 | 4.64e-03 | 3.76e-02 | 35 |
| GO:0006911 | Stomach | GC | phagocytosis, engulfment | 16/1159 | 127/18723 | 5.22e-03 | 4.11e-02 | 16 |
| GO:0002253 | Stomach | GC | activation of immune response | 36/1159 | 375/18723 | 6.03e-03 | 4.55e-02 | 36 |
| GO:0002449 | Stomach | GC | lymphocyte mediated immunity | 34/1159 | 350/18723 | 6.25e-03 | 4.69e-02 | 34 |
| GO:0006956 | Stomach | GC | complement activation | 16/1159 | 130/18723 | 6.54e-03 | 4.83e-02 | 16 |
| GO:0006958 | Stomach | GC | complement activation, classical pathway | 14/1159 | 108/18723 | 6.75e-03 | 4.90e-02 | 14 |
| GO:00069591 | Stomach | CAG with IM | humoral immune response | 39/1050 | 317/18723 | 3.43e-06 | 1.36e-04 | 39 |
| GO:00512511 | Stomach | CAG with IM | positive regulation of lymphocyte activation | 39/1050 | 362/18723 | 7.28e-05 | 1.75e-03 | 39 |
| GO:00026961 | Stomach | CAG with IM | positive regulation of leukocyte activation | 42/1050 | 409/18723 | 1.16e-04 | 2.50e-03 | 42 |
| Page: 1 2 3 |
| Pathway ID | Tissue | Disease Stage | Description | Gene Ratio | Bg Ratio | pvalue | p.adjust | qvalue | Count |
| Page: 1 |
Top |
Cell-cell communication analysis |
| Identification of potential cell-cell interactions between two cell types and their ligand-receptor pairs for different disease states |
| Ligand | Receptor | LRpair | Pathway | Tissue | Disease Stage |
| Page: 1 |
Top |
Single-cell gene regulatory network inference analysis |
| Find out the significant the regulons (TFs) and the target genes of each regulon across cell types for different disease states |
| TF | Cell Type | Tissue | Disease Stage | Target Gene | RSS | Regulon Activity |
| ∗The dot plots of a searched regulon are shown for all cell subpopulations in each disease state of each tissue based on the regulon specific score inferred using pySCENIC and by calculating the average expression. |
| Page: 1 |
Top |
Somatic mutation of malignant transformation related genes |
| Annotation of somatic variants for genes involved in malignant transformation |
| Hugo Symbol | Variant Class | Variant Classification | dbSNP RS | HGVSc | HGVSp | HGVSp Short | SWISSPROT | BIOTYPE | SIFT | PolyPhen | Tumor Sample Barcode | Tissue | Histology | Sex | Age | Stage | Therapy Types | Drugs | Outcome |
| Page: 1 |
Top |
Related drugs of malignant transformation related genes |
| Identification of chemicals and drugs interact with genes involved in malignant transfromation |
| (DGIdb 4.0) |
| Entrez ID | Symbol | Category | Interaction Types | Drug Claim Name | Drug Name | PMIDs |
| Page: 1 |

Copyright 2023-Present -The University of Texas Health Science Center at Houston |