
|
|||||
|
 | |
| |
| |
| |
| |
| |
|
Gene: IGKC |
Gene summary for IGKC |
| Gene information | Species | Human | Gene symbol | IGKC | Gene ID | 3514 |
| Gene name | immunoglobulin kappa constant | |
| Gene Alias | HCAK1 | |
| Cytomap | 2p11.2 | |
| Gene Type | other | GO ID | GO:0001775 | UniProtAcc | NA |
Top |
Malignant transformation analysis |
| Identification of the aberrant gene expression in precancerous and cancerous lesions by comparing the gene expression of stem-like cells in diseased tissues with normal stem cells |
| Entrez ID | Symbol | Replicates | Species | Organ | Tissue | Adj P-value | Log2FC | Malignancy |
| 3514 | IGKC | GSM4909281 | Human | Breast | IDC | 3.56e-16 | 3.07e-01 | 0.21 |
| 3514 | IGKC | GSM4909282 | Human | Breast | IDC | 2.96e-13 | 3.01e-01 | -0.0288 |
| 3514 | IGKC | GSM4909287 | Human | Breast | IDC | 2.36e-16 | 4.32e-01 | 0.2057 |
| 3514 | IGKC | GSM4909288 | Human | Breast | IDC | 4.62e-29 | 1.26e+00 | 0.0988 |
| 3514 | IGKC | GSM4909290 | Human | Breast | IDC | 1.79e-96 | 1.51e+00 | 0.2096 |
| 3514 | IGKC | GSM4909291 | Human | Breast | IDC | 2.17e-52 | 1.06e+00 | 0.1753 |
| 3514 | IGKC | GSM4909294 | Human | Breast | IDC | 5.86e-13 | 4.34e-01 | 0.2022 |
| 3514 | IGKC | GSM4909298 | Human | Breast | IDC | 3.71e-07 | 2.15e-01 | 0.1551 |
| 3514 | IGKC | GSM4909300 | Human | Breast | IDC | 1.98e-18 | 6.56e-01 | 0.0334 |
| 3514 | IGKC | GSM4909305 | Human | Breast | IDC | 6.69e-08 | 2.92e-01 | 0.0436 |
| 3514 | IGKC | GSM4909306 | Human | Breast | IDC | 4.57e-03 | 1.28e-01 | 0.1564 |
| 3514 | IGKC | GSM4909308 | Human | Breast | IDC | 1.93e-14 | 3.68e-01 | 0.158 |
| 3514 | IGKC | GSM4909309 | Human | Breast | IDC | 4.14e-21 | 6.05e-01 | 0.0483 |
| 3514 | IGKC | GSM4909316 | Human | Breast | IDC | 4.36e-02 | 3.99e-01 | 0.21 |
| 3514 | IGKC | GSM4909317 | Human | Breast | IDC | 8.19e-72 | 1.06e+00 | 0.1355 |
| 3514 | IGKC | GSM4909318 | Human | Breast | IDC | 2.65e-03 | 5.27e-01 | 0.2031 |
| 3514 | IGKC | M1 | Human | Breast | IDC | 5.99e-76 | 1.34e+00 | 0.1577 |
| 3514 | IGKC | NCCBC5 | Human | Breast | DCIS | 1.25e-12 | 6.25e-01 | 0.2046 |
| 3514 | IGKC | P3 | Human | Breast | IDC | 3.72e-06 | 4.98e-01 | 0.1542 |
| 3514 | IGKC | DCIS2 | Human | Breast | DCIS | 3.32e-17 | 8.50e-02 | 0.0085 |
| Page: 1 2 3 4 5 6 7 8 9 10 |
| Tissue | Expression Dynamics | Abbreviation |
| Breast | 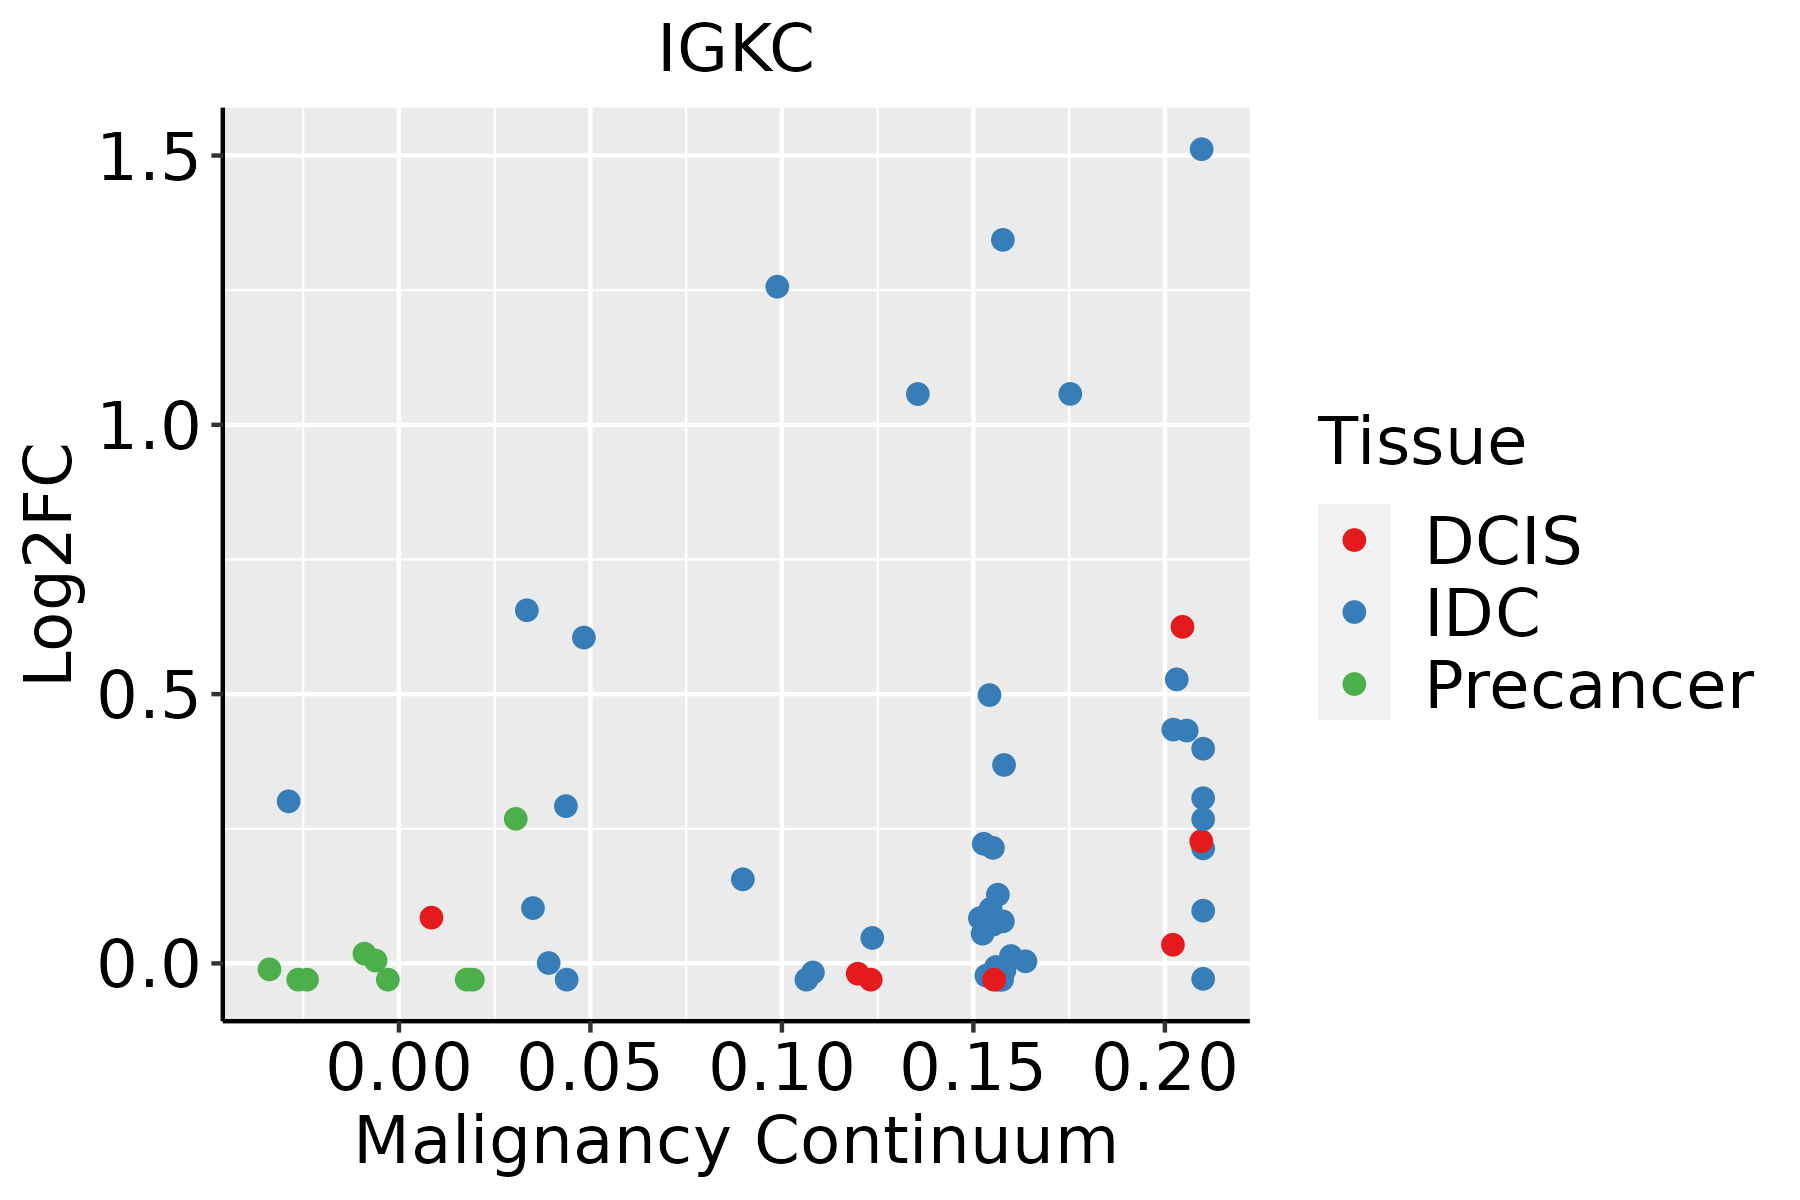 | IDC: Invasive ductal carcinoma |
| DCIS: Ductal carcinoma in situ | ||
| Precancer(BRCA1-mut): Precancerous lesion from BRCA1 mutation carriers | ||
| Cervix |  | CC: Cervix cancer |
| HSIL_HPV: HPV-infected high-grade squamous intraepithelial lesions | ||
| N_HPV: HPV-infected normal cervix | ||
| Colorectum (GSE201348) |  | FAP: Familial adenomatous polyposis |
| CRC: Colorectal cancer | ||
| Colorectum (HTA11) | 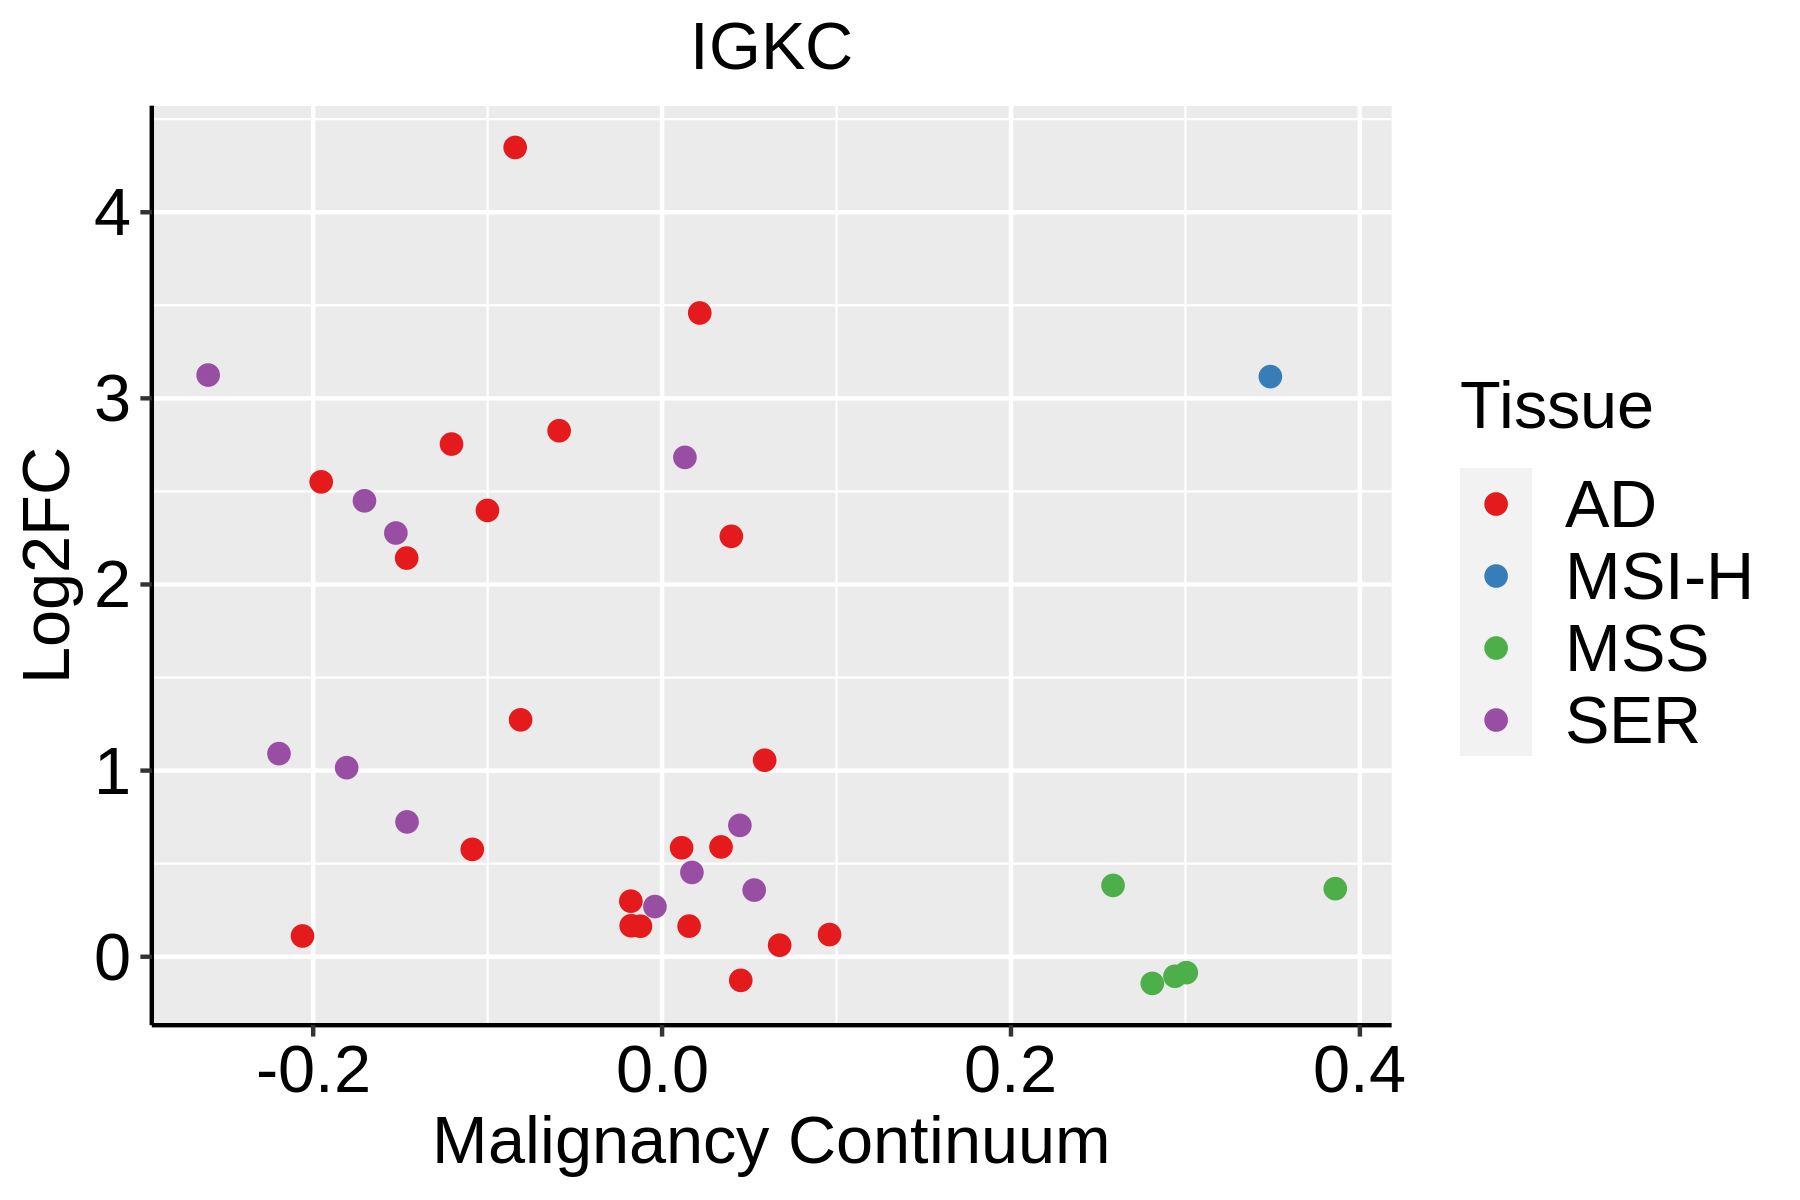 | AD: Adenomas |
| SER: Sessile serrated lesions | ||
| MSI-H: Microsatellite-high colorectal cancer | ||
| MSS: Microsatellite stable colorectal cancer | ||
| Endometrium |  | AEH: Atypical endometrial hyperplasia |
| EEC: Endometrioid Cancer | ||
| GC | 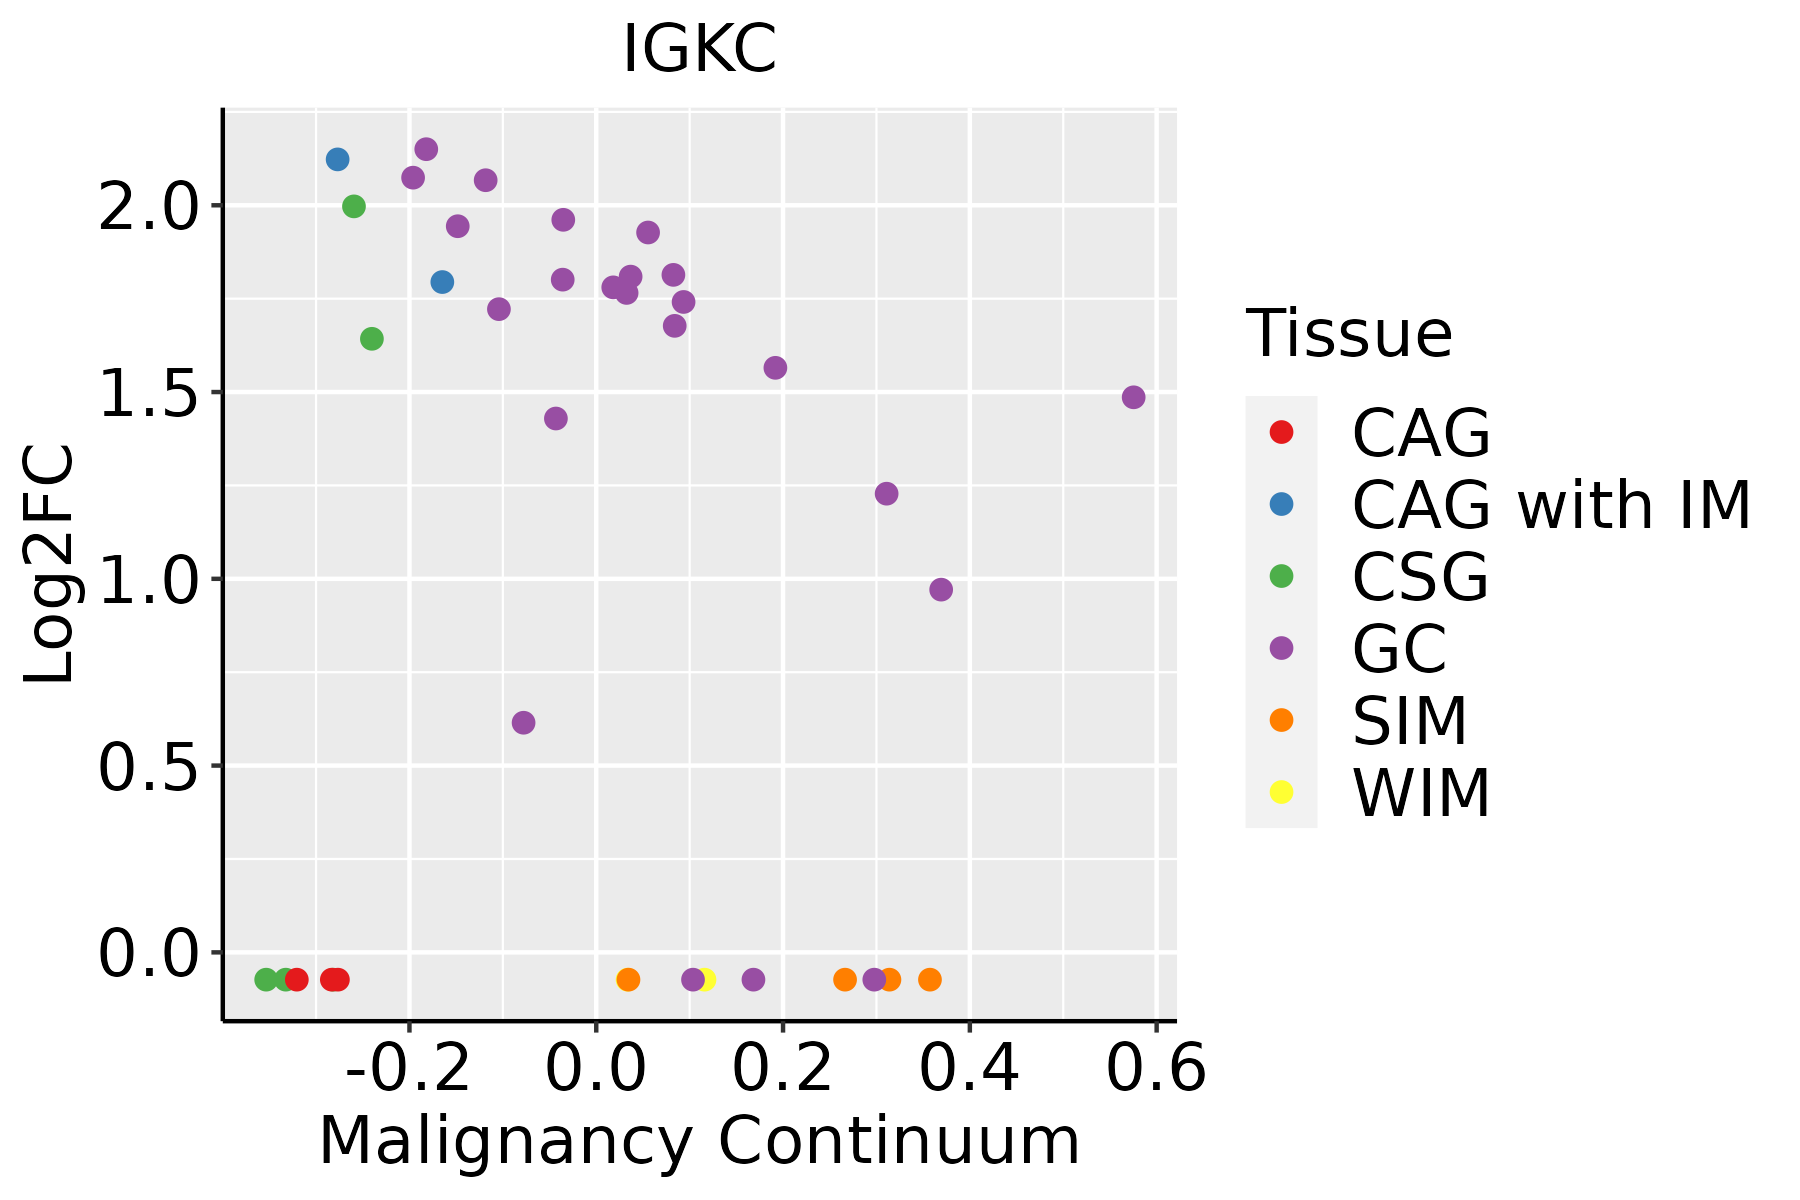 | CAG: Chronic atrophic gastritis |
| CAG with IM: Chronic atrophic gastritis with intestinal metaplasia | ||
| CSG: Chronic superficial gastritis | ||
| GC: Gastric cancer | ||
| SIM: Severe intestinal metaplasia | ||
| WIM: Wild intestinal metaplasia | ||
| Liver | 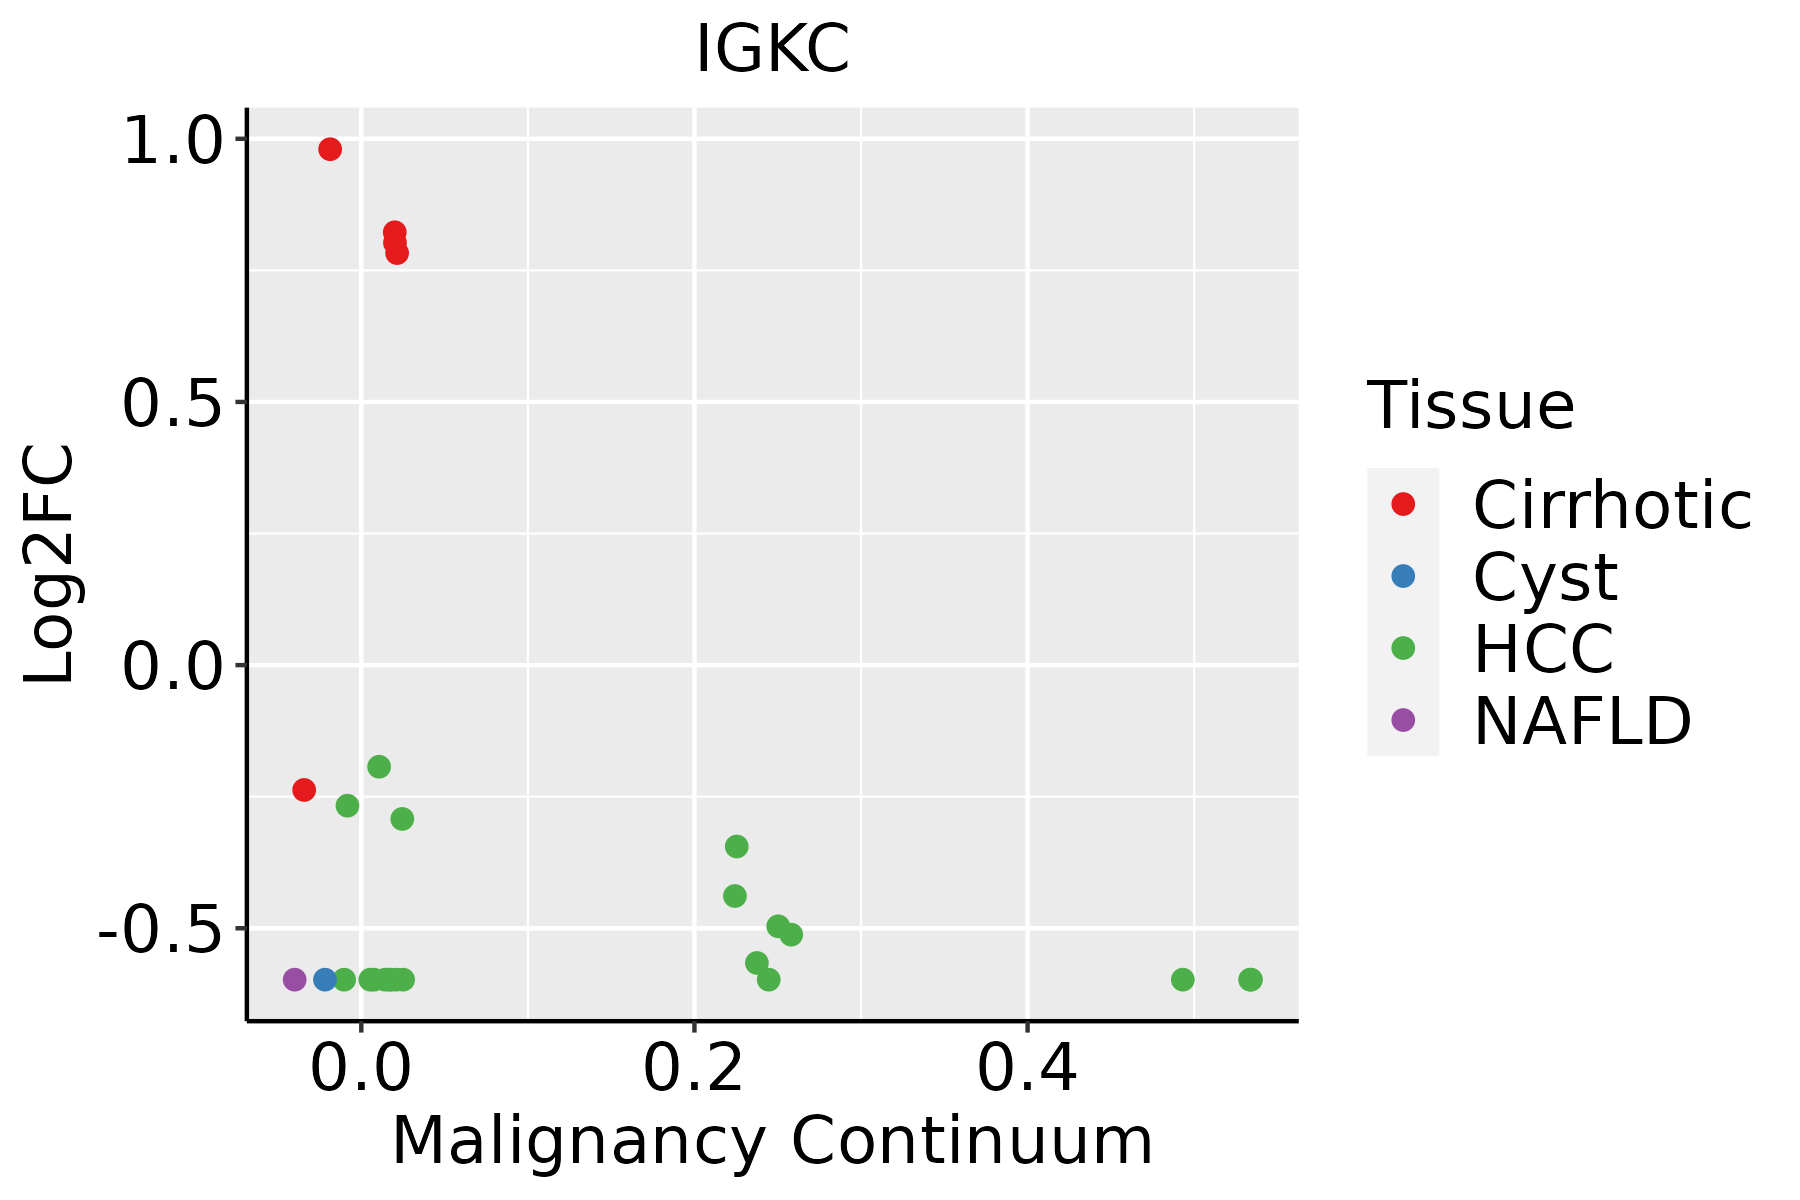 | HCC: Hepatocellular carcinoma |
| NAFLD: Non-alcoholic fatty liver disease | ||
| Lung |  | AAH: Atypical adenomatous hyperplasia |
| AIS: Adenocarcinoma in situ | ||
| IAC: Invasive lung adenocarcinoma | ||
| MIA: Minimally invasive adenocarcinoma | ||
| Oral Cavity | 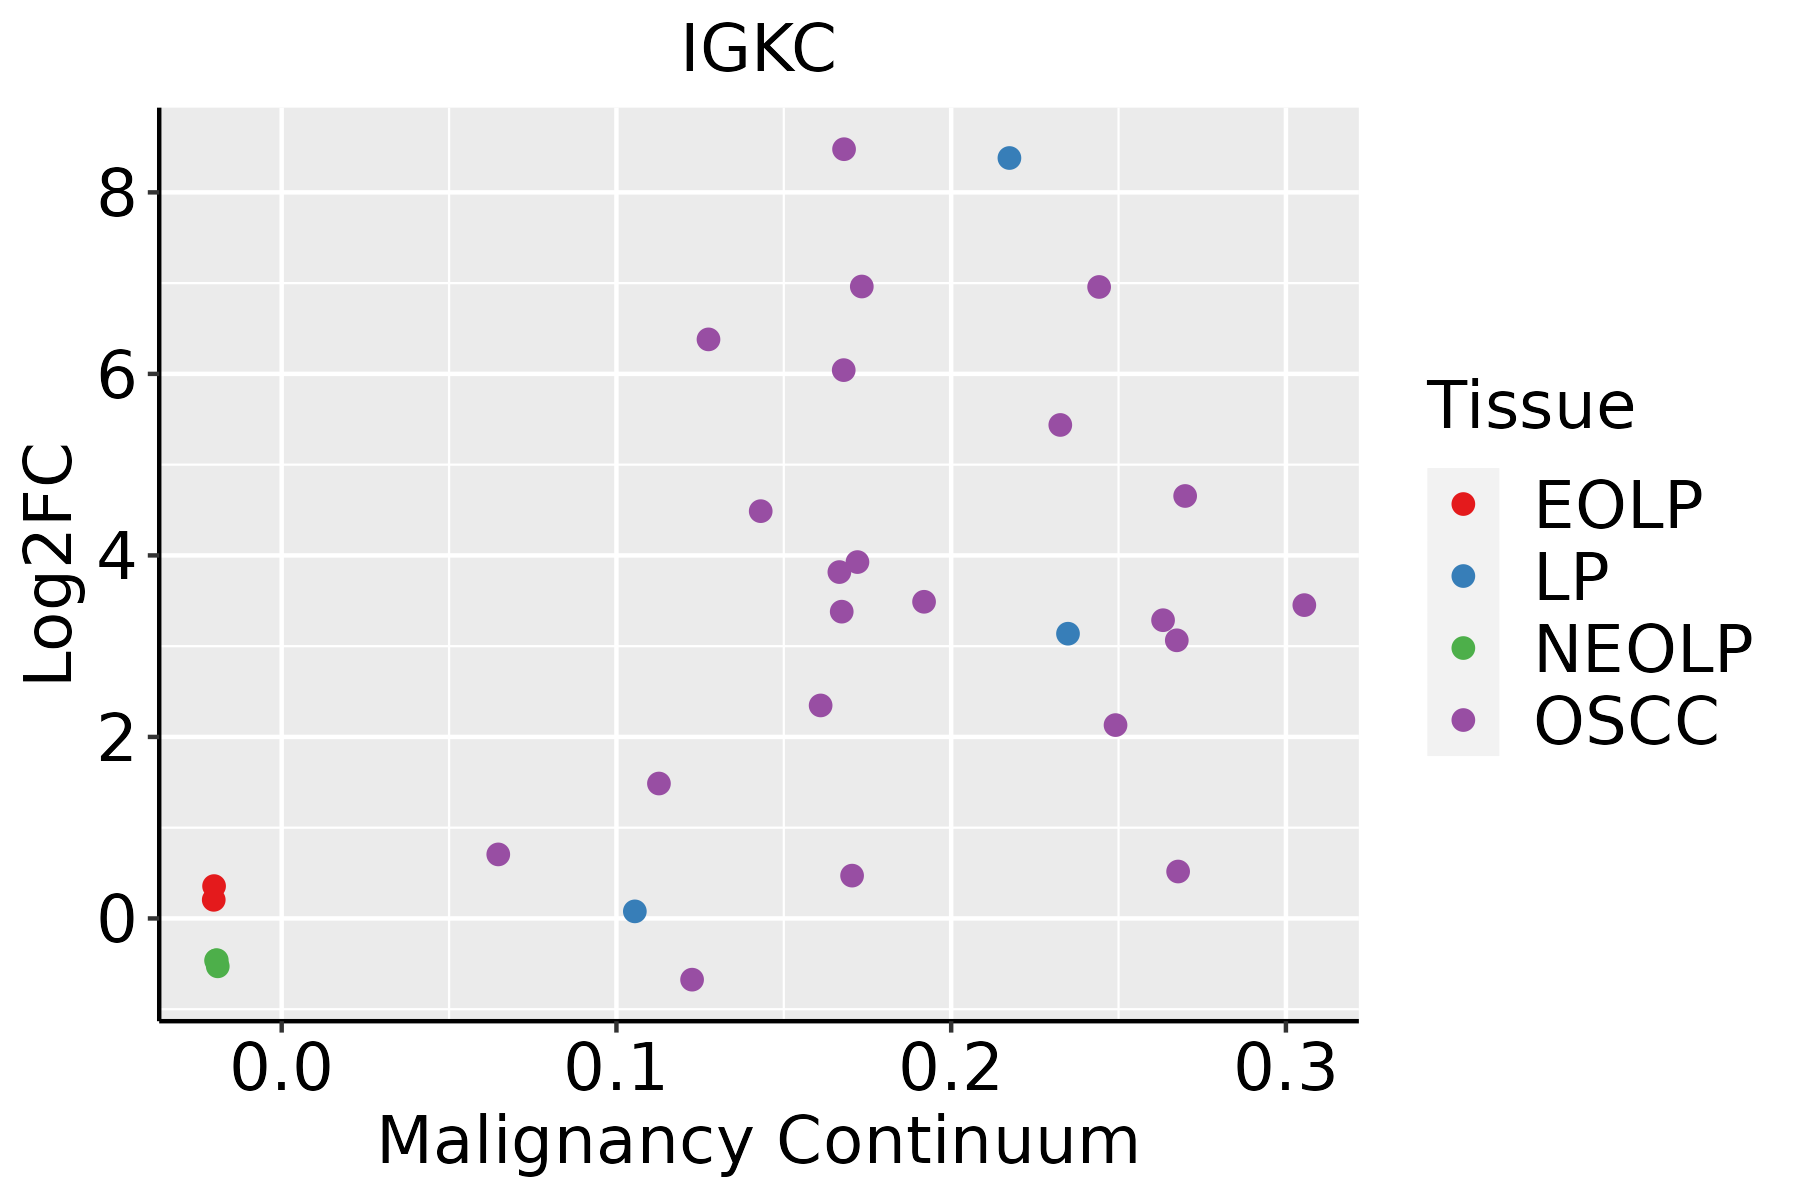 | EOLP: Erosive Oral lichen planus |
| LP: leukoplakia | ||
| NEOLP: Non-erosive oral lichen planus | ||
| OSCC: Oral squamous cell carcinoma | ||
| Prostate | 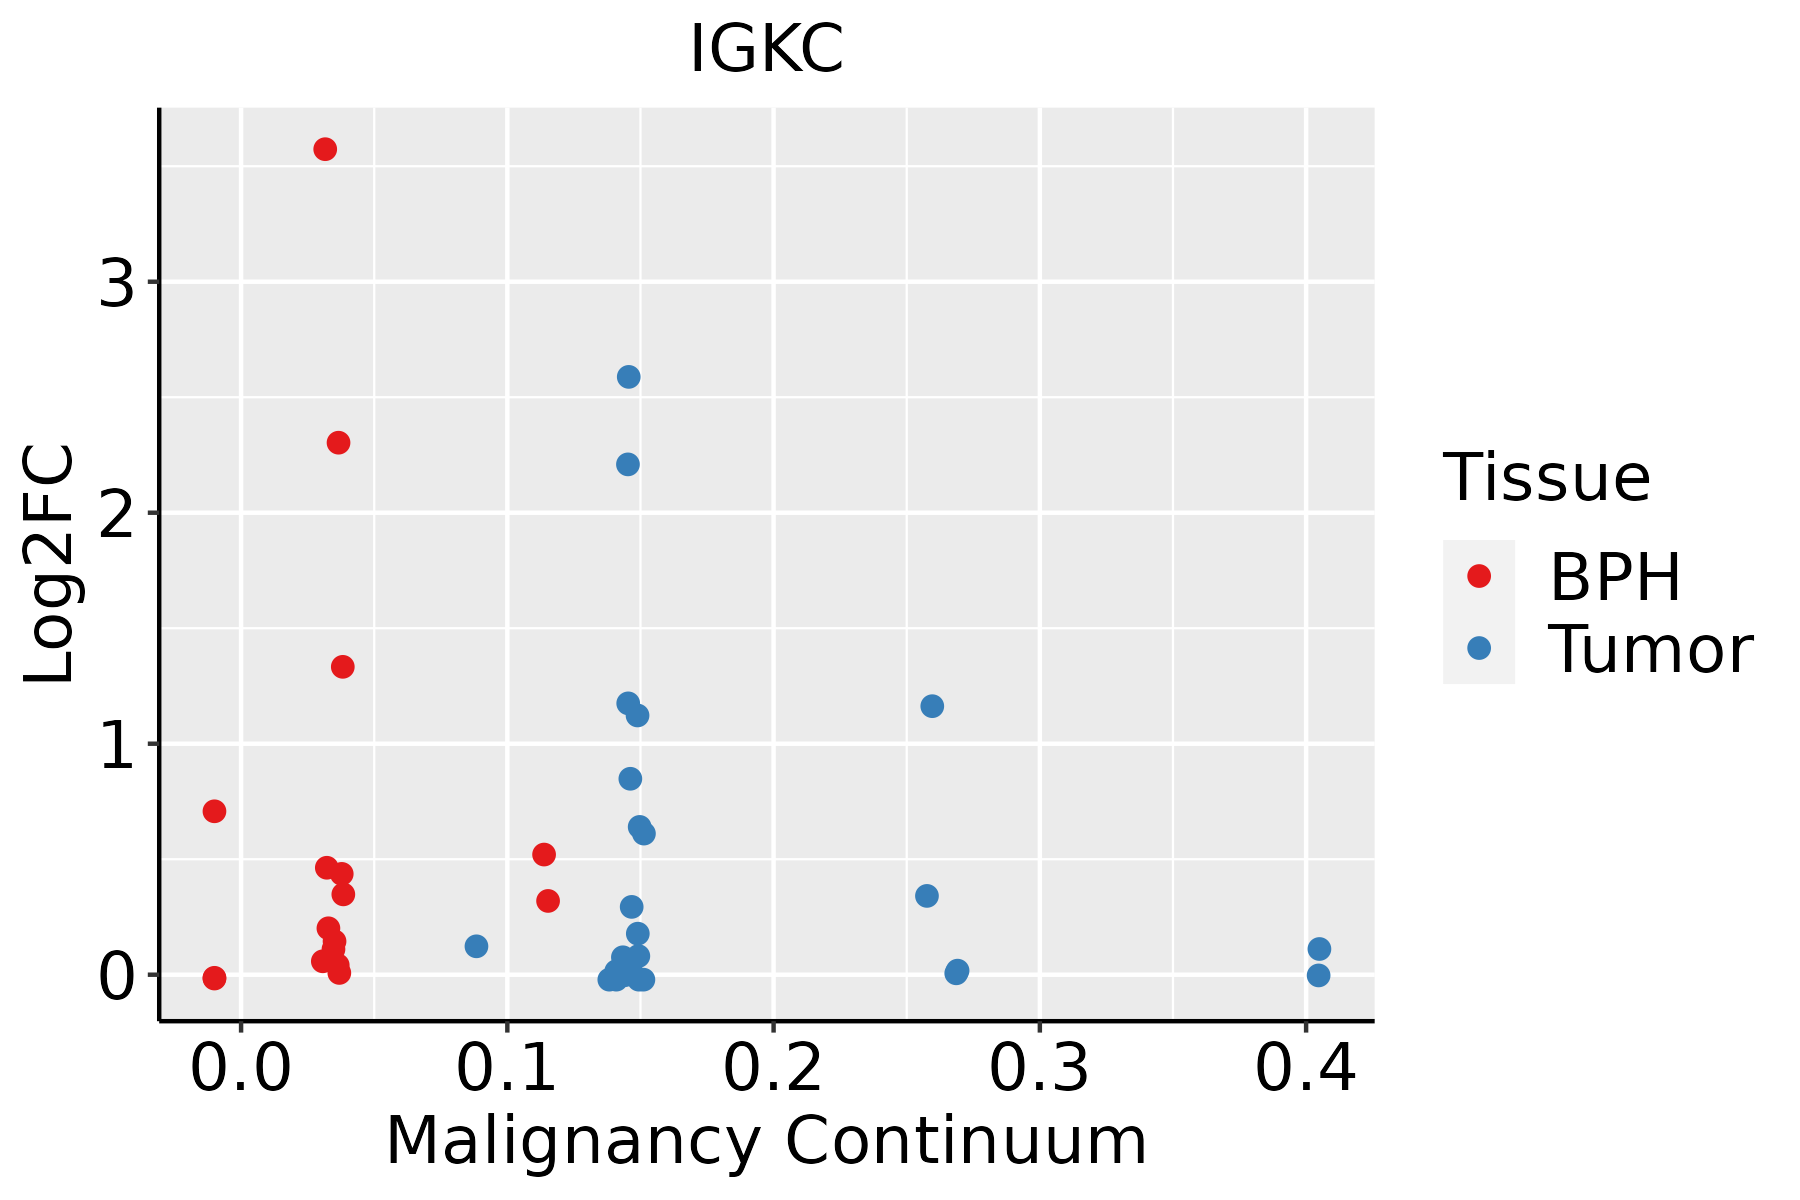 | BPH: Benign Prostatic Hyperplasia |
| Thyroid |  | ATC: Anaplastic thyroid cancer |
| HT: Hashimoto's thyroiditis | ||
| PTC: Papillary thyroid cancer |
| ∗log2FC in expression of this searched gene in stem-like cells from each diseased tissue sample relative to stem-like cells in normal samples in each tissue plotted against the malignancy continuum. Samples are colored based on if they are from different disease stage. |
Top |
Malignant transformation related pathway analysis |
| Find out the enriched GO biological processes and KEGG pathways involved in transition from healthy to precancer to cancer |
| Tissue | Disease Stage | Enriched GO biological Processes |
| Colorectum | AD |  |
| Colorectum | SER |  |
| Colorectum | MSS |  |
| Colorectum | MSI-H |  |
| Colorectum | FAP |  |
| ∗Top 15 enriched GO BP terms are showed in the bar plot of each disease state in each tissue. Each row represents a significant GO biological process which is colored according to the -log10(p.adjust). |
| Page: 1 2 3 4 5 6 7 8 9 |
| GO ID | Tissue | Disease Stage | Description | Gene Ratio | Bg Ratio | pvalue | p.adjust | Count |
| GO:000189511 | Breast | IDC | retina homeostasis | 15/1434 | 79/18723 | 8.62e-04 | 1.00e-02 | 15 |
| GO:00069596 | Breast | IDC | humoral immune response | 40/1434 | 317/18723 | 1.25e-03 | 1.33e-02 | 40 |
| GO:000189413 | Breast | IDC | tissue homeostasis | 34/1434 | 268/18723 | 2.54e-03 | 2.28e-02 | 34 |
| GO:00512515 | Breast | IDC | positive regulation of lymphocyte activation | 43/1434 | 362/18723 | 2.72e-03 | 2.41e-02 | 43 |
| GO:00022532 | Breast | IDC | activation of immune response | 43/1434 | 375/18723 | 5.16e-03 | 3.84e-02 | 43 |
| GO:00026966 | Breast | IDC | positive regulation of leukocyte activation | 46/1434 | 409/18723 | 5.60e-03 | 4.07e-02 | 46 |
| GO:000189521 | Breast | DCIS | retina homeostasis | 14/1390 | 79/18723 | 1.88e-03 | 1.81e-02 | 14 |
| GO:005125111 | Breast | DCIS | positive regulation of lymphocyte activation | 42/1390 | 362/18723 | 2.65e-03 | 2.35e-02 | 42 |
| GO:000189423 | Breast | DCIS | tissue homeostasis | 33/1390 | 268/18723 | 2.88e-03 | 2.48e-02 | 33 |
| GO:000225311 | Breast | DCIS | activation of immune response | 43/1390 | 375/18723 | 2.96e-03 | 2.54e-02 | 43 |
| GO:000695911 | Breast | DCIS | humoral immune response | 37/1390 | 317/18723 | 4.16e-03 | 3.29e-02 | 37 |
| GO:00027644 | Cervix | CC | immune response-regulating signaling pathway | 97/2311 | 468/18723 | 1.49e-07 | 7.07e-06 | 97 |
| GO:00018949 | Cervix | CC | tissue homeostasis | 57/2311 | 268/18723 | 2.43e-05 | 4.21e-04 | 57 |
| GO:00602498 | Cervix | CC | anatomical structure homeostasis | 63/2311 | 314/18723 | 6.03e-05 | 8.68e-04 | 63 |
| GO:00022533 | Cervix | CC | activation of immune response | 72/2311 | 375/18723 | 8.26e-05 | 1.11e-03 | 72 |
| GO:0002768 | Cervix | CC | immune response-regulating cell surface receptor signaling pathway | 59/2311 | 315/18723 | 6.64e-04 | 6.11e-03 | 59 |
| GO:00026967 | Cervix | CC | positive regulation of leukocyte activation | 72/2311 | 409/18723 | 1.13e-03 | 9.31e-03 | 72 |
| GO:00512516 | Cervix | CC | positive regulation of lymphocyte activation | 65/2311 | 362/18723 | 1.15e-03 | 9.39e-03 | 65 |
| GO:00508676 | Cervix | CC | positive regulation of cell activation | 73/2311 | 420/18723 | 1.50e-03 | 1.16e-02 | 73 |
| GO:00018957 | Cervix | CC | retina homeostasis | 19/2311 | 79/18723 | 2.94e-03 | 1.94e-02 | 19 |
| Page: 1 2 3 4 5 6 7 8 9 10 11 |
| Pathway ID | Tissue | Disease Stage | Description | Gene Ratio | Bg Ratio | pvalue | p.adjust | qvalue | Count |
| Page: 1 |
Top |
Cell-cell communication analysis |
| Identification of potential cell-cell interactions between two cell types and their ligand-receptor pairs for different disease states |
| Ligand | Receptor | LRpair | Pathway | Tissue | Disease Stage |
| Page: 1 |
Top |
Single-cell gene regulatory network inference analysis |
| Find out the significant the regulons (TFs) and the target genes of each regulon across cell types for different disease states |
| TF | Cell Type | Tissue | Disease Stage | Target Gene | RSS | Regulon Activity |
| ∗The dot plots of a searched regulon are shown for all cell subpopulations in each disease state of each tissue based on the regulon specific score inferred using pySCENIC and by calculating the average expression. |
| Page: 1 |
Top |
Somatic mutation of malignant transformation related genes |
| Annotation of somatic variants for genes involved in malignant transformation |
| Hugo Symbol | Variant Class | Variant Classification | dbSNP RS | HGVSc | HGVSp | HGVSp Short | SWISSPROT | BIOTYPE | SIFT | PolyPhen | Tumor Sample Barcode | Tissue | Histology | Sex | Age | Stage | Therapy Types | Drugs | Outcome |
| IGKC | SNV | Missense_Mutation | novel | c.63A>C | p.Thr22Pro | p.T22P | IG_C_gene | tolerated(0.15) | possibly_damaging(0.73) | TCGA-2W-A8YY-01 | Cervix | cervical & endocervical cancer | Female | <65 | I/II | Chemotherapy | cisplatin | CR | |
| IGKC | SNV | Missense_Mutation | novel | c.161N>C | p.Glu54Asp | p.E54D | IG_C_gene | tolerated(0.36) | benign(0) | TCGA-EK-A3GJ-01 | Cervix | cervical & endocervical cancer | Female | <65 | I/II | Unknown | Unknown | SD | |
| IGKC | SNV | Missense_Mutation | novel | c.90N>G | p.Asn31Asp | p.N31D | IG_C_gene | tolerated(0.57) | benign(0.007) | TCGA-AG-A002-01 | Colorectum | rectum adenocarcinoma | Male | <65 | I/II | Unknown | Unknown | SD | |
| IGKC | SNV | Missense_Mutation | novel | c.154N>A | p.Ser52Tyr | p.S52Y | IG_C_gene | deleterious(0) | benign(0.065) | TCGA-AP-A1DV-01 | Endometrium | uterine corpus endometrioid carcinoma | Female | <65 | I/II | Unknown | Unknown | SD | |
| IGKC | SNV | Missense_Mutation | rs373698975 | c.145N>T | p.Ser49Leu | p.S49L | IG_C_gene | deleterious(0.05) | benign(0.418) | TCGA-B5-A0JY-01 | Endometrium | uterine corpus endometrioid carcinoma | Female | <65 | III/IV | Chemotherapy | doxorubicin | SD | |
| IGKC | SNV | Missense_Mutation | novel | c.58N>A | p.Ser20Tyr | p.S20Y | IG_C_gene | deleterious(0) | probably_damaging(0.938) | TCGA-B5-A0JY-01 | Endometrium | uterine corpus endometrioid carcinoma | Female | <65 | III/IV | Chemotherapy | doxorubicin | SD | |
| IGKC | SNV | Missense_Mutation | novel | c.141C>A | p.Gln48Lys | p.Q48K | IG_C_gene | tolerated(0.65) | benign(0.013) | TCGA-86-6851-01 | Lung | lung adenocarcinoma | Female | >=65 | I/II | Unknown | Unknown | SD | |
| IGKC | SNV | Missense_Mutation | novel | c.61N>A | p.Gly21Glu | p.G21E | IG_C_gene | deleterious(0.05) | possibly_damaging(0.777) | TCGA-NJ-A4YG-01 | Lung | lung adenocarcinoma | Male | >=65 | I/II | Unknown | Unknown | SD | |
| IGKC | SNV | Missense_Mutation | novel | c.217N>A | p.Thr73Lys | p.T73K | IG_C_gene | deleterious(0) | possibly_damaging(0.893) | TCGA-39-5016-01 | Lung | lung squamous cell carcinoma | Male | <65 | I/II | Unknown | Unknown | SD | |
| IGKC | SNV | Missense_Mutation | novel | c.274N>G | p.Gln92Arg | p.Q92R | IG_C_gene | tolerated(0.06) | benign(0.03) | TCGA-63-A5MI-01 | Lung | lung squamous cell carcinoma | Male | >=65 | III/IV | Chemotherapy | vinorelbine | SD |
| Page: 1 2 |
Top |
Related drugs of malignant transformation related genes |
| Identification of chemicals and drugs interact with genes involved in malignant transfromation |
| (DGIdb 4.0) |
| Entrez ID | Symbol | Category | Interaction Types | Drug Claim Name | Drug Name | PMIDs |
| Page: 1 |

Copyright 2023-Present -The University of Texas Health Science Center at Houston |