Schematic overview of the cellular and molecular mechanisms involved in the cancer progression, including the proposed cellular and molecular mechanisms in cancer cells trajectory. AT1: alveolar type 1 cells; AT2: alveolar type 2 cells; AAH: atypical adenomatous hyperplasia; AIS: adenocarcinoma in situ; MIA: minimally invasive adenocarcinoma; IA: invasive adenocarcinoma; EMT: epithelial-mesenchymal transition

Home

Download

Statistics

Help

Contact

Center for Computational Systems Medicine
leaf

Gene summary

leaf

Malignant transformation analysis

leaf

Malignant transformation related pathway analysis

leaf

Cell-cell communication analysis

leaf

Single-cell gene regulatory network inference analysis

leaf

Somatic mutation of malignant transformation related genes

leaf

Related drugs of malignant transformation related genes

Gene: IGHM

Gene summary for IGHM

check button Gene summary.

Gene informationSpeciesHuman
Gene symbol

IGHM

Gene ID

3507

Gene nameimmunoglobulin heavy constant mu
Gene AliasAGM1
Cytomap14q32.33
Gene Typeother
GO ID

GO:0001775

UniProtAcc

NA


Top

Malignant transformation analysis

check button Identification of the aberrant gene expression in precancerous and cancerous lesions by comparing the gene expression of stem-like cells in diseased tissues with normal stem cells
check button Malignant transformation involving gene list.
Entrez IDSymbolReplicatesSpeciesOrganTissueAdj P-valueLog2FCMalignancy
3507IGHMGSM4909290HumanBreastIDC4.37e-528.48e-010.2096
3507IGHMGSM4909317HumanBreastIDC5.65e-051.64e-010.1355
3507IGHMM1HumanBreastIDC7.45e-236.18e-010.1577
3507IGHMP4T-EHumanEsophagusESCC3.03e-101.08e-010.1323
3507IGHMP5T-EHumanEsophagusESCC1.07e-083.52e-020.1327
3507IGHMP10T-EHumanEsophagusESCC7.83e-13-1.02e-020.116
3507IGHMP20T-EHumanEsophagusESCC3.01e-111.70e-010.1124
3507IGHMP26T-EHumanEsophagusESCC6.14e-377.21e-010.1276
3507IGHMP28T-EHumanEsophagusESCC1.14e-243.85e-010.1149
3507IGHMP31T-EHumanEsophagusESCC1.45e-093.37e-020.1251
3507IGHMP32T-EHumanEsophagusESCC3.32e-191.97e-010.1666
3507IGHMP37T-EHumanEsophagusESCC1.41e-204.16e-010.1371
3507IGHMP39T-EHumanEsophagusESCC6.38e-123.84e-020.0894
3507IGHMP42T-EHumanEsophagusESCC9.41e-192.44e-010.1175
3507IGHMP44T-EHumanEsophagusESCC5.02e-048.53e-020.1096
3507IGHMP47T-EHumanEsophagusESCC1.05e-15-9.57e-020.1067
3507IGHMP52T-EHumanEsophagusESCC1.26e-093.28e-020.1555
3507IGHMP54T-EHumanEsophagusESCC4.05e-06-2.76e-020.0975
3507IGHMP62T-EHumanEsophagusESCC1.43e-126.25e-020.1302
3507IGHMP74T-EHumanEsophagusESCC1.64e-021.14e-010.1479
Page: 1 2 3 4 

check button Transcriptomic changes along malignancy continuum.
TissueExpression DynamicsAbbreviation
BreastThe image shows the transcriptomic changes along malignancy continuum.log2FC in expression of this searched gene in stem-like cells from each diseased tissue sample relative to stem-like cells in normal samples in each tissue plotted against the malignancy continuum. Samples are colored based on if they are from different disease stage.
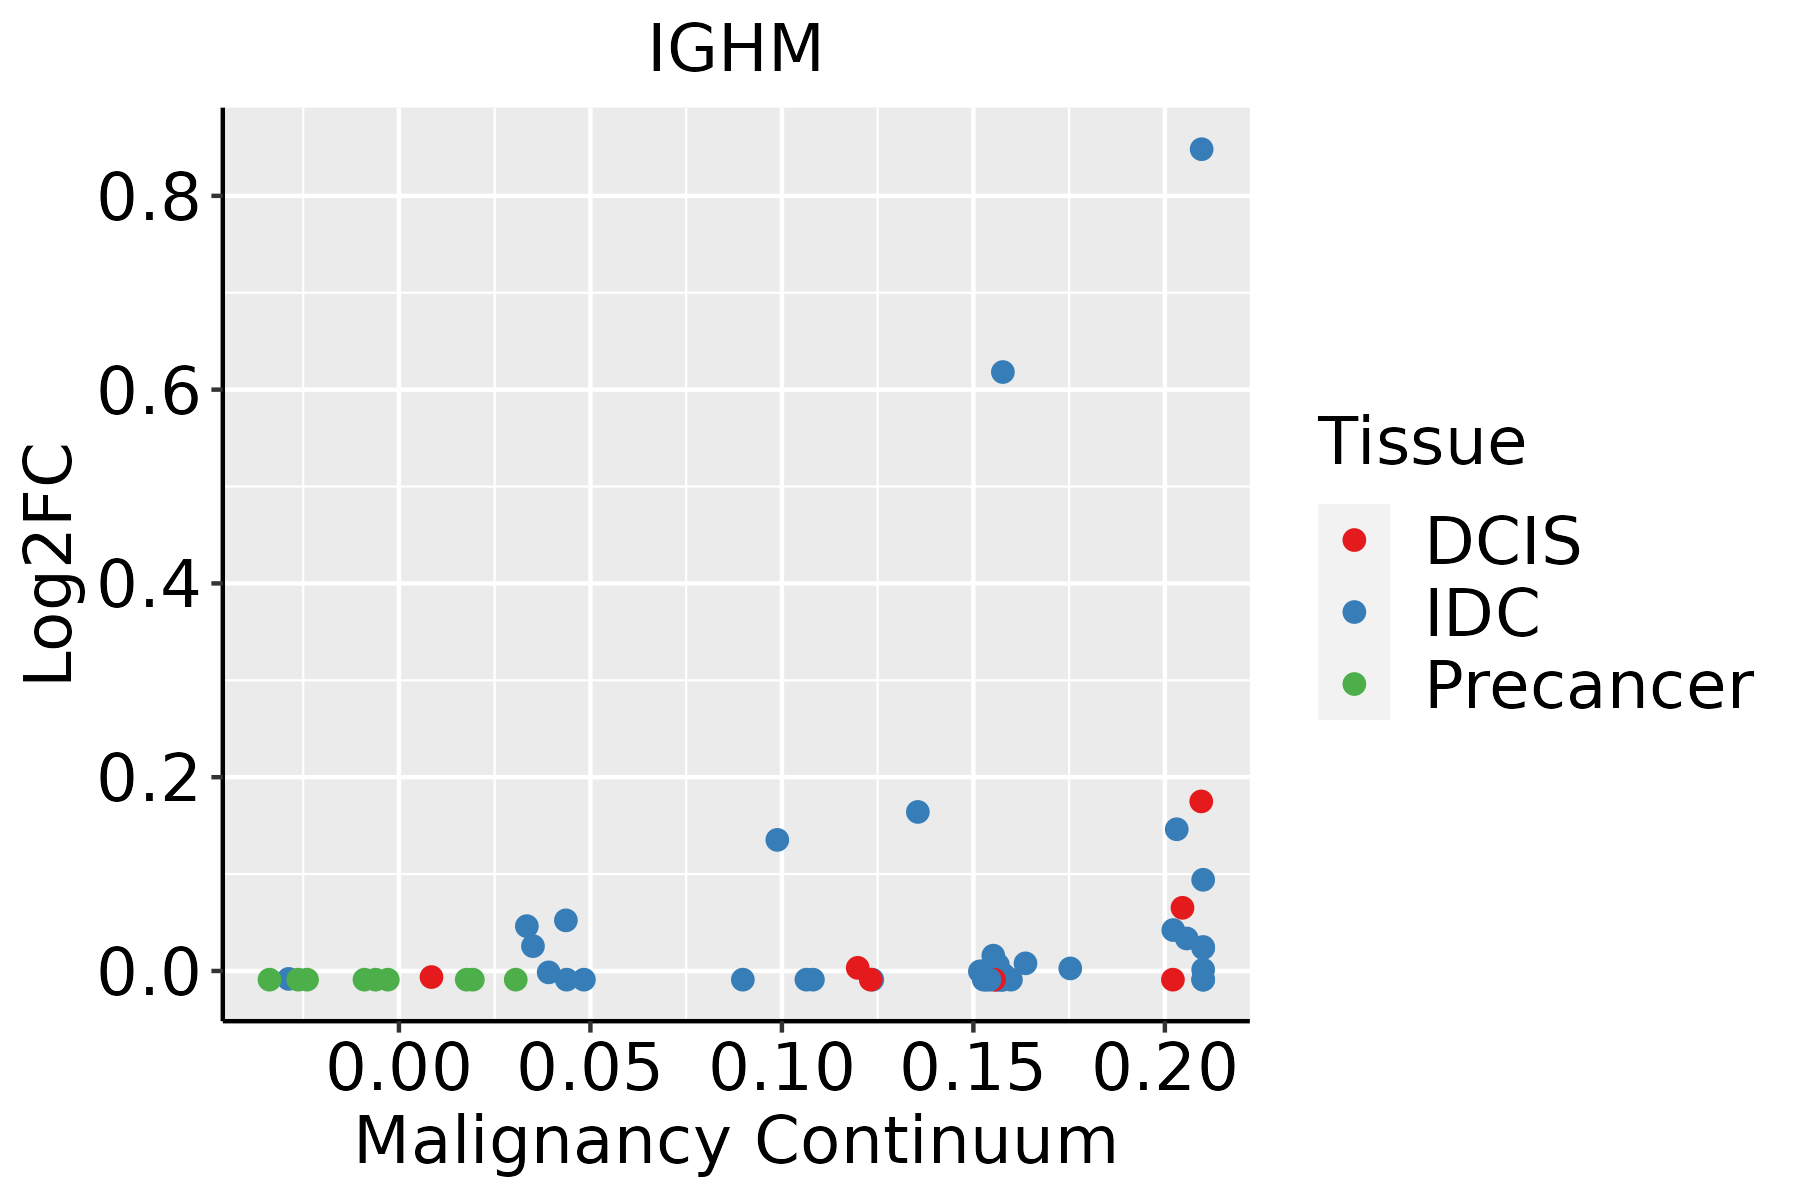
IDC: Invasive ductal carcinoma
DCIS: Ductal carcinoma in situ
Precancer(BRCA1-mut): Precancerous lesion from BRCA1 mutation carriers
EsophagusThe image shows the transcriptomic changes along malignancy continuum.log2FC in expression of this searched gene in stem-like cells from each diseased tissue sample relative to stem-like cells in normal samples in each tissue plotted against the malignancy continuum. Samples are colored based on if they are from different disease stage.ESCC: Esophageal squamous cell carcinoma
HGIN: High-grade intraepithelial neoplasias
LGIN: Low-grade intraepithelial neoplasias
GCThe image shows the transcriptomic changes along malignancy continuum.log2FC in expression of this searched gene in stem-like cells from each diseased tissue sample relative to stem-like cells in normal samples in each tissue plotted against the malignancy continuum. Samples are colored based on if they are from different disease stage.
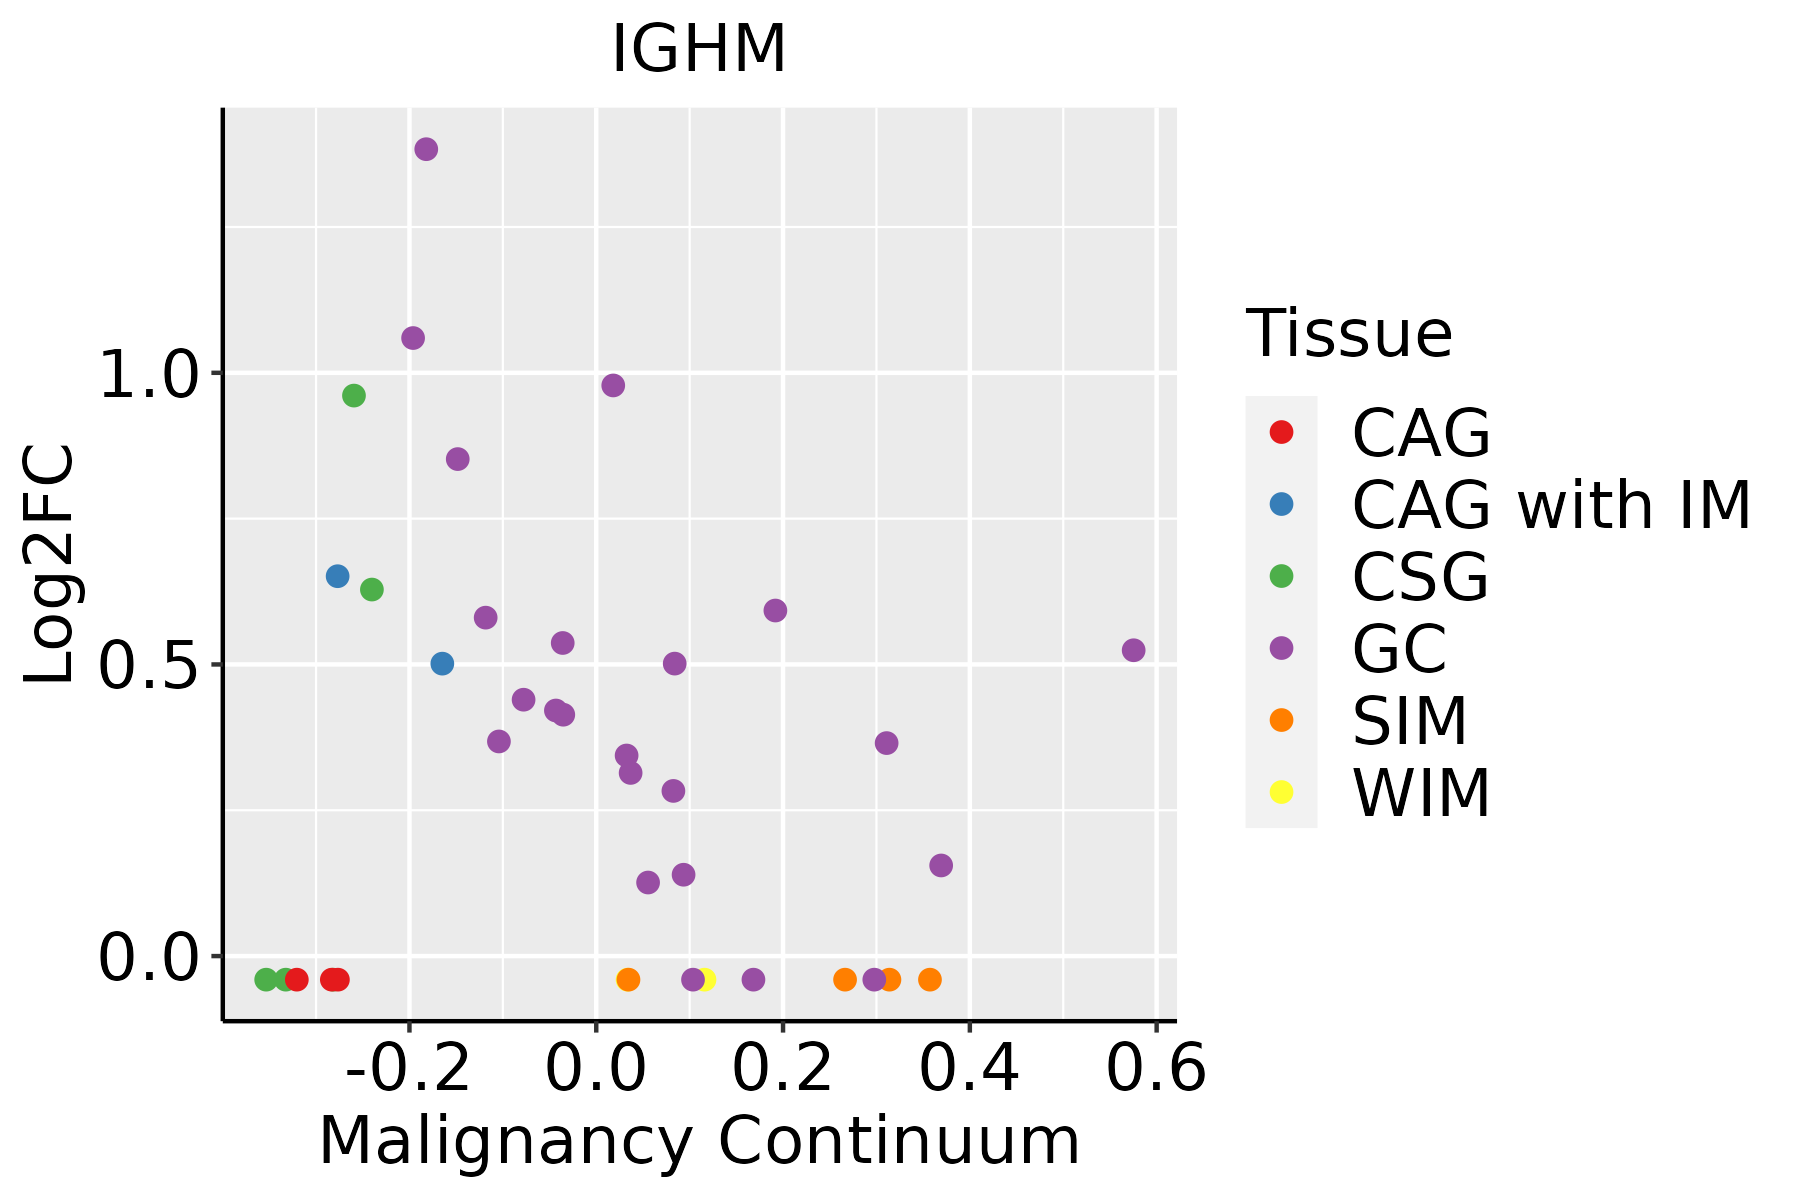
CAG: Chronic atrophic gastritis
CAG with IM: Chronic atrophic gastritis with intestinal metaplasia
CSG: Chronic superficial gastritis
GC: Gastric cancer
SIM: Severe intestinal metaplasia
WIM: Wild intestinal metaplasia
Oral CavityThe image shows the transcriptomic changes along malignancy continuum.log2FC in expression of this searched gene in stem-like cells from each diseased tissue sample relative to stem-like cells in normal samples in each tissue plotted against the malignancy continuum. Samples are colored based on if they are from different disease stage.
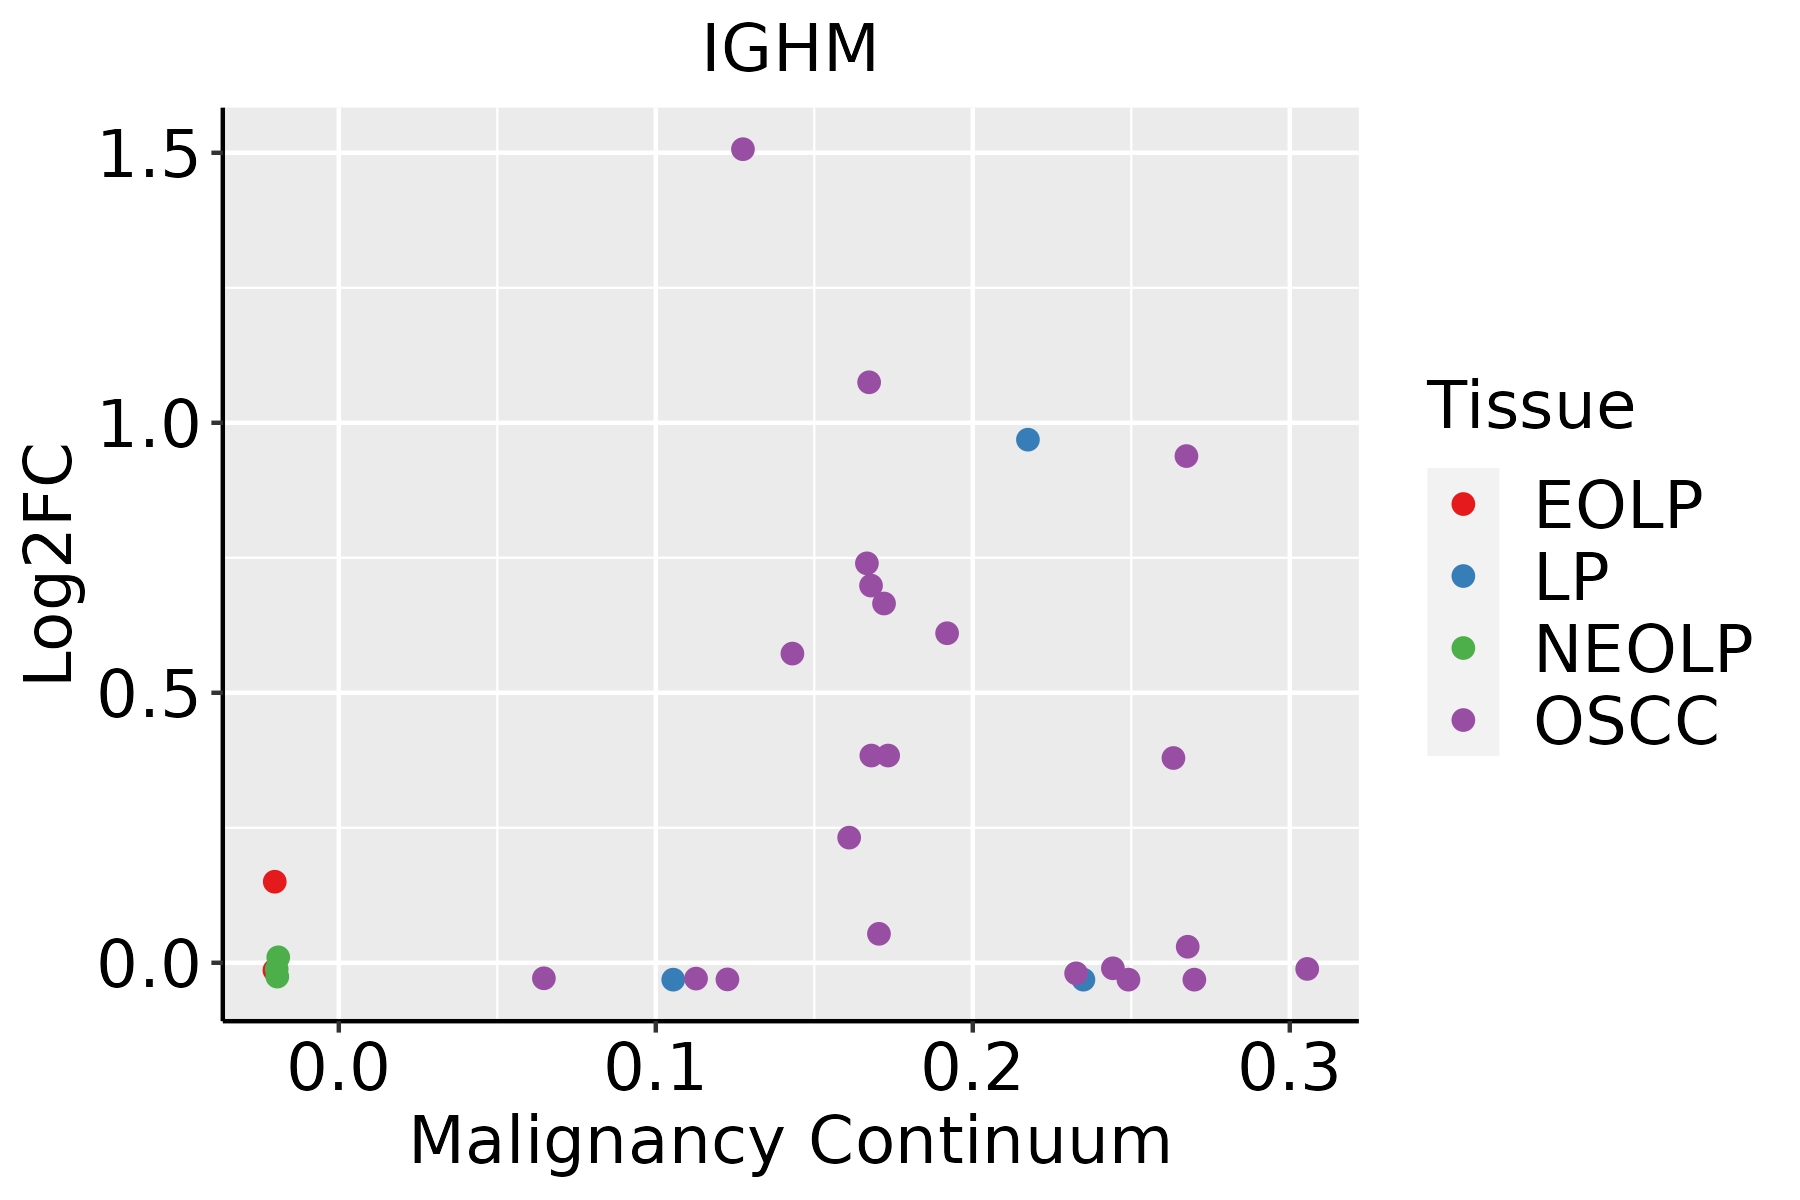
EOLP: Erosive Oral lichen planus
LP: leukoplakia
NEOLP: Non-erosive oral lichen planus
OSCC: Oral squamous cell carcinoma
ProstateThe image shows the transcriptomic changes along malignancy continuum.log2FC in expression of this searched gene in stem-like cells from each diseased tissue sample relative to stem-like cells in normal samples in each tissue plotted against the malignancy continuum. Samples are colored based on if they are from different disease stage.BPH: Benign Prostatic Hyperplasia
ThyroidThe image shows the transcriptomic changes along malignancy continuum.log2FC in expression of this searched gene in stem-like cells from each diseased tissue sample relative to stem-like cells in normal samples in each tissue plotted against the malignancy continuum. Samples are colored based on if they are from different disease stage.
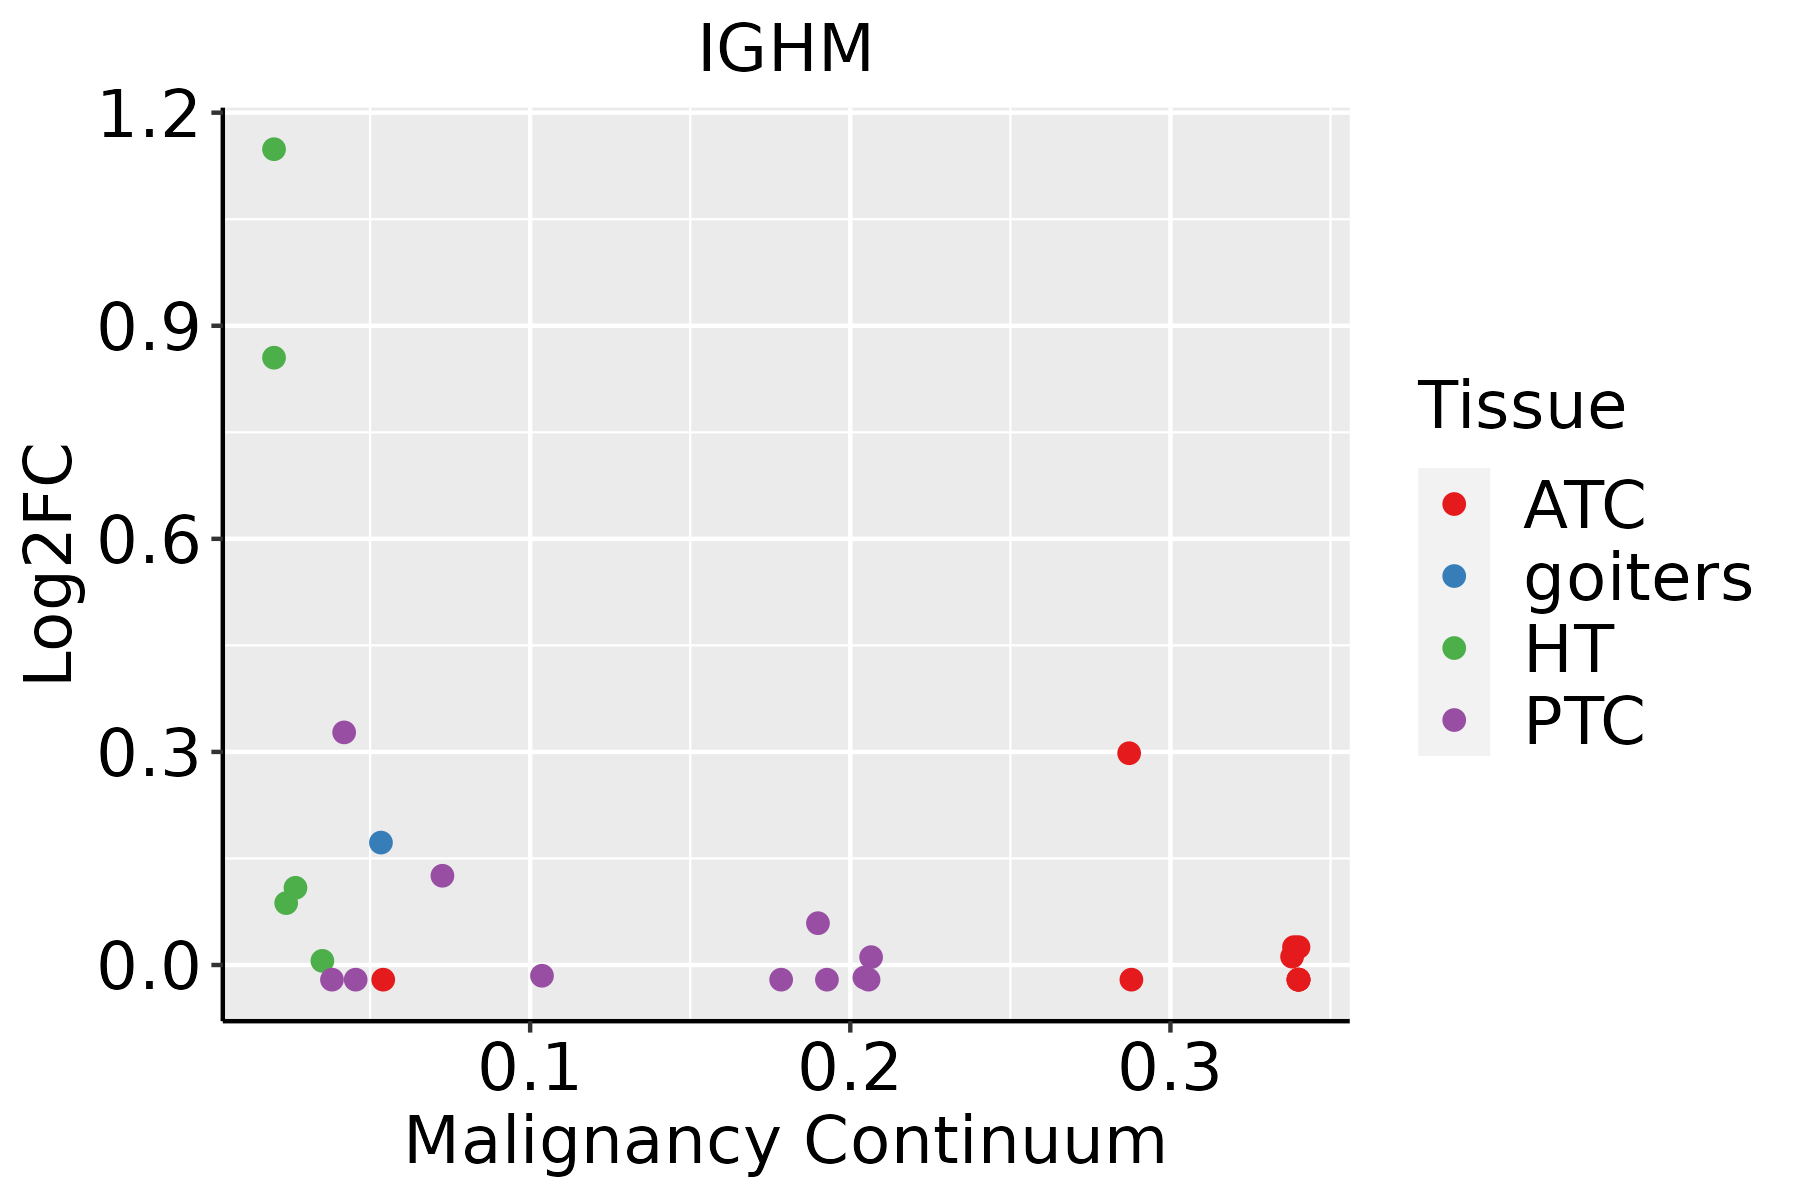
ATC: Anaplastic thyroid cancer
HT: Hashimoto's thyroiditis
PTC: Papillary thyroid cancer
∗log2FC in expression of this searched gene in stem-like cells from each diseased tissue sample relative to stem-like cells in normal samples in each tissue plotted against the malignancy continuum. Samples are colored based on if they are from different disease stage.

Top

Malignant transformation related pathway analysis

check buttonFind out the enriched GO biological processes and KEGG pathways involved in transition from healthy to precancer to cancer
check button Figure of enriched GO biological processes.
TissueDisease StageEnriched GO biological Processes
ColorectumADGO analysis - Figure of enriched GO biological processes: Top 15 enriched GO BP terms are showed in the bar plot of each disease state in each tissue. Each row represents a significant GO biological process which is colored according to the -log10(p.adjust).
ColorectumSERGO analysis - Figure of enriched GO biological processes: Top 15 enriched GO BP terms are showed in the bar plot of each disease state in each tissue. Each row represents a significant GO biological process which is colored according to the -log10(p.adjust).
ColorectumMSSGO analysis - Figure of enriched GO biological processes: Top 15 enriched GO BP terms are showed in the bar plot of each disease state in each tissue. Each row represents a significant GO biological process which is colored according to the -log10(p.adjust).
ColorectumMSI-HGO analysis - Figure of enriched GO biological processes: Top 15 enriched GO BP terms are showed in the bar plot of each disease state in each tissue. Each row represents a significant GO biological process which is colored according to the -log10(p.adjust).
ColorectumFAPGO analysis - Figure of enriched GO biological processes: Top 15 enriched GO BP terms are showed in the bar plot of each disease state in each tissue. Each row represents a significant GO biological process which is colored according to the -log10(p.adjust).
∗Top 15 enriched GO BP terms are showed in the bar plot of each disease state in each tissue. Each row represents a significant GO biological process which is colored according to the -log10(p.adjust).
Page: 1 2 3 4 5 6 7 8 9 

check button Enriched GO biological processes.
GO IDTissueDisease StageDescriptionGene RatioBg Ratiopvaluep.adjustCount
GO:001973011BreastIDCantimicrobial humoral response23/1434122/187234.67e-051.04e-0323
GO:00069596BreastIDChumoral immune response40/1434317/187231.25e-031.33e-0240
GO:00512515BreastIDCpositive regulation of lymphocyte activation43/1434362/187232.72e-032.41e-0243
GO:00022532BreastIDCactivation of immune response43/1434375/187235.16e-033.84e-0243
GO:00026966BreastIDCpositive regulation of leukocyte activation46/1434409/187235.60e-034.07e-0246
GO:00323926EsophagusHGINDNA geometric change25/258790/187233.77e-045.85e-0325
GO:00325084EsophagusHGINDNA duplex unwinding22/258784/187231.91e-032.03e-0222
GO:00062604EsophagusESCCDNA replication181/8552260/187233.55e-152.05e-13181
GO:003239214EsophagusESCCDNA geometric change62/855290/187237.02e-067.04e-0562
GO:003250813EsophagusESCCDNA duplex unwinding58/855284/187231.23e-051.14e-0458
GO:00063101EsophagusESCCDNA recombination168/8552305/187235.58e-043.05e-03168
GO:00062603Oral cavityOSCCDNA replication159/7305260/187233.25e-131.59e-11159
GO:00323925Oral cavityOSCCDNA geometric change59/730590/187233.03e-074.63e-0659
GO:00325083Oral cavityOSCCDNA duplex unwinding55/730584/187238.05e-071.12e-0555
GO:0006310Oral cavityOSCCDNA recombination147/7305305/187236.33e-043.56e-03147
GO:00027646Oral cavityOSCCimmune response-regulating signaling pathway212/7305468/187232.93e-031.27e-02212
GO:000276413Oral cavityEOLPimmune response-regulating signaling pathway108/2218468/187234.04e-127.34e-10108
GO:00027683Oral cavityEOLPimmune response-regulating cell surface receptor signaling pathway66/2218315/187232.44e-065.45e-0566
GO:00512517Oral cavityEOLPpositive regulation of lymphocyte activation72/2218362/187236.21e-061.22e-0472
GO:00024292Oral cavityEOLPimmune response-activating cell surface receptor signaling pathway60/2218291/187231.16e-052.00e-0460
Page: 1 2 3 4 5 6 

check button Enriched KEGG pathways.
Pathway IDTissueDisease StageDescriptionGene RatioBg Ratiopvaluep.adjustqvalueCount
Page: 1 

Top

Cell-cell communication analysis

check buttonIdentification of potential cell-cell interactions between two cell types and their ligand-receptor pairs for different disease states
LigandReceptorLRpairPathwayTissueDisease Stage
Page: 1 

Top

Single-cell gene regulatory network inference analysis

check buttonFind out the significant the regulons (TFs) and the target genes of each regulon across cell types for different disease states
TFCell TypeTissueDisease StageTarget GeneRSSRegulon Activity
∗The dot plots of a searched regulon are shown for all cell subpopulations in each disease state of each tissue based on the regulon specific score inferred using pySCENIC and by calculating the average expression.
Page: 1 

Top

Somatic mutation of malignant transformation related genes

check buttonAnnotation of somatic variants for genes involved in malignant transformation
Hugo SymbolVariant ClassVariant ClassificationdbSNP RSHGVScHGVSpHGVSp ShortSWISSPROTBIOTYPESIFTPolyPhenTumor Sample BarcodeTissueHistologySexAgeStageTherapy TypesDrugsOutcome
IGHMSNVMissense_Mutationnovelc.254A>Tp.His85Leup.H85LIG_C_genetolerated(0.35)unknown(0)TCGA-B6-A0IN-01Breastbreast invasive carcinomaFemale<65I/IIUnknownUnknownPD
IGHMSNVMissense_Mutationnovelc.337N>Ap.Val113Metp.V113MIG_C_genetolerated(0.14)unknown(0)TCGA-D8-A1XL-01Breastbreast invasive carcinomaFemale<65I/IIChemotherapydoxorubicine+cyclophosphamide+tamoxifenSD
IGHMinsertionFrame_Shift_Insnovelc.82_83insCCCAAAGTGAGCGTCTTCGTCCCp.Cys28SerfsTer41p.C28Sfs*41IG_C_geneTCGA-A2-A0D1-01Breastbreast invasive carcinomaFemale>=65I/IIChemotherapytaxotereSD
IGHMSNVMissense_Mutationnovelc.851N>Tp.Ala284Valp.A284VIG_C_genetolerated(0.79)possibly_damaging(0.691)TCGA-2W-A8YY-01Cervixcervical & endocervical cancerFemale<65I/IIChemotherapycisplatinCR
IGHMSNVMissense_Mutationnovelc.122N>Tp.Ser41Phep.S41FIG_C_genedeleterious(0)unknown(0)TCGA-2W-A8YY-01Cervixcervical & endocervical cancerFemale<65I/IIChemotherapycisplatinCR
IGHMSNVMissense_Mutationrs372720307c.1172N>Ap.Arg391Glnp.R391QIG_C_genetolerated(0.27)benign(0.412)TCGA-EA-A50E-01Cervixcervical & endocervical cancerFemale<65I/IIUnknownUnknownPD
IGHMSNVMissense_Mutationrs372261472c.76G>Ap.Val26Ilep.V26IIG_C_genetolerated(0.65)unknown(0)TCGA-FU-A5XV-01Cervixcervical & endocervical cancerFemale<65III/IVUnknownUnknownSD
IGHMSNVMissense_Mutationnovelc.346T>Cp.Phe116Leup.F116LIG_C_genetolerated(0.18)unknown(0)TCGA-AA-3492-01Colorectumcolon adenocarcinomaFemale>=65I/IIUnknownUnknownSD
IGHMSNVMissense_Mutationrs375873260c.905C>Tp.Thr302Metp.T302MIG_C_genetolerated(0.07)possibly_damaging(0.895)TCGA-AA-3663-01Colorectumcolon adenocarcinomaMale<65I/IIUnknownUnknownSD
IGHMSNVMissense_Mutationrs782615938c.853N>Ap.Val285Metp.V285MIG_C_genetolerated(0.12)possibly_damaging(0.788)TCGA-AA-3673-01Colorectumcolon adenocarcinomaFemale<65I/IIUnknownUnknownSD
Page: 1 2 3 4 5 6 7 8 9 10 

Top

Related drugs of malignant transformation related genes

check buttonIdentification of chemicals and drugs interact with genes involved in malignant transfromation
(DGIdb 4.0)
Entrez IDSymbolCategoryInteraction TypesDrug Claim NameDrug NamePMIDs
Page: 1