
|
|||||
|
 | |
| |
| |
| |
| |
| |
|
Gene: IGHG4 |
Gene summary for IGHG4 |
| Gene information | Species | Human | Gene symbol | IGHG4 | Gene ID | 3503 |
| Gene name | immunoglobulin heavy constant gamma 4 (G4m marker) | |
| Gene Alias | IGHG4 | |
| Cytomap | 14q32.33 | |
| Gene Type | other | GO ID | GO:0001775 | UniProtAcc | NA |
Top |
Malignant transformation analysis |
| Identification of the aberrant gene expression in precancerous and cancerous lesions by comparing the gene expression of stem-like cells in diseased tissues with normal stem cells |
| Entrez ID | Symbol | Replicates | Species | Organ | Tissue | Adj P-value | Log2FC | Malignancy |
| 3503 | IGHG4 | GSM4909297 | Human | Breast | IDC | 3.32e-03 | 1.63e-01 | 0.1517 |
| 3503 | IGHG4 | GSM4909304 | Human | Breast | IDC | 2.93e-53 | 7.43e-01 | 0.1636 |
| 3503 | IGHG4 | GSM4909305 | Human | Breast | IDC | 1.48e-03 | 1.18e-01 | 0.0436 |
| 3503 | IGHG4 | GSM4909306 | Human | Breast | IDC | 1.37e-13 | 2.94e-01 | 0.1564 |
| 3503 | IGHG4 | GSM4909307 | Human | Breast | IDC | 5.35e-20 | 4.06e-01 | 0.1569 |
| 3503 | IGHG4 | GSM4909308 | Human | Breast | IDC | 5.48e-42 | 6.30e-01 | 0.158 |
| 3503 | IGHG4 | GSM4909309 | Human | Breast | IDC | 1.58e-06 | 2.25e-01 | 0.0483 |
| 3503 | IGHG4 | GSM4909317 | Human | Breast | IDC | 6.59e-17 | 3.37e-01 | 0.1355 |
| 3503 | IGHG4 | GSM4909318 | Human | Breast | IDC | 8.25e-03 | 3.25e-01 | 0.2031 |
| 3503 | IGHG4 | GSM4909321 | Human | Breast | IDC | 1.65e-04 | 2.17e-01 | 0.1559 |
| 3503 | IGHG4 | M1 | Human | Breast | IDC | 2.70e-18 | 4.24e-01 | 0.1577 |
| 3503 | IGHG4 | NCCBC5 | Human | Breast | DCIS | 9.77e-03 | 2.17e-01 | 0.2046 |
| 3503 | IGHG4 | P3 | Human | Breast | IDC | 2.07e-06 | 3.52e-01 | 0.1542 |
| 3503 | IGHG4 | CA_HPV_1 | Human | Cervix | CC | 1.10e-34 | -8.04e-01 | 0.0264 |
| 3503 | IGHG4 | CA_HPV_2 | Human | Cervix | CC | 4.42e-23 | -7.57e-01 | 0.0391 |
| 3503 | IGHG4 | CA_HPV_3 | Human | Cervix | CC | 3.53e-31 | -8.29e-01 | 0.0414 |
| 3503 | IGHG4 | HSIL_HPV_1 | Human | Cervix | HSIL_HPV | 1.09e-05 | -5.27e-01 | 0.0116 |
| 3503 | IGHG4 | HSIL_HPV_2 | Human | Cervix | HSIL_HPV | 3.32e-03 | -3.17e-01 | 0.0208 |
| 3503 | IGHG4 | N_HPV_1 | Human | Cervix | N_HPV | 5.28e-12 | -5.93e-01 | 0.0079 |
| 3503 | IGHG4 | N_HPV_2 | Human | Cervix | N_HPV | 5.16e-43 | -8.79e-01 | -0.0131 |
| Page: 1 2 3 4 5 |
| Tissue | Expression Dynamics | Abbreviation |
| Breast | 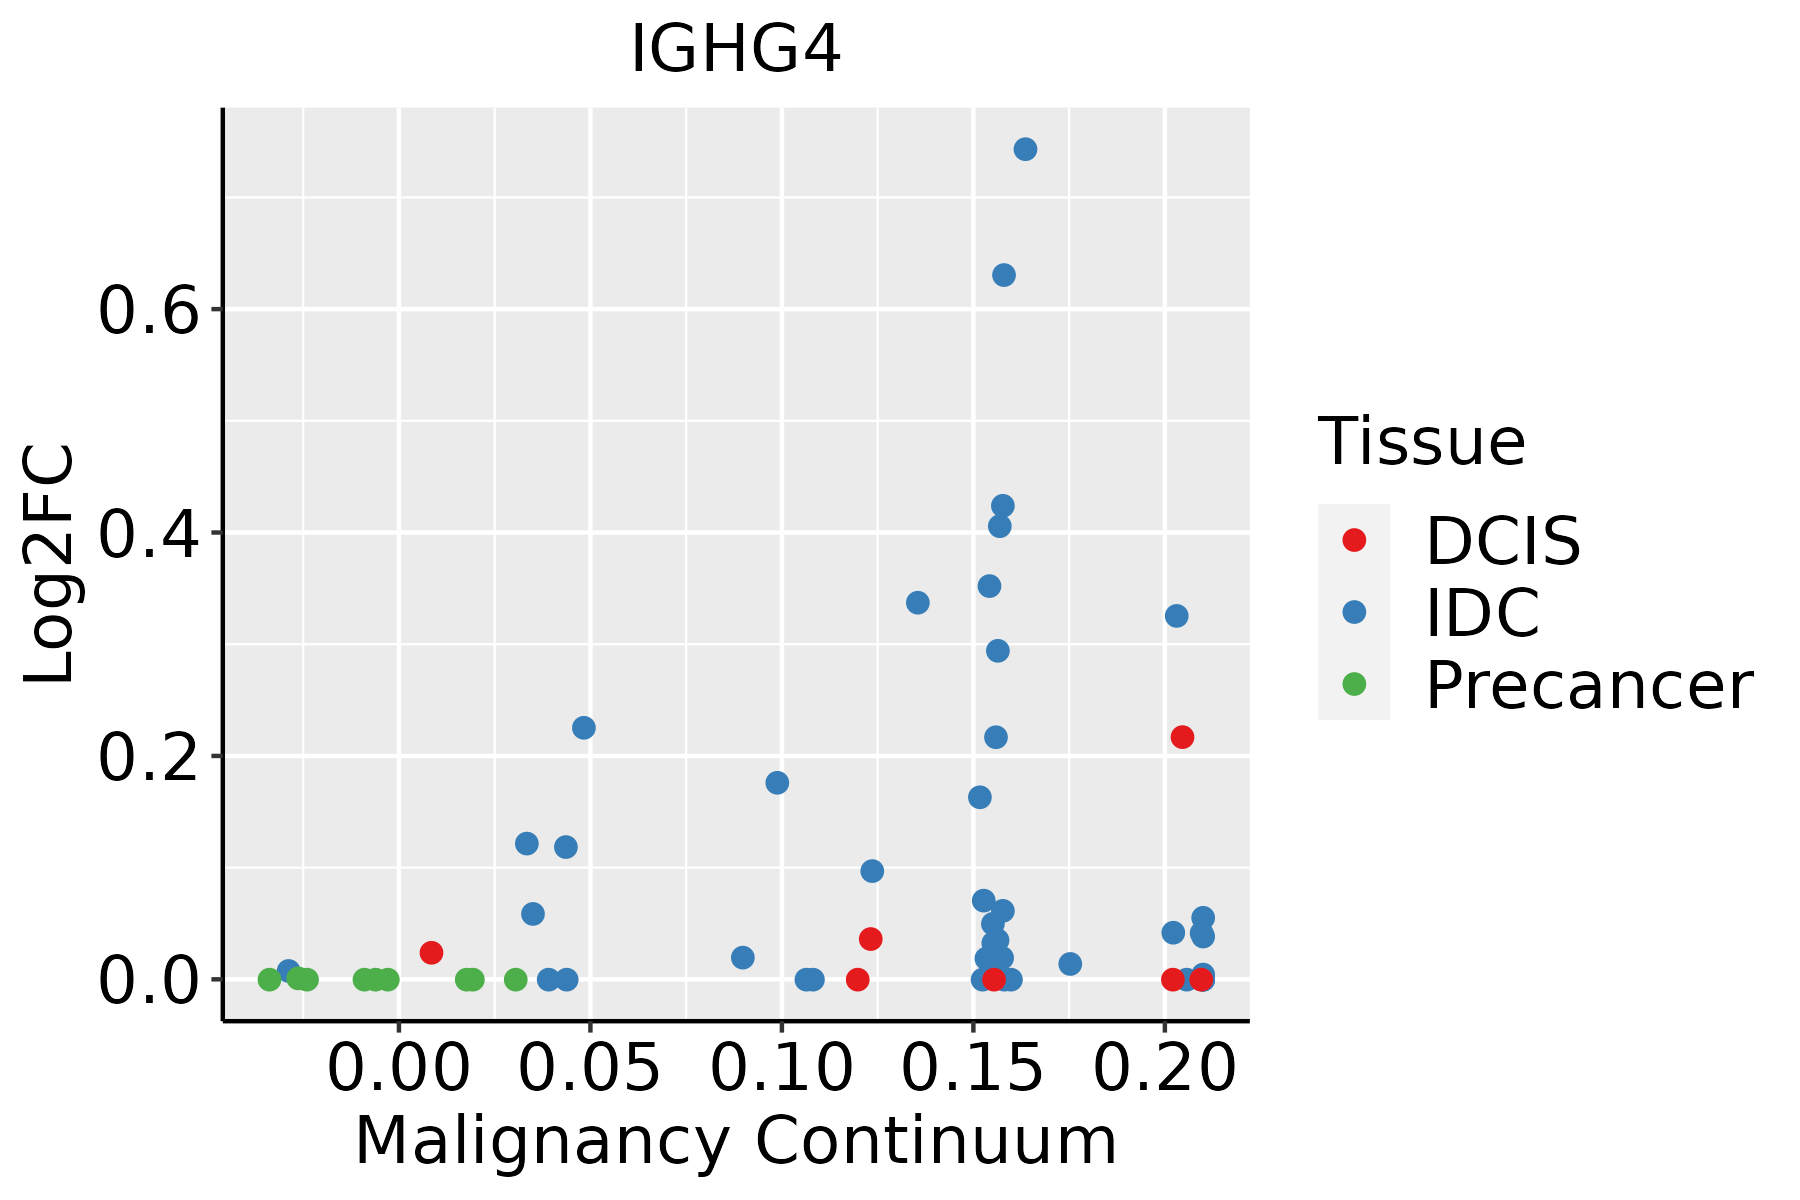 | IDC: Invasive ductal carcinoma |
| DCIS: Ductal carcinoma in situ | ||
| Precancer(BRCA1-mut): Precancerous lesion from BRCA1 mutation carriers | ||
| Cervix | 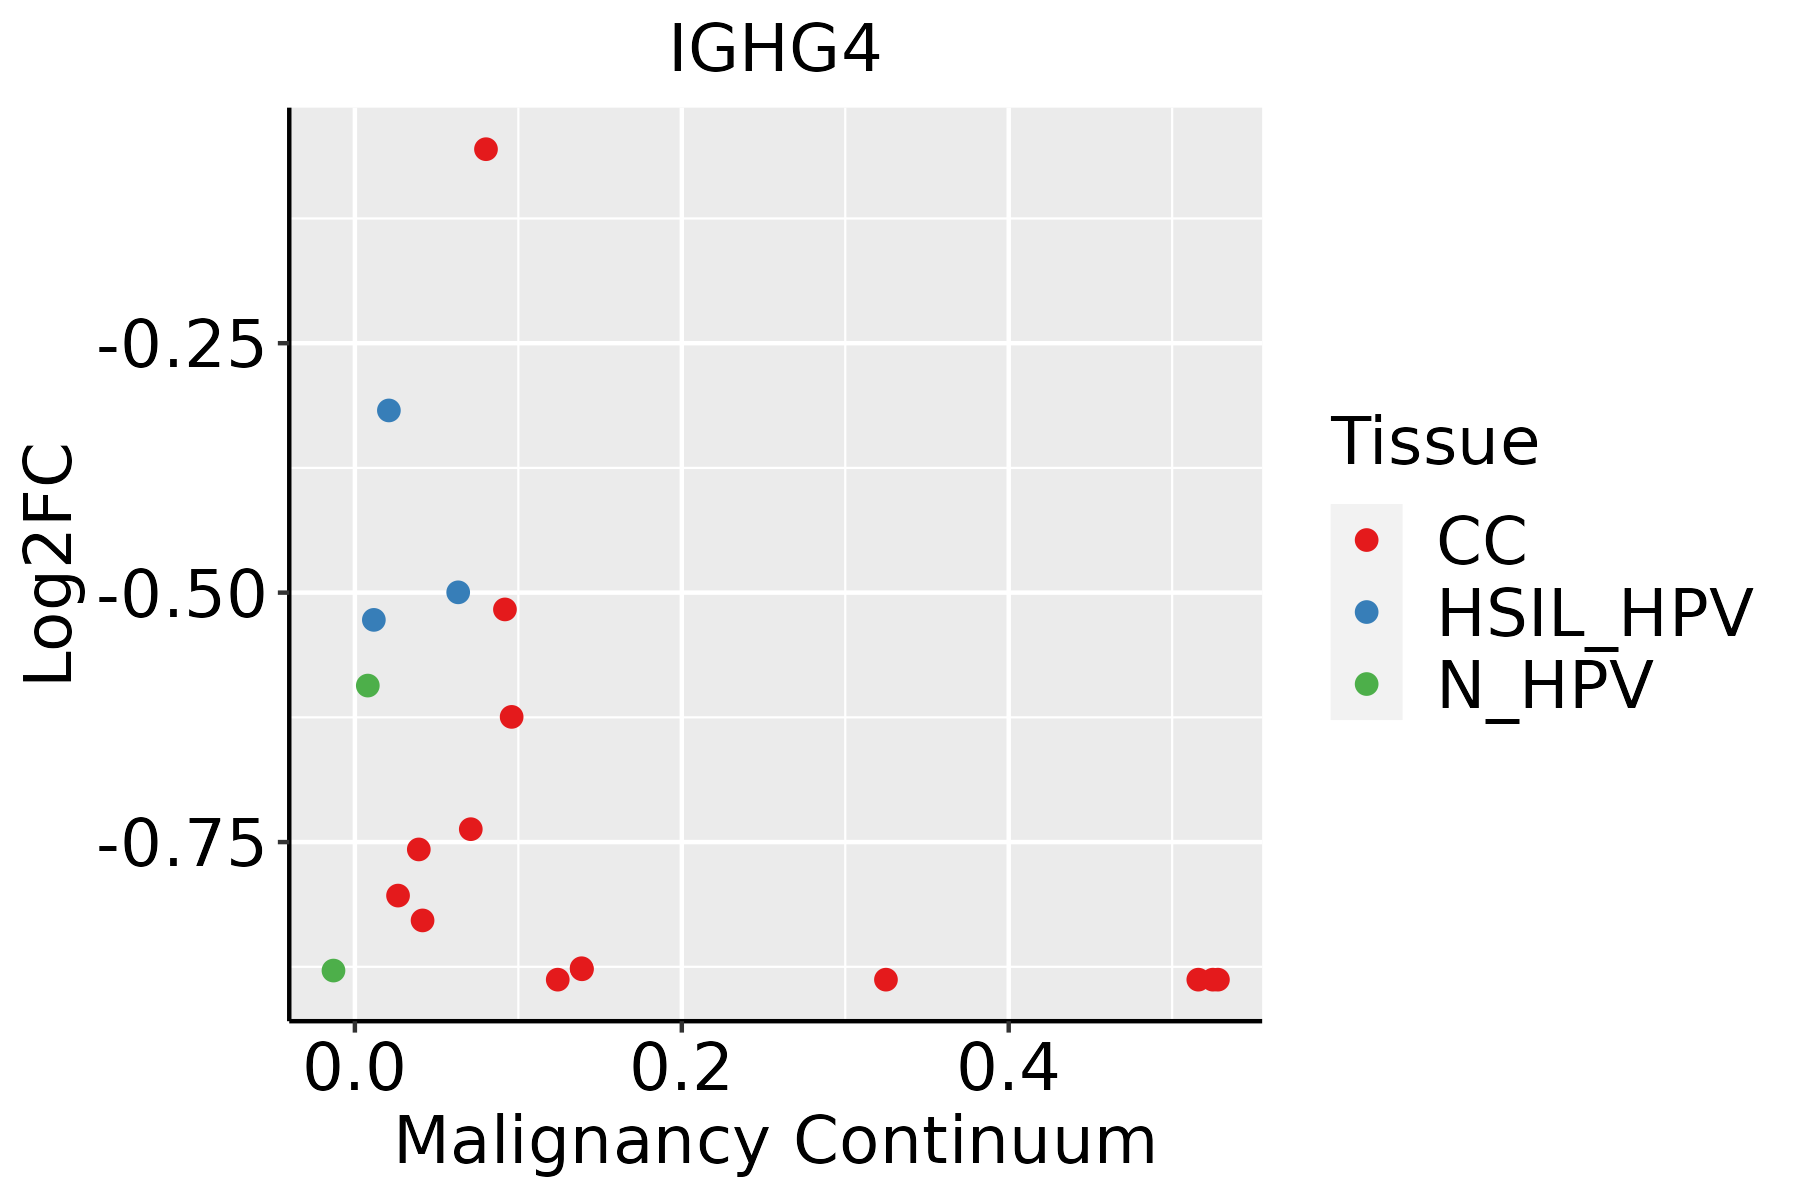 | CC: Cervix cancer |
| HSIL_HPV: HPV-infected high-grade squamous intraepithelial lesions | ||
| N_HPV: HPV-infected normal cervix | ||
| GC |  | CAG: Chronic atrophic gastritis |
| CAG with IM: Chronic atrophic gastritis with intestinal metaplasia | ||
| CSG: Chronic superficial gastritis | ||
| GC: Gastric cancer | ||
| SIM: Severe intestinal metaplasia | ||
| WIM: Wild intestinal metaplasia | ||
| Oral Cavity | 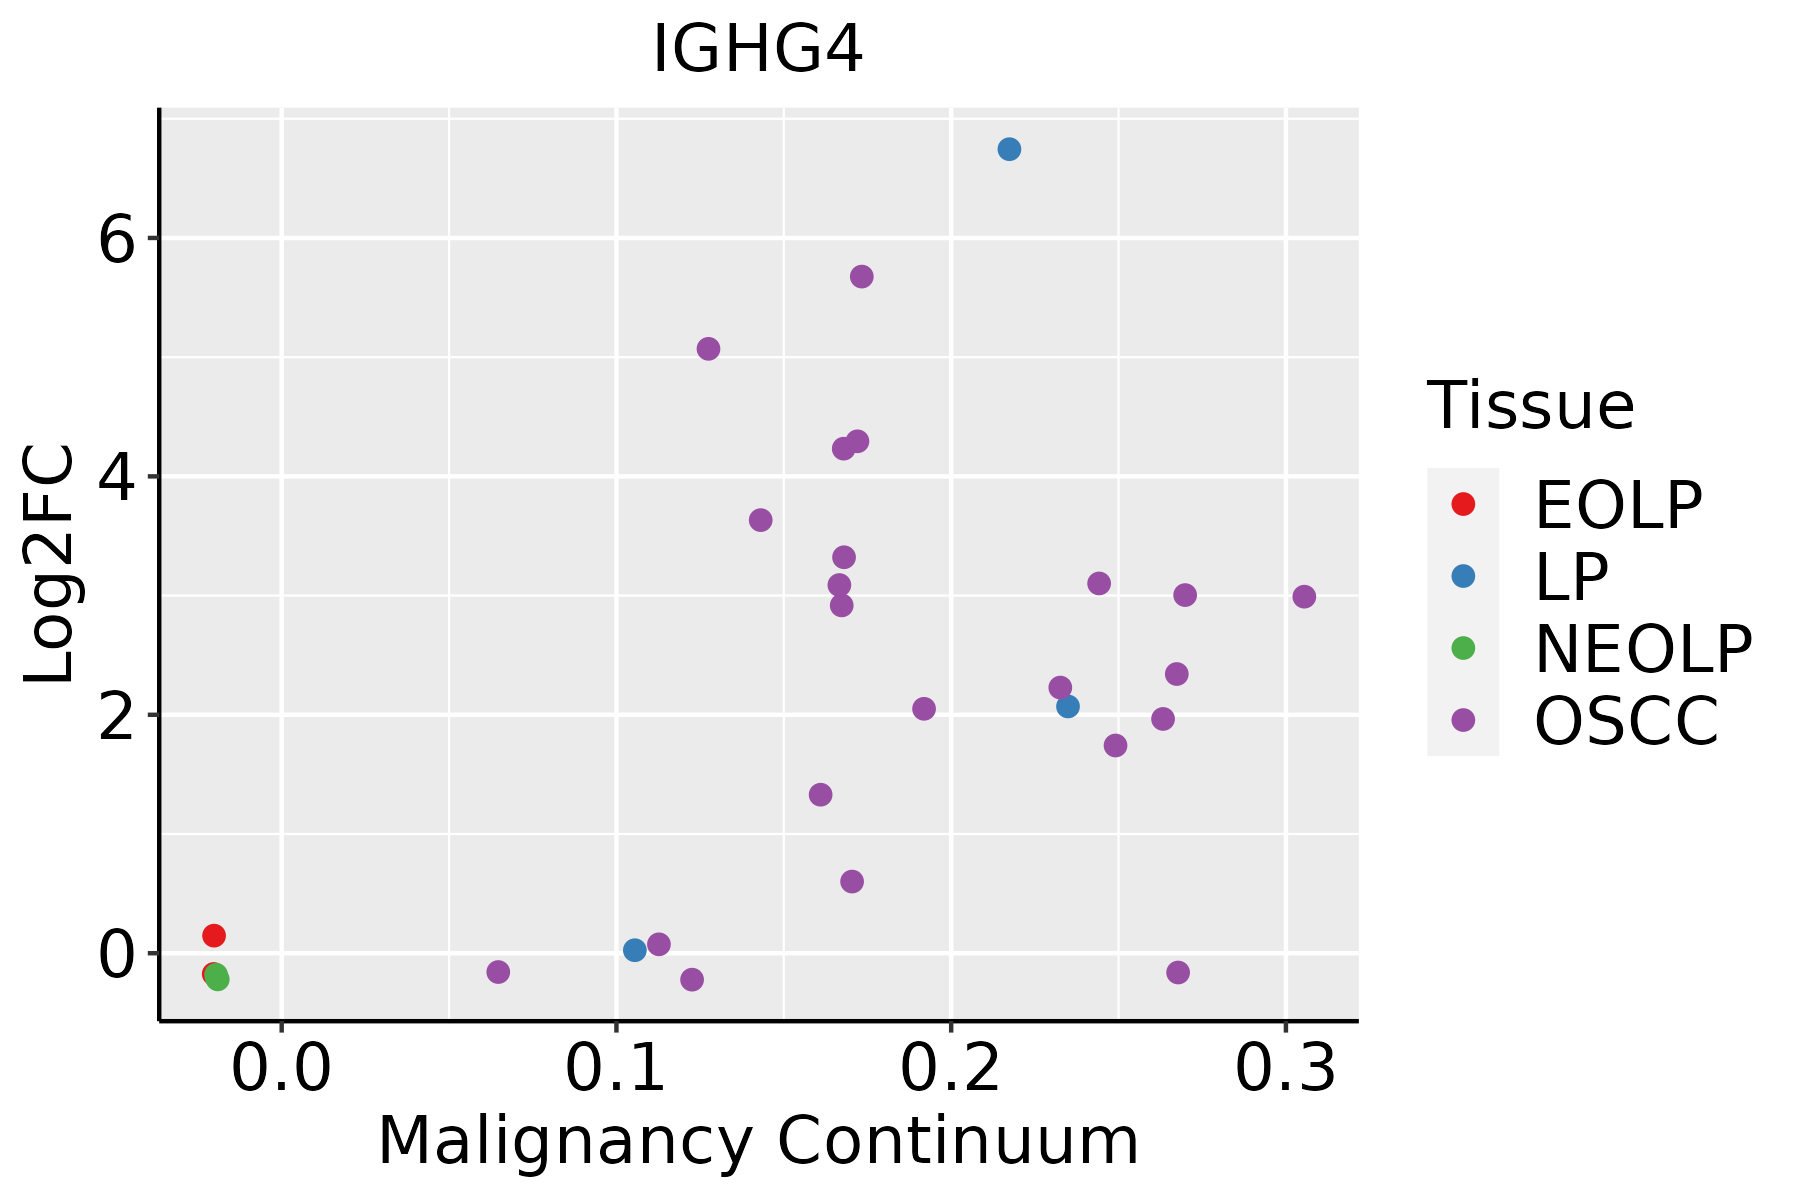 | EOLP: Erosive Oral lichen planus |
| LP: leukoplakia | ||
| NEOLP: Non-erosive oral lichen planus | ||
| OSCC: Oral squamous cell carcinoma | ||
| Prostate | 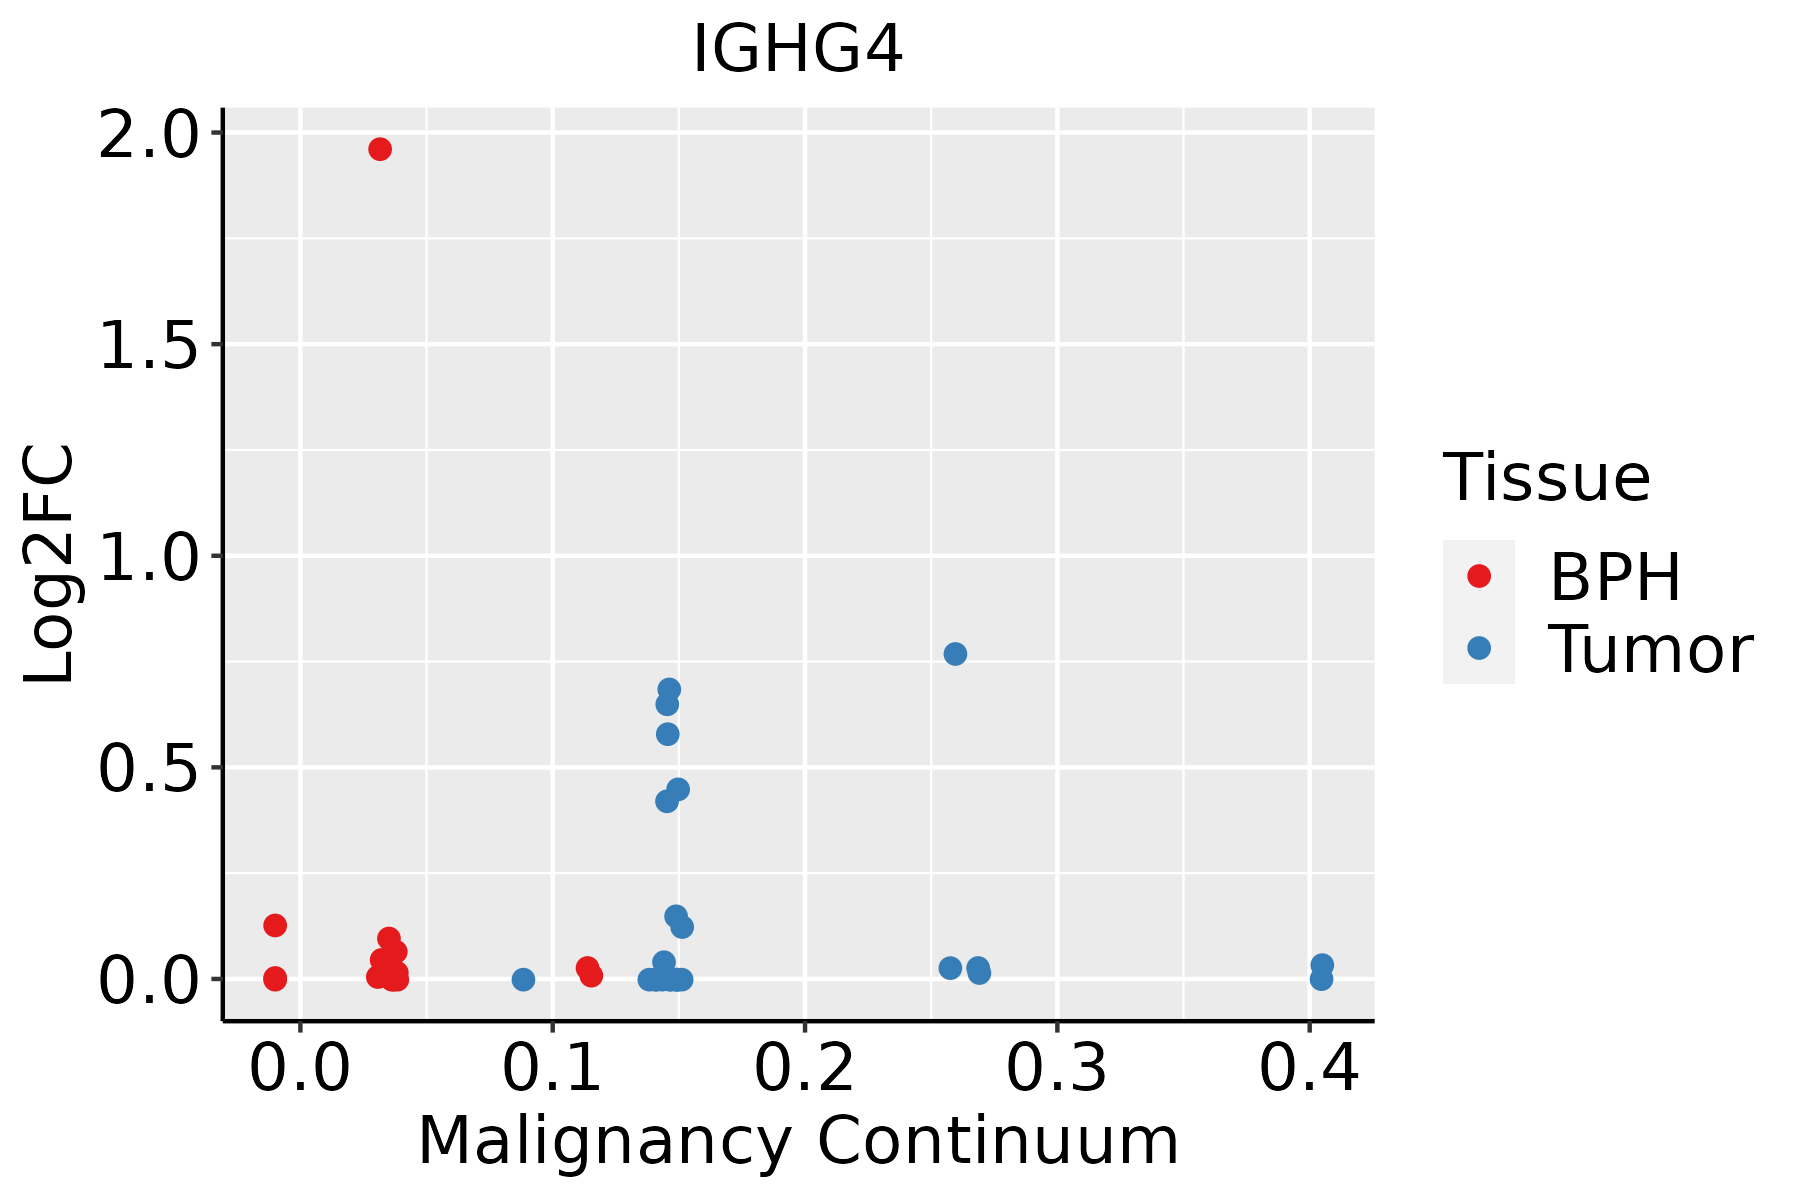 | BPH: Benign Prostatic Hyperplasia |
| Thyroid |  | ATC: Anaplastic thyroid cancer |
| HT: Hashimoto's thyroiditis | ||
| PTC: Papillary thyroid cancer |
| ∗log2FC in expression of this searched gene in stem-like cells from each diseased tissue sample relative to stem-like cells in normal samples in each tissue plotted against the malignancy continuum. Samples are colored based on if they are from different disease stage. |
Top |
Malignant transformation related pathway analysis |
| Find out the enriched GO biological processes and KEGG pathways involved in transition from healthy to precancer to cancer |
| Tissue | Disease Stage | Enriched GO biological Processes |
| Colorectum | AD |  |
| Colorectum | SER |  |
| Colorectum | MSS |  |
| Colorectum | MSI-H |  |
| Colorectum | FAP |  |
| ∗Top 15 enriched GO BP terms are showed in the bar plot of each disease state in each tissue. Each row represents a significant GO biological process which is colored according to the -log10(p.adjust). |
| Page: 1 2 3 4 5 6 7 8 9 |
| GO ID | Tissue | Disease Stage | Description | Gene Ratio | Bg Ratio | pvalue | p.adjust | Count |
| GO:00069596 | Breast | IDC | humoral immune response | 40/1434 | 317/18723 | 1.25e-03 | 1.33e-02 | 40 |
| GO:00512515 | Breast | IDC | positive regulation of lymphocyte activation | 43/1434 | 362/18723 | 2.72e-03 | 2.41e-02 | 43 |
| GO:00022532 | Breast | IDC | activation of immune response | 43/1434 | 375/18723 | 5.16e-03 | 3.84e-02 | 43 |
| GO:00026966 | Breast | IDC | positive regulation of leukocyte activation | 46/1434 | 409/18723 | 5.60e-03 | 4.07e-02 | 46 |
| GO:005125111 | Breast | DCIS | positive regulation of lymphocyte activation | 42/1390 | 362/18723 | 2.65e-03 | 2.35e-02 | 42 |
| GO:000225311 | Breast | DCIS | activation of immune response | 43/1390 | 375/18723 | 2.96e-03 | 2.54e-02 | 43 |
| GO:000695911 | Breast | DCIS | humoral immune response | 37/1390 | 317/18723 | 4.16e-03 | 3.29e-02 | 37 |
| GO:00027644 | Cervix | CC | immune response-regulating signaling pathway | 97/2311 | 468/18723 | 1.49e-07 | 7.07e-06 | 97 |
| GO:00022533 | Cervix | CC | activation of immune response | 72/2311 | 375/18723 | 8.26e-05 | 1.11e-03 | 72 |
| GO:0002768 | Cervix | CC | immune response-regulating cell surface receptor signaling pathway | 59/2311 | 315/18723 | 6.64e-04 | 6.11e-03 | 59 |
| GO:00026967 | Cervix | CC | positive regulation of leukocyte activation | 72/2311 | 409/18723 | 1.13e-03 | 9.31e-03 | 72 |
| GO:00512516 | Cervix | CC | positive regulation of lymphocyte activation | 65/2311 | 362/18723 | 1.15e-03 | 9.39e-03 | 65 |
| GO:00508676 | Cervix | CC | positive regulation of cell activation | 73/2311 | 420/18723 | 1.50e-03 | 1.16e-02 | 73 |
| GO:00024603 | Cervix | CC | adaptive immune response based on somatic recombination of immune receptors built from immunoglobulin superfamily domains | 62/2311 | 356/18723 | 3.09e-03 | 2.03e-02 | 62 |
| GO:0002443 | Cervix | CC | leukocyte mediated immunity | 73/2311 | 440/18723 | 5.01e-03 | 2.98e-02 | 73 |
| GO:0006909 | Cervix | CC | phagocytosis | 53/2311 | 308/18723 | 7.49e-03 | 4.01e-02 | 53 |
| GO:00069597 | Cervix | CC | humoral immune response | 54/2311 | 317/18723 | 8.57e-03 | 4.42e-02 | 54 |
| GO:00103243 | Cervix | CC | membrane invagination | 28/2311 | 144/18723 | 9.50e-03 | 4.72e-02 | 28 |
| GO:000695912 | Cervix | HSIL_HPV | humoral immune response | 39/737 | 317/18723 | 2.88e-10 | 7.02e-08 | 39 |
| GO:000269611 | Cervix | HSIL_HPV | positive regulation of leukocyte activation | 44/737 | 409/18723 | 1.58e-09 | 3.04e-07 | 44 |
| Page: 1 2 3 4 5 6 7 8 |
| Pathway ID | Tissue | Disease Stage | Description | Gene Ratio | Bg Ratio | pvalue | p.adjust | qvalue | Count |
| Page: 1 |
Top |
Cell-cell communication analysis |
| Identification of potential cell-cell interactions between two cell types and their ligand-receptor pairs for different disease states |
| Ligand | Receptor | LRpair | Pathway | Tissue | Disease Stage |
| Page: 1 |
Top |
Single-cell gene regulatory network inference analysis |
| Find out the significant the regulons (TFs) and the target genes of each regulon across cell types for different disease states |
| TF | Cell Type | Tissue | Disease Stage | Target Gene | RSS | Regulon Activity |
| ∗The dot plots of a searched regulon are shown for all cell subpopulations in each disease state of each tissue based on the regulon specific score inferred using pySCENIC and by calculating the average expression. |
| Page: 1 |
Top |
Somatic mutation of malignant transformation related genes |
| Annotation of somatic variants for genes involved in malignant transformation |
| Hugo Symbol | Variant Class | Variant Classification | dbSNP RS | HGVSc | HGVSp | HGVSp Short | SWISSPROT | BIOTYPE | SIFT | PolyPhen | Tumor Sample Barcode | Tissue | Histology | Sex | Age | Stage | Therapy Types | Drugs | Outcome |
| IGHG4 | SNV | Missense_Mutation | novel | c.157N>G | p.Phe53Val | p.F53V | P01861 | IG_C_gene | deleterious(0.01) | probably_damaging(1) | TCGA-A8-A07O-01 | Breast | breast invasive carcinoma | Female | <65 | I/II | Chemotherapy | CR | |
| IGHG4 | SNV | Missense_Mutation | novel | c.711G>C | p.Glu237Asp | p.E237D | P01861 | IG_C_gene | deleterious(0.01) | probably_damaging(0.998) | TCGA-GM-A2DD-01 | Breast | breast invasive carcinoma | Female | <65 | I/II | Chemotherapy | fluorouracil | CR |
| IGHG4 | SNV | Missense_Mutation | rs751881796 | c.161C>T | p.Pro54Leu | p.P54L | P01861 | IG_C_gene | deleterious(0) | probably_damaging(1) | TCGA-XX-A89A-01 | Breast | breast invasive carcinoma | Female | >=65 | I/II | Unknown | Unknown | SD |
| IGHG4 | insertion | Frame_Shift_Ins | novel | c.549_550insGTGTGGTC | p.Ser184ValfsTer14 | p.S184Vfs*14 | P01861 | IG_C_gene | TCGA-EW-A1PA-01 | Breast | breast invasive carcinoma | Female | <65 | I/II | Chemotherapy | cyclophosphamide | SD | ||
| IGHG4 | SNV | Missense_Mutation | rs777067694 | c.145G>A | p.Gly49Ser | p.G49S | P01861 | IG_C_gene | tolerated(0.08) | probably_damaging(0.951) | TCGA-EA-A4BA-01 | Cervix | cervical & endocervical cancer | Female | <65 | I/II | Chemotherapy | carboplatin | CR |
| IGHG4 | SNV | Missense_Mutation | novel | c.560C>G | p.Thr187Ser | p.T187S | P01861 | IG_C_gene | tolerated(0.1) | benign(0.007) | TCGA-AA-3663-01 | Colorectum | colon adenocarcinoma | Male | <65 | I/II | Unknown | Unknown | SD |
| IGHG4 | SNV | Missense_Mutation | rs751235492 | c.800N>T | p.Pro267Leu | p.P267L | P01861 | IG_C_gene | tolerated(0.05) | benign(0.08) | TCGA-AA-3864-01 | Colorectum | colon adenocarcinoma | Male | >=65 | I/II | Unknown | Unknown | SD |
| IGHG4 | SNV | Missense_Mutation | novel | c.559A>G | p.Thr187Ala | p.T187A | P01861 | IG_C_gene | tolerated(0.11) | benign(0) | TCGA-AA-3947-01 | Colorectum | colon adenocarcinoma | Female | <65 | I/II | Unknown | Unknown | SD |
| IGHG4 | SNV | Missense_Mutation | novel | c.226T>G | p.Leu76Val | p.L76V | P01861 | IG_C_gene | tolerated(0.07) | benign(0.025) | TCGA-AA-3977-01 | Colorectum | colon adenocarcinoma | Male | >=65 | I/II | Unknown | Unknown | SD |
| IGHG4 | SNV | Missense_Mutation | novel | c.593N>G | p.Glu198Gly | p.E198G | P01861 | IG_C_gene | deleterious(0.01) | probably_damaging(1) | TCGA-CM-4743-01 | Colorectum | colon adenocarcinoma | Male | >=65 | I/II | Chemotherapy | capecitabine | SD |
| Page: 1 2 3 4 5 6 |
Top |
Related drugs of malignant transformation related genes |
| Identification of chemicals and drugs interact with genes involved in malignant transfromation |
| (DGIdb 4.0) |
| Entrez ID | Symbol | Category | Interaction Types | Drug Claim Name | Drug Name | PMIDs |
| Page: 1 |

Copyright 2023-Present -The University of Texas Health Science Center at Houston |