| Tissue | Expression Dynamics | Abbreviation |
| Breast |  | IDC: Invasive ductal carcinoma |
| DCIS: Ductal carcinoma in situ |
| Precancer(BRCA1-mut): Precancerous lesion from BRCA1 mutation carriers |
| Cervix | 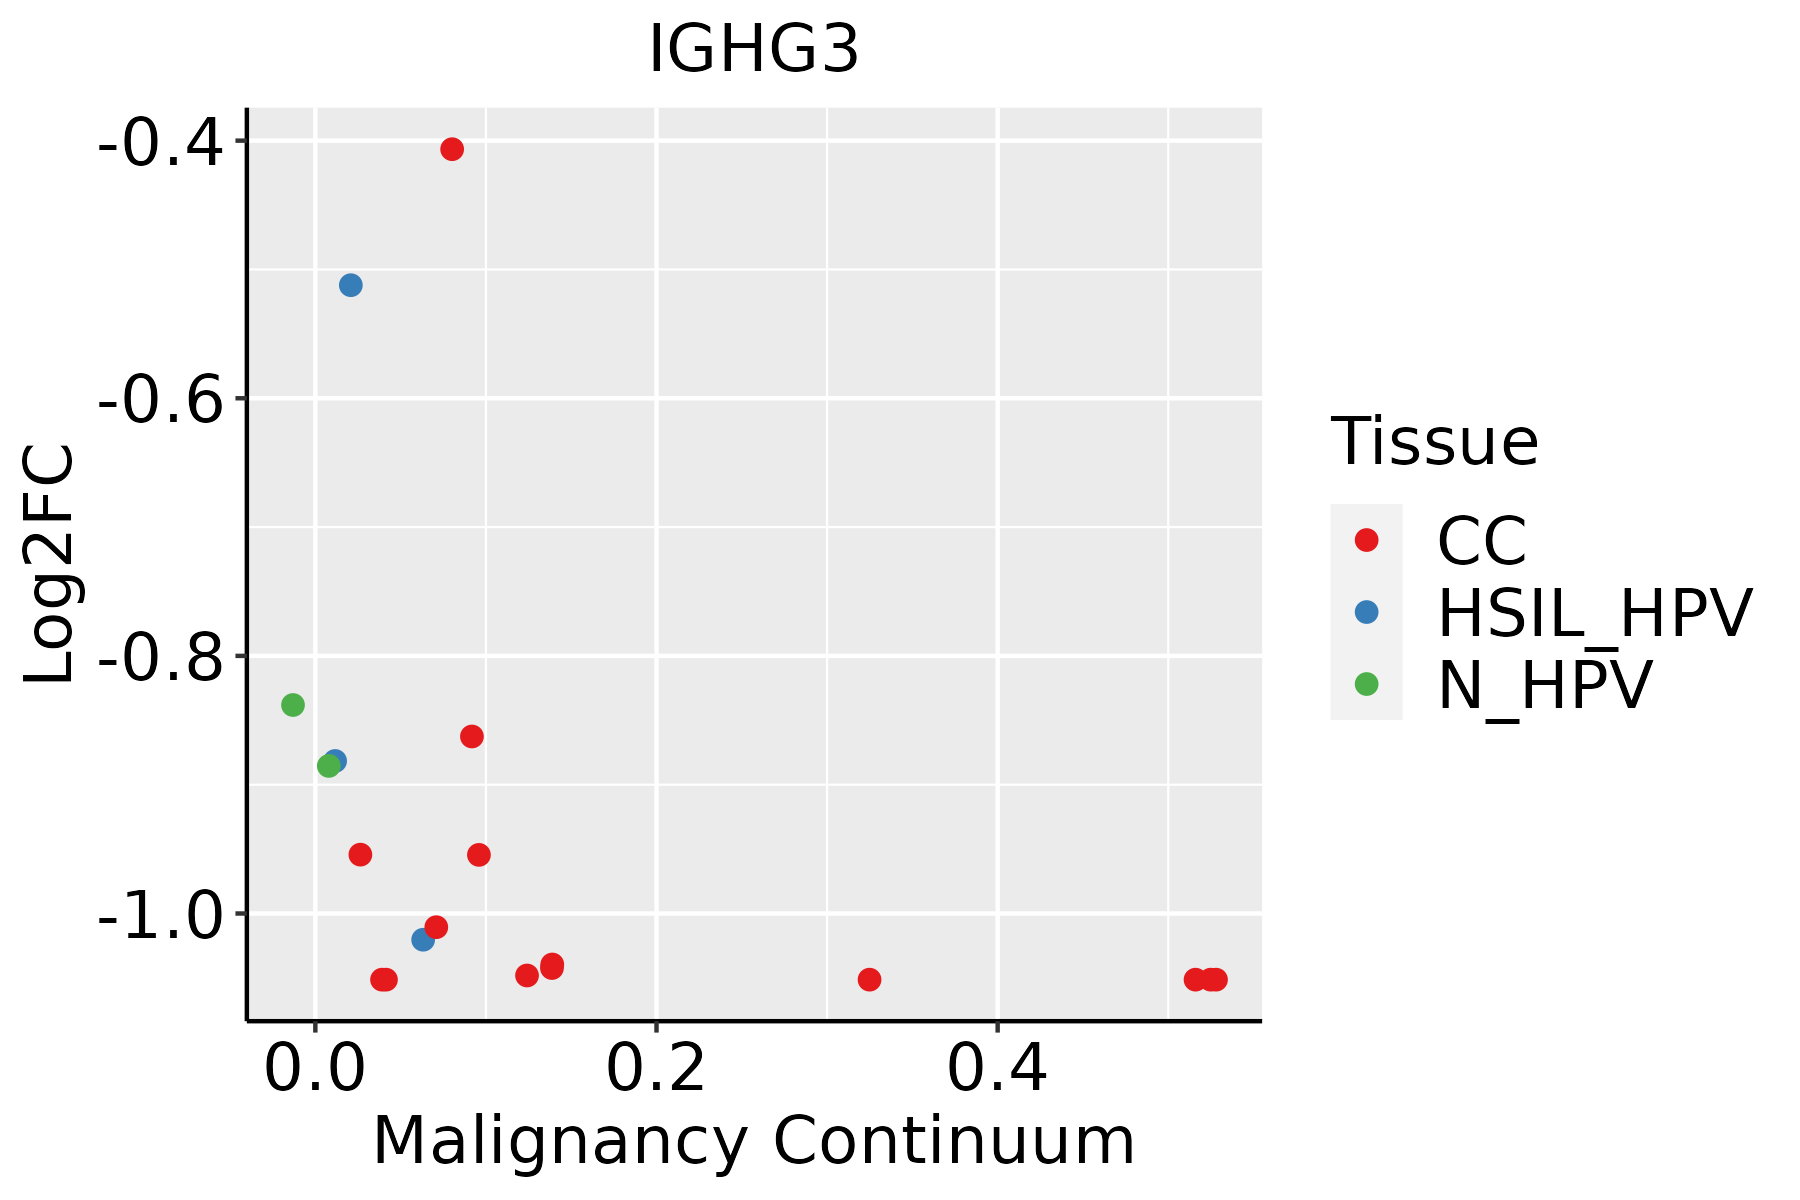 | CC: Cervix cancer |
| HSIL_HPV: HPV-infected high-grade squamous intraepithelial lesions |
| N_HPV: HPV-infected normal cervix |
| Endometrium | 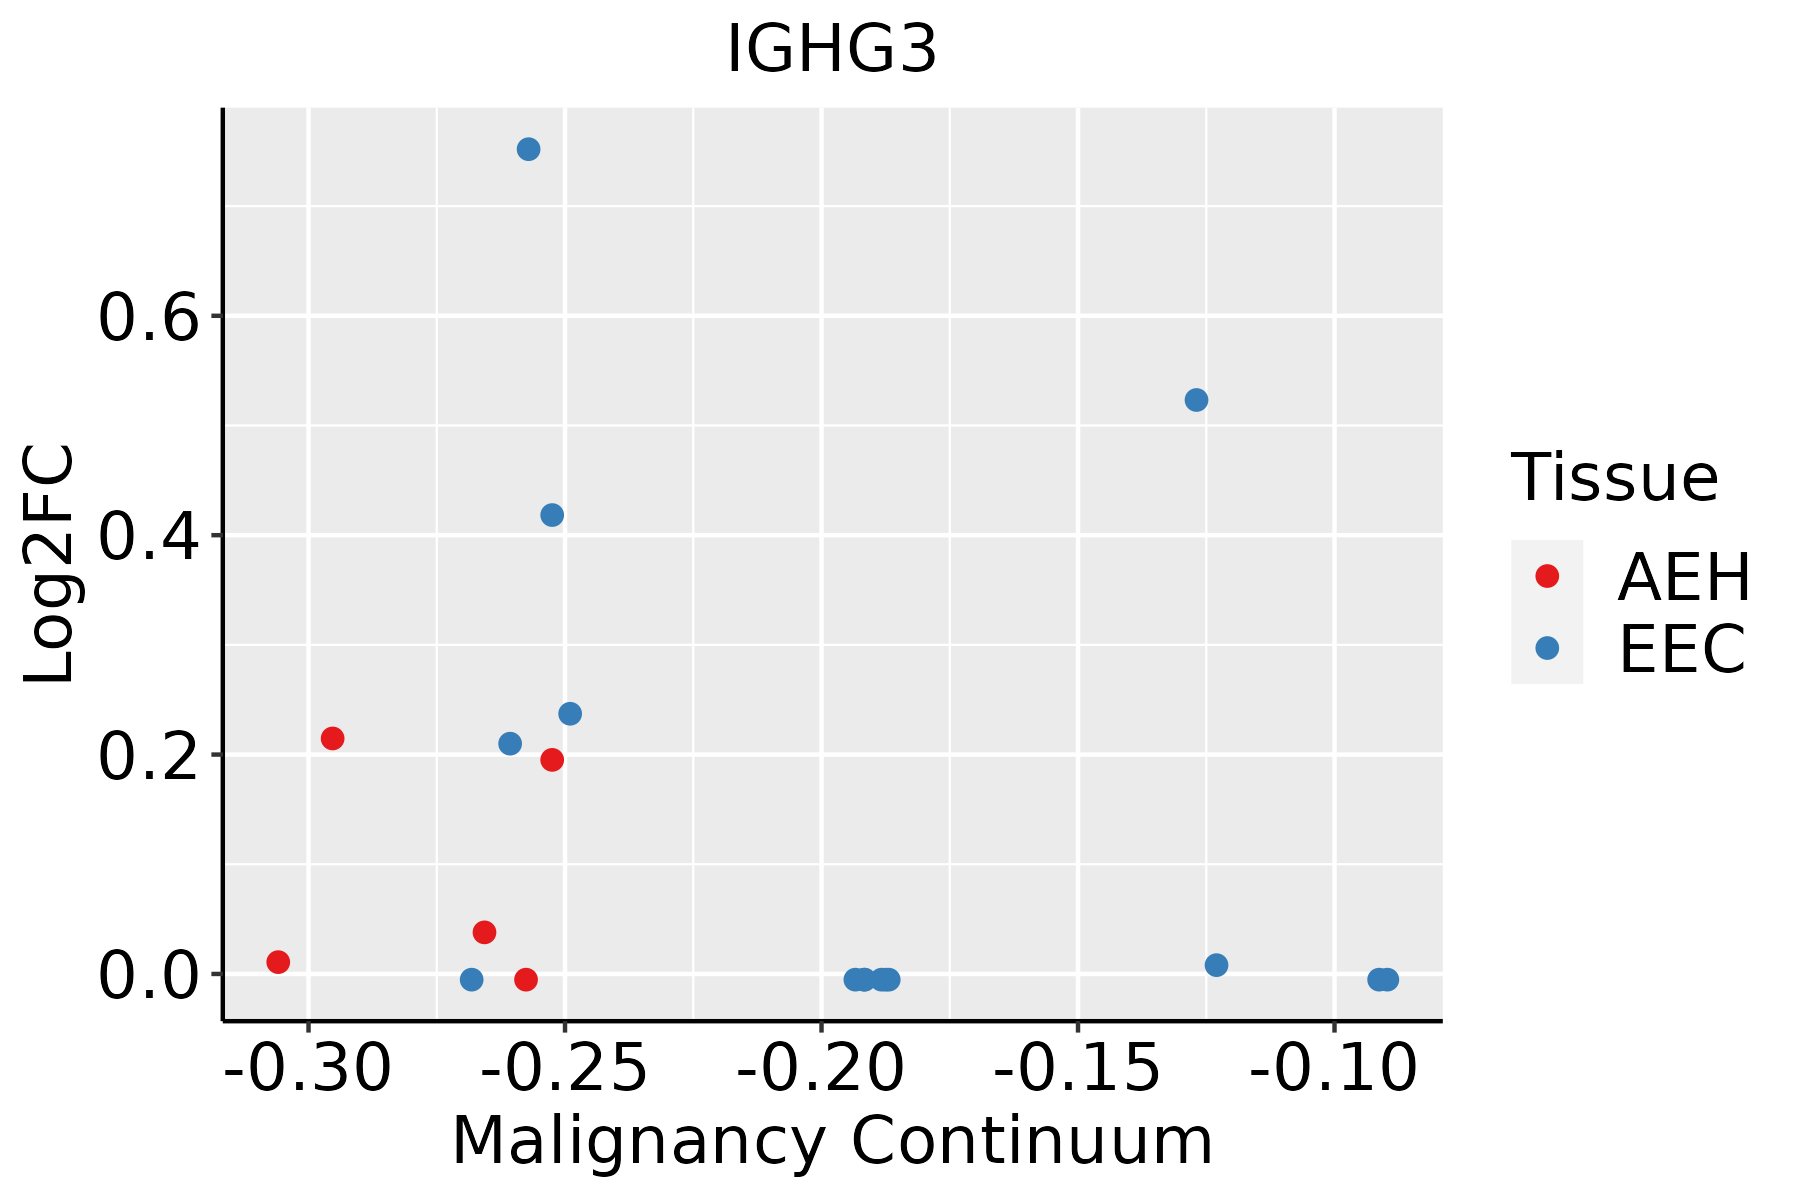 | AEH: Atypical endometrial hyperplasia |
| EEC: Endometrioid Cancer |
| GC | 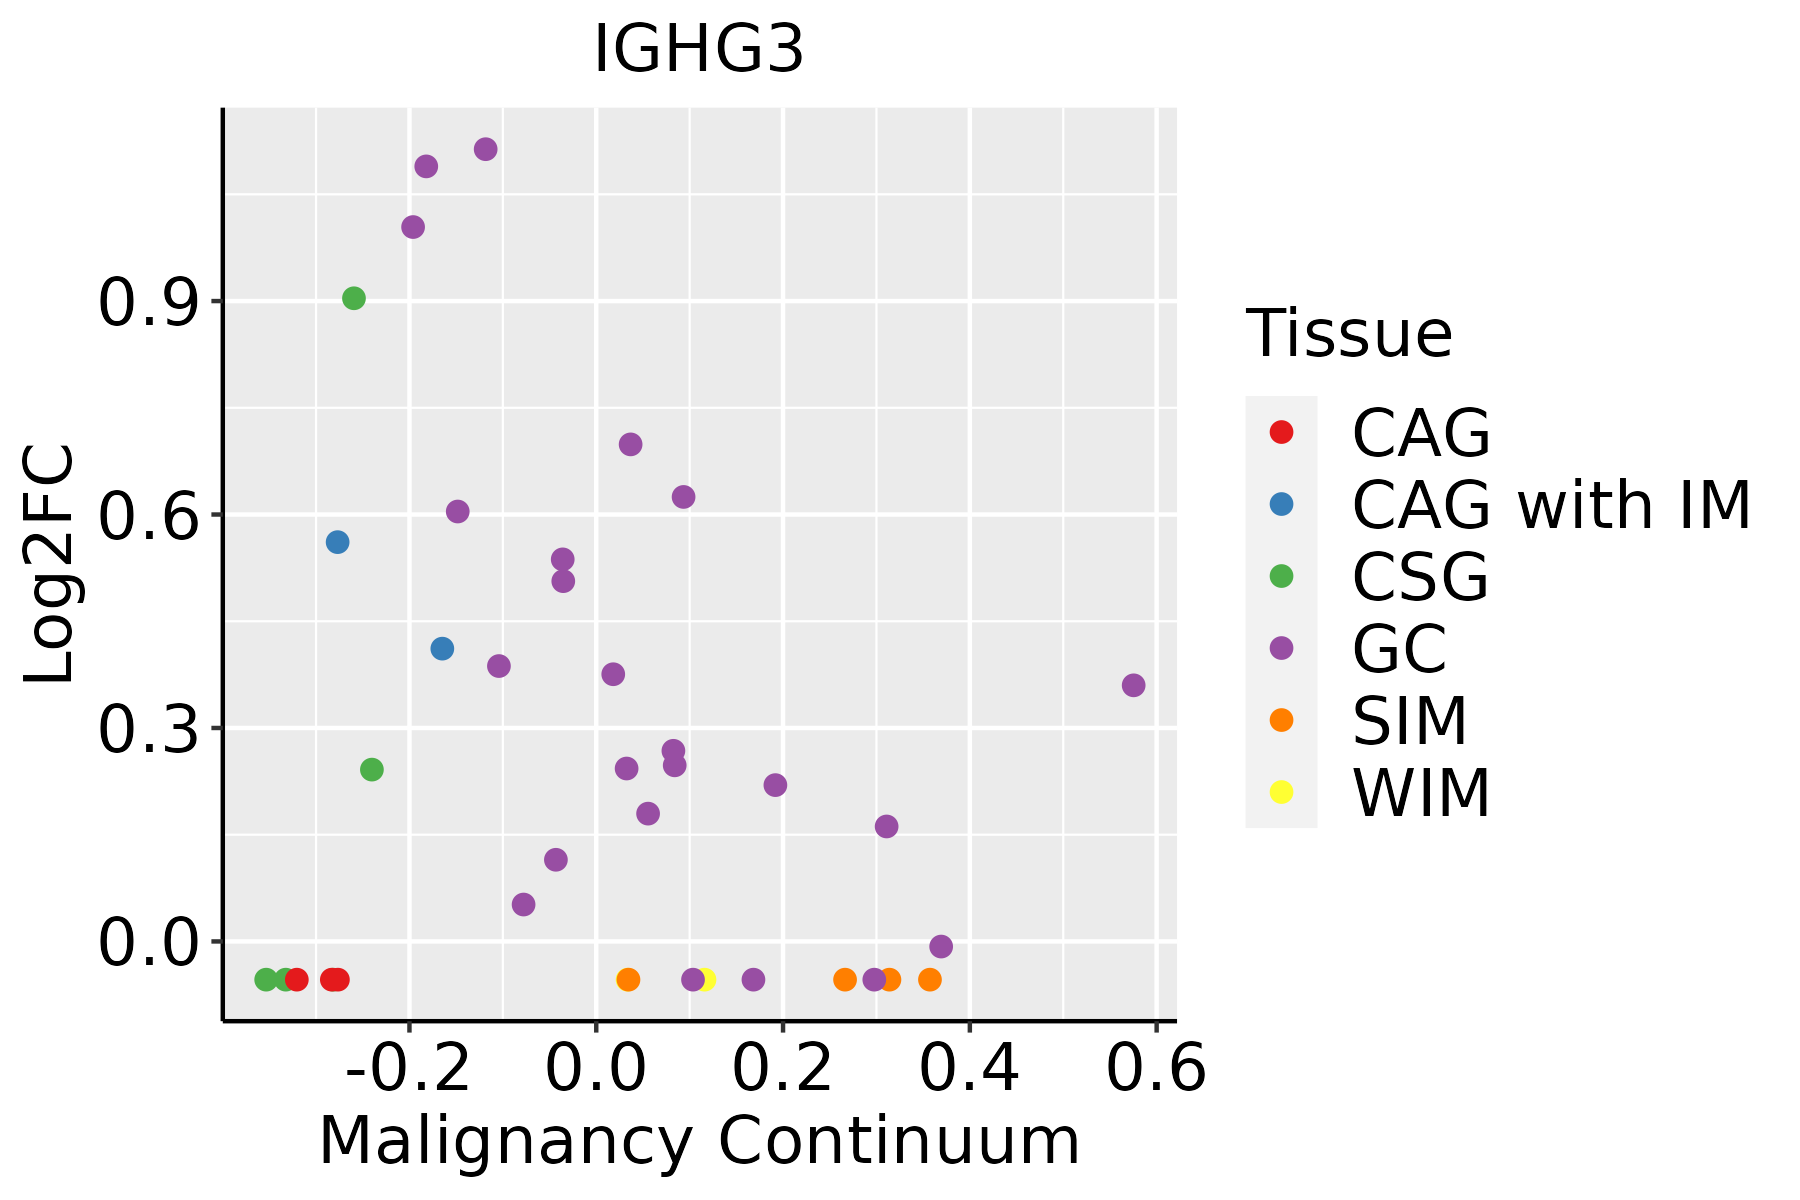 | CAG: Chronic atrophic gastritis |
| CAG with IM: Chronic atrophic gastritis with intestinal metaplasia |
| CSG: Chronic superficial gastritis |
| GC: Gastric cancer |
| SIM: Severe intestinal metaplasia |
| WIM: Wild intestinal metaplasia |
| Oral Cavity |  | EOLP: Erosive Oral lichen planus |
| LP: leukoplakia |
| NEOLP: Non-erosive oral lichen planus |
| OSCC: Oral squamous cell carcinoma |
| Thyroid | 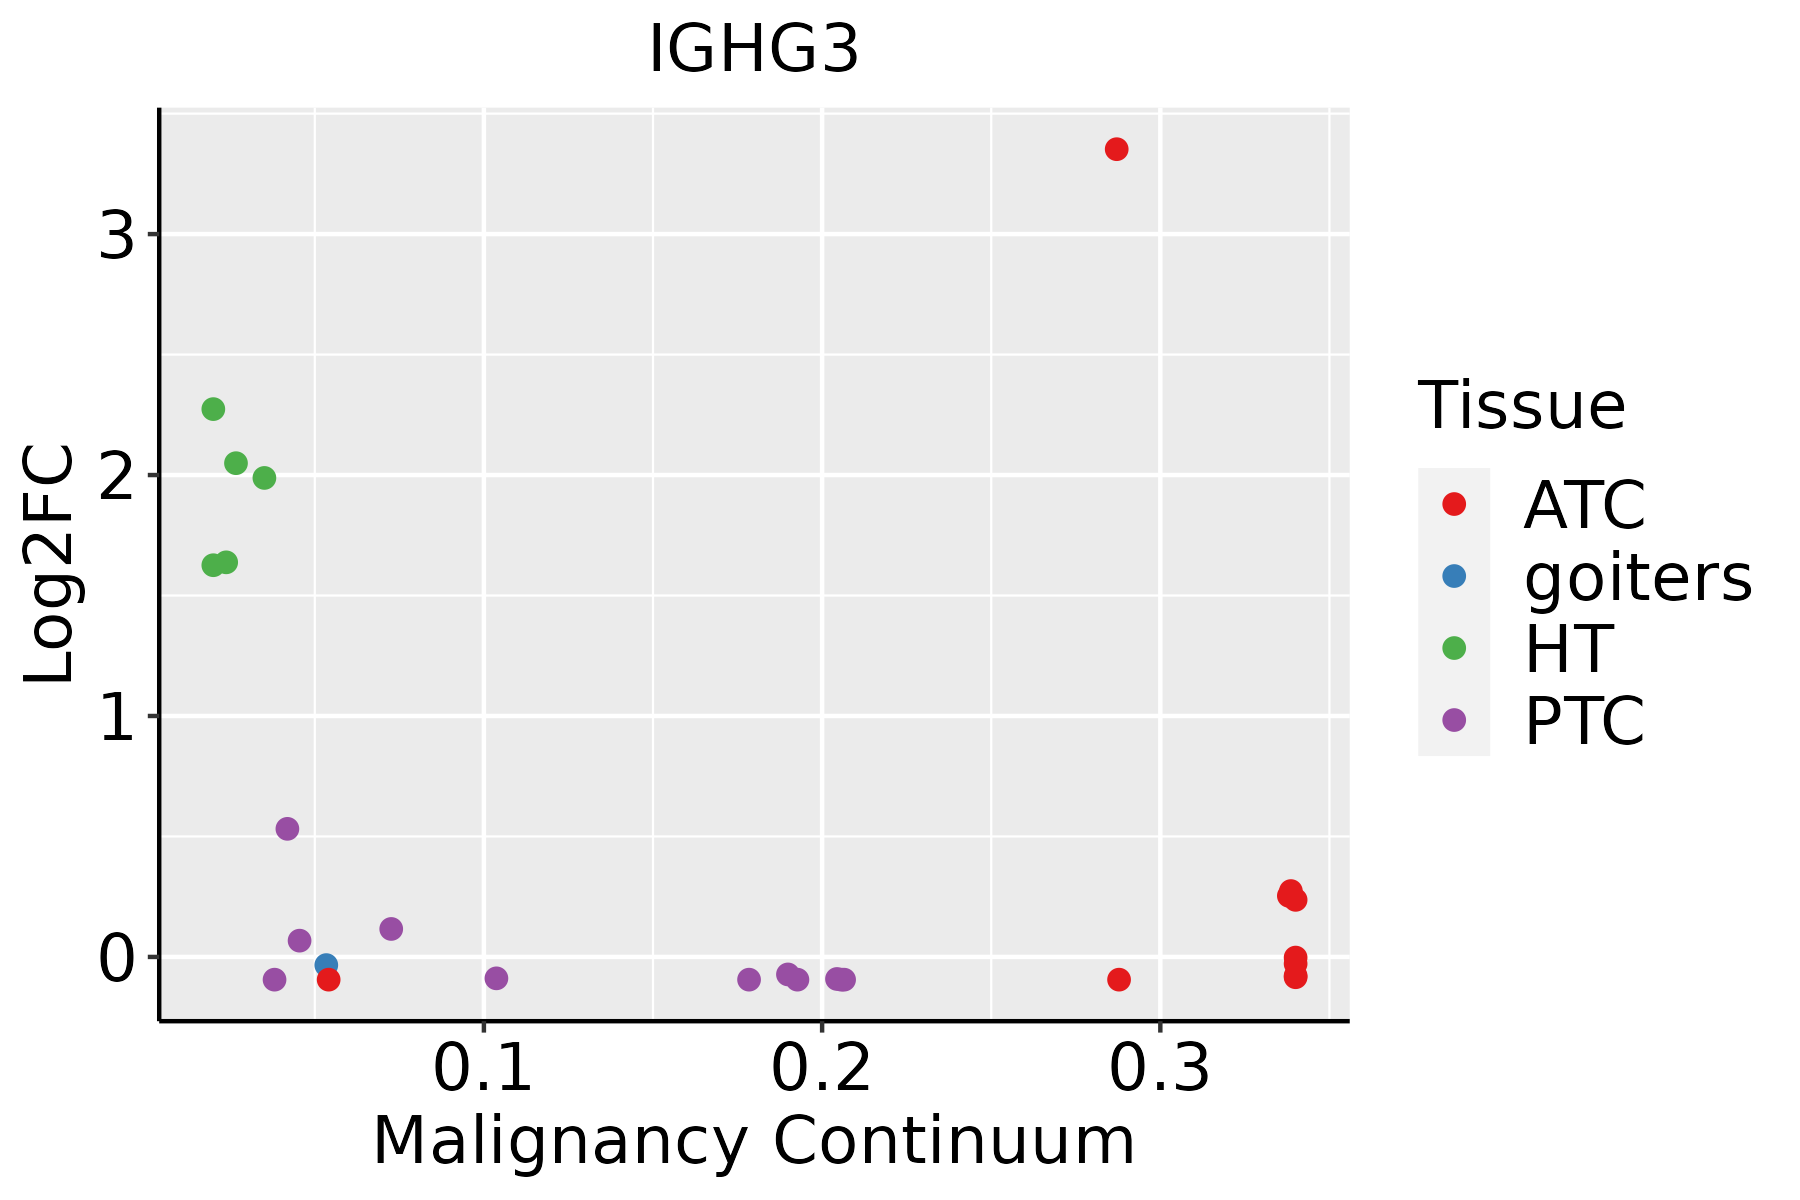 | ATC: Anaplastic thyroid cancer |
| HT: Hashimoto's thyroiditis |
| PTC: Papillary thyroid cancer |
| GO ID | Tissue | Disease Stage | Description | Gene Ratio | Bg Ratio | pvalue | p.adjust | Count |
| GO:000189511 | Breast | IDC | retina homeostasis | 15/1434 | 79/18723 | 8.62e-04 | 1.00e-02 | 15 |
| GO:00069596 | Breast | IDC | humoral immune response | 40/1434 | 317/18723 | 1.25e-03 | 1.33e-02 | 40 |
| GO:000189413 | Breast | IDC | tissue homeostasis | 34/1434 | 268/18723 | 2.54e-03 | 2.28e-02 | 34 |
| GO:00512515 | Breast | IDC | positive regulation of lymphocyte activation | 43/1434 | 362/18723 | 2.72e-03 | 2.41e-02 | 43 |
| GO:00022532 | Breast | IDC | activation of immune response | 43/1434 | 375/18723 | 5.16e-03 | 3.84e-02 | 43 |
| GO:00026966 | Breast | IDC | positive regulation of leukocyte activation | 46/1434 | 409/18723 | 5.60e-03 | 4.07e-02 | 46 |
| GO:00027644 | Cervix | CC | immune response-regulating signaling pathway | 97/2311 | 468/18723 | 1.49e-07 | 7.07e-06 | 97 |
| GO:00018949 | Cervix | CC | tissue homeostasis | 57/2311 | 268/18723 | 2.43e-05 | 4.21e-04 | 57 |
| GO:00602498 | Cervix | CC | anatomical structure homeostasis | 63/2311 | 314/18723 | 6.03e-05 | 8.68e-04 | 63 |
| GO:00022533 | Cervix | CC | activation of immune response | 72/2311 | 375/18723 | 8.26e-05 | 1.11e-03 | 72 |
| GO:0002768 | Cervix | CC | immune response-regulating cell surface receptor signaling pathway | 59/2311 | 315/18723 | 6.64e-04 | 6.11e-03 | 59 |
| GO:00026967 | Cervix | CC | positive regulation of leukocyte activation | 72/2311 | 409/18723 | 1.13e-03 | 9.31e-03 | 72 |
| GO:00512516 | Cervix | CC | positive regulation of lymphocyte activation | 65/2311 | 362/18723 | 1.15e-03 | 9.39e-03 | 65 |
| GO:00508676 | Cervix | CC | positive regulation of cell activation | 73/2311 | 420/18723 | 1.50e-03 | 1.16e-02 | 73 |
| GO:00018957 | Cervix | CC | retina homeostasis | 19/2311 | 79/18723 | 2.94e-03 | 1.94e-02 | 19 |
| GO:00024603 | Cervix | CC | adaptive immune response based on somatic recombination of immune receptors built from immunoglobulin superfamily domains | 62/2311 | 356/18723 | 3.09e-03 | 2.03e-02 | 62 |
| GO:0002443 | Cervix | CC | leukocyte mediated immunity | 73/2311 | 440/18723 | 5.01e-03 | 2.98e-02 | 73 |
| GO:0006909 | Cervix | CC | phagocytosis | 53/2311 | 308/18723 | 7.49e-03 | 4.01e-02 | 53 |
| GO:00069597 | Cervix | CC | humoral immune response | 54/2311 | 317/18723 | 8.57e-03 | 4.42e-02 | 54 |
| GO:00103243 | Cervix | CC | membrane invagination | 28/2311 | 144/18723 | 9.50e-03 | 4.72e-02 | 28 |
| Hugo Symbol | Variant Class | Variant Classification | dbSNP RS | HGVSc | HGVSp | HGVSp Short | SWISSPROT | BIOTYPE | SIFT | PolyPhen | Tumor Sample Barcode | Tissue | Histology | Sex | Age | Stage | Therapy Types | Drugs | Outcome |
| IGHG3 | SNV | Missense_Mutation | novel | c.269N>G | p.Ser90Arg | p.S90R | | IG_C_gene | deleterious(0) | probably_damaging(0.985) | TCGA-A8-A075-01 | Breast | breast invasive carcinoma | Female | <65 | I/II | Chemotherapy | epirubicin | CR |
| IGHG3 | SNV | Missense_Mutation | rs765771132 | c.132N>A | p.Ala45Thr | p.A45T | | IG_C_gene | tolerated(0.19) | benign(0.125) | TCGA-A8-A09N-01 | Breast | breast invasive carcinoma | Female | <65 | III/IV | Unknown | Unknown | SD |
| IGHG3 | SNV | Missense_Mutation | novel | c.357N>G | p.Cys120Gly | p.C120G | | IG_C_gene | tolerated(0.39) | benign(0) | TCGA-AO-A1KP-01 | Breast | breast invasive carcinoma | Female | >=65 | I/II | Chemotherapy | fluorouracil | SD |
| IGHG3 | SNV | Missense_Mutation | novel | c.280N>A | p.Val94Glu | p.V94E | | IG_C_gene | deleterious(0) | probably_damaging(0.949) | TCGA-C8-A1HJ-01 | Breast | breast invasive carcinoma | Female | <65 | I/II | Unknown | Unknown | SD |
| IGHG3 | SNV | Missense_Mutation | rs752126457 | c.597N>C | p.Asp200His | p.D200H | | IG_C_gene | tolerated(0.05) | benign(0.028) | TCGA-C5-A1M8-01 | Cervix | cervical & endocervical cancer | Female | <65 | I/II | Unknown | Unknown | SD |
| IGHG3 | SNV | Missense_Mutation | rs759037989 | c.561G>A | p.Glu188Lys | p.E188K | | IG_C_gene | tolerated(0.99) | benign(0.11) | TCGA-DS-A1OC-01 | Cervix | cervical & endocervical cancer | Female | <65 | I/II | Chemotherapy | gemcitabine | SD |
| IGHG3 | SNV | Missense_Mutation | novel | c.19N>T | p.Ser7Leu | p.S7L | | IG_C_gene | tolerated(0.08) | benign(0.146) | TCGA-UC-A7PF-01 | Cervix | cervical & endocervical cancer | Female | <65 | I/II | Unknown | Unknown | SD |
| IGHG3 | SNV | Missense_Mutation | rs748081229 | c.337G>A | p.Arg113Gln | p.R113Q | | IG_C_gene | tolerated(0.59) | benign(0.009) | TCGA-UC-A7PI-01 | Cervix | cervical & endocervical cancer | Female | <65 | I/II | Unknown | Unknown | PD |
| IGHG3 | SNV | Missense_Mutation | novel | c.195N>T | p.Ser66Cys | p.S66C | | IG_C_gene | deleterious(0) | probably_damaging(0.988) | TCGA-ZJ-AAXB-01 | Cervix | cervical & endocervical cancer | Female | <65 | I/II | Unknown | Unknown | SD |
| IGHG3 | SNV | Missense_Mutation | novel | c.828N>G | p.Gln277Glu | p.Q277E | | IG_C_gene | tolerated(0.33) | benign(0.037) | TCGA-AA-3660-01 | Colorectum | colon adenocarcinoma | Female | <65 | I/II | Unknown | Unknown | SD |


