
|
|||||
|
 | |
| |
| |
| |
| |
| |
|
Gene: IGHG1 |
Gene summary for IGHG1 |
| Gene information | Species | Human | Gene symbol | IGHG1 | Gene ID | 3500 |
| Gene name | immunoglobulin heavy constant gamma 1 (G1m marker) | |
| Gene Alias | IGHG1 | |
| Cytomap | 14q32.33 | |
| Gene Type | other | GO ID | GO:0001775 | UniProtAcc | NA |
Top |
Malignant transformation analysis |
| Identification of the aberrant gene expression in precancerous and cancerous lesions by comparing the gene expression of stem-like cells in diseased tissues with normal stem cells |
| Entrez ID | Symbol | Replicates | Species | Organ | Tissue | Adj P-value | Log2FC | Malignancy |
| 3500 | IGHG1 | GSM4909281 | Human | Breast | IDC | 3.11e-02 | 8.01e-02 | 0.21 |
| 3500 | IGHG1 | GSM4909288 | Human | Breast | IDC | 3.56e-14 | 7.24e-01 | 0.0988 |
| 3500 | IGHG1 | GSM4909290 | Human | Breast | IDC | 2.69e-93 | 1.37e+00 | 0.2096 |
| 3500 | IGHG1 | GSM4909300 | Human | Breast | IDC | 2.36e-02 | 1.71e-01 | 0.0334 |
| 3500 | IGHG1 | GSM4909304 | Human | Breast | IDC | 1.19e-32 | 4.75e-01 | 0.1636 |
| 3500 | IGHG1 | GSM4909306 | Human | Breast | IDC | 8.07e-06 | 1.39e-01 | 0.1564 |
| 3500 | IGHG1 | GSM4909308 | Human | Breast | IDC | 2.17e-10 | 2.60e-01 | 0.158 |
| 3500 | IGHG1 | GSM4909309 | Human | Breast | IDC | 3.01e-02 | 1.62e-01 | 0.0483 |
| 3500 | IGHG1 | GSM4909317 | Human | Breast | IDC | 6.20e-22 | 4.08e-01 | 0.1355 |
| 3500 | IGHG1 | M1 | Human | Breast | IDC | 4.25e-14 | 3.81e-01 | 0.1577 |
| 3500 | IGHG1 | CA_HPV_1 | Human | Cervix | CC | 3.82e-41 | -9.23e-01 | 0.0264 |
| 3500 | IGHG1 | CA_HPV_2 | Human | Cervix | CC | 8.28e-42 | -9.38e-01 | 0.0391 |
| 3500 | IGHG1 | CA_HPV_3 | Human | Cervix | CC | 6.05e-34 | -9.04e-01 | 0.0414 |
| 3500 | IGHG1 | HSIL_HPV_1 | Human | Cervix | HSIL_HPV | 2.75e-18 | -8.09e-01 | 0.0116 |
| 3500 | IGHG1 | HSIL_HPV_2 | Human | Cervix | HSIL_HPV | 7.62e-08 | -5.72e-01 | 0.0208 |
| 3500 | IGHG1 | N_HPV_1 | Human | Cervix | N_HPV | 2.37e-27 | -8.15e-01 | 0.0079 |
| 3500 | IGHG1 | N_HPV_2 | Human | Cervix | N_HPV | 1.15e-54 | -9.74e-01 | -0.0131 |
| 3500 | IGHG1 | CCI_1 | Human | Cervix | CC | 3.39e-14 | -9.77e-01 | 0.528 |
| 3500 | IGHG1 | CCI_2 | Human | Cervix | CC | 4.26e-13 | -9.77e-01 | 0.5249 |
| 3500 | IGHG1 | CCI_3 | Human | Cervix | CC | 1.32e-18 | -9.77e-01 | 0.516 |
| Page: 1 2 3 4 5 |
| Tissue | Expression Dynamics | Abbreviation |
| Breast | 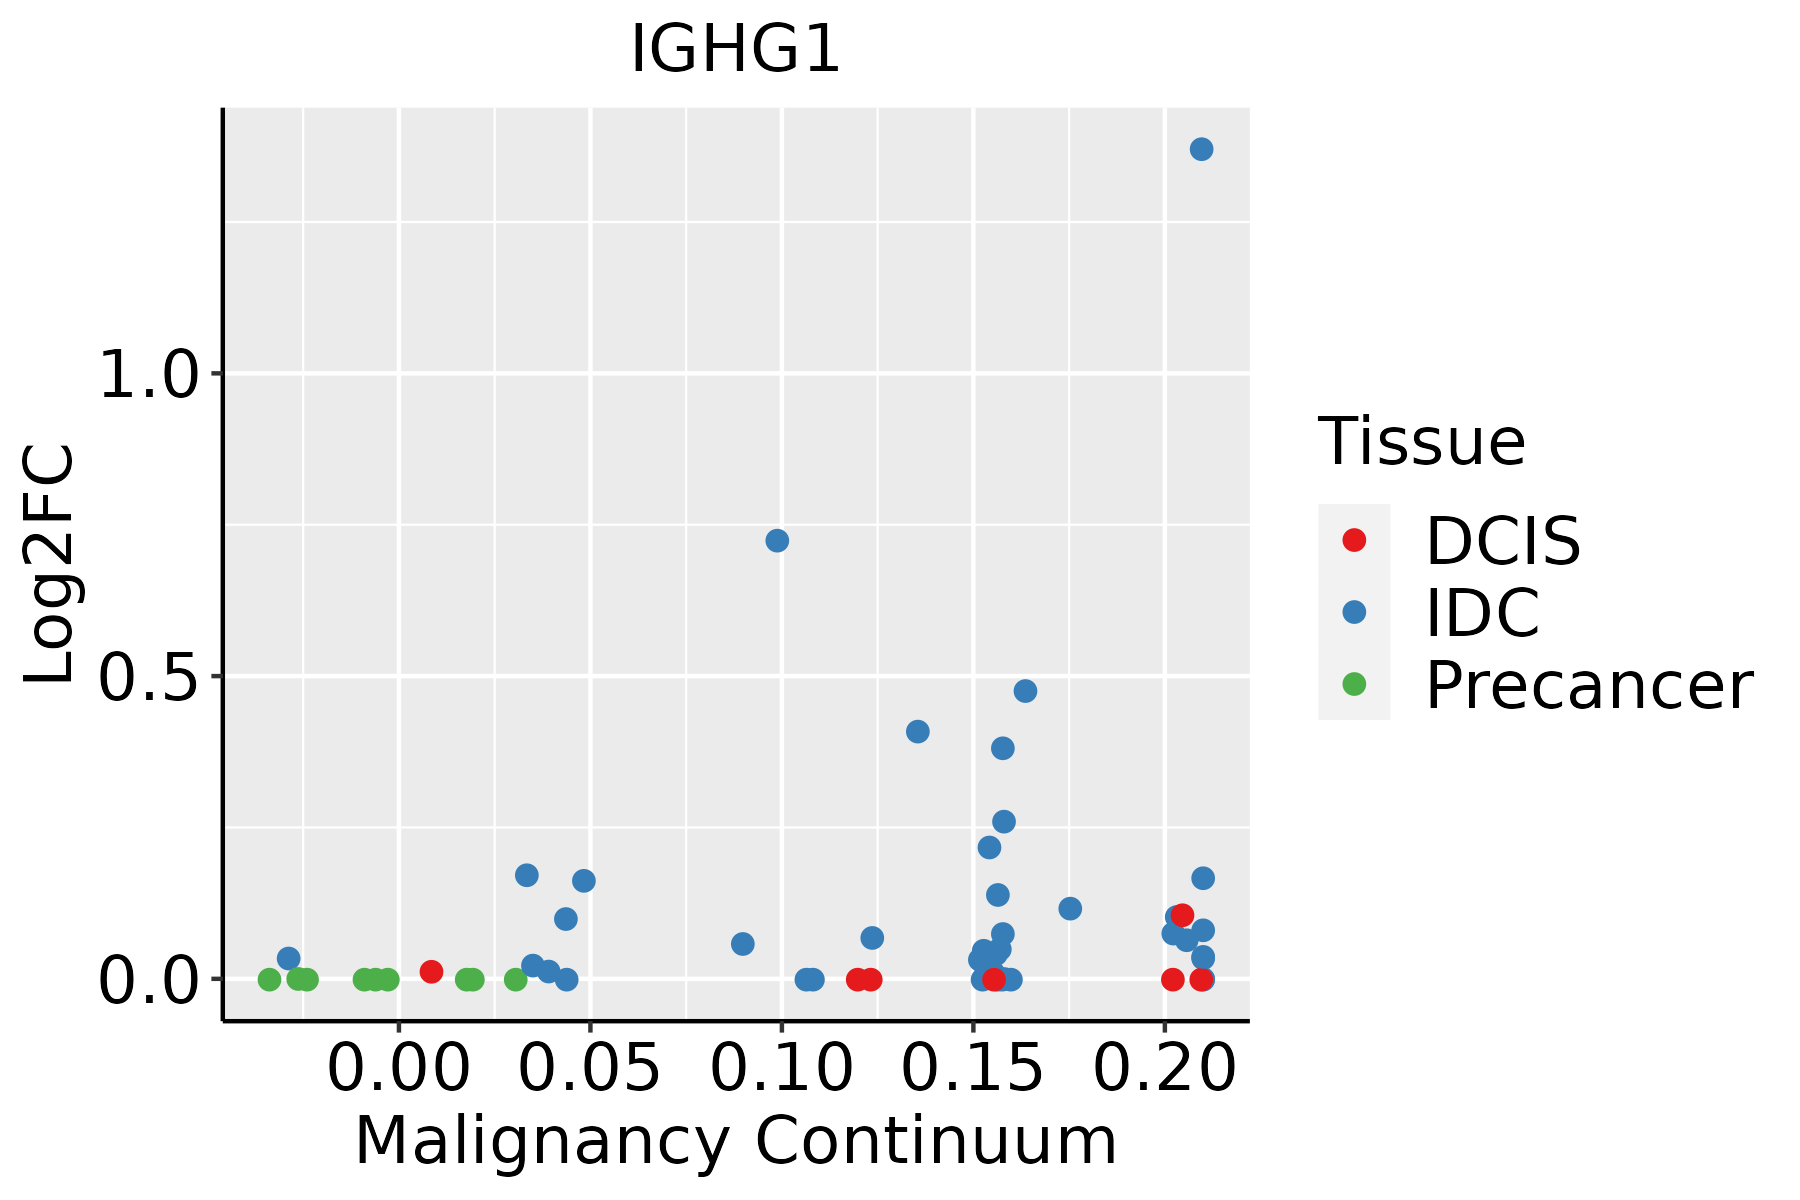 | IDC: Invasive ductal carcinoma |
| DCIS: Ductal carcinoma in situ | ||
| Precancer(BRCA1-mut): Precancerous lesion from BRCA1 mutation carriers | ||
| Cervix | 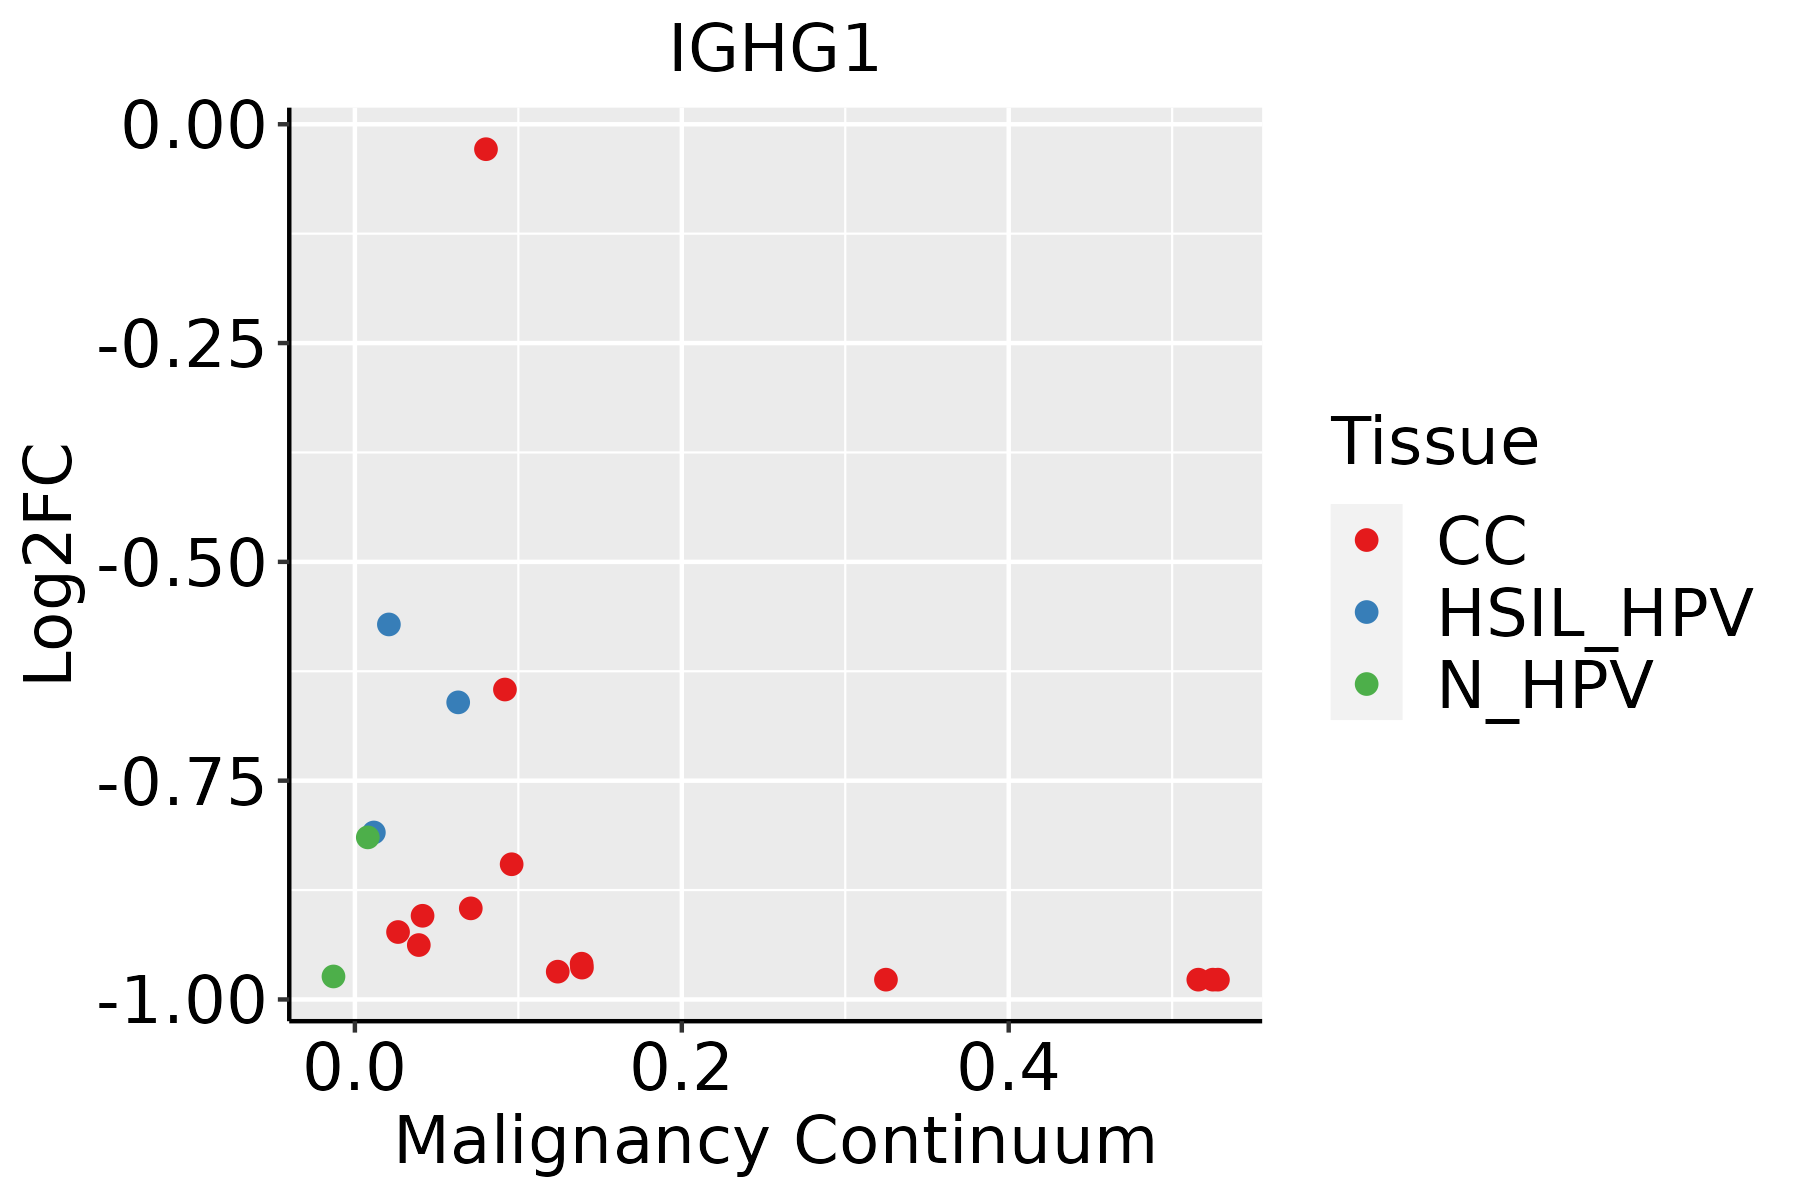 | CC: Cervix cancer |
| HSIL_HPV: HPV-infected high-grade squamous intraepithelial lesions | ||
| N_HPV: HPV-infected normal cervix | ||
| Endometrium | 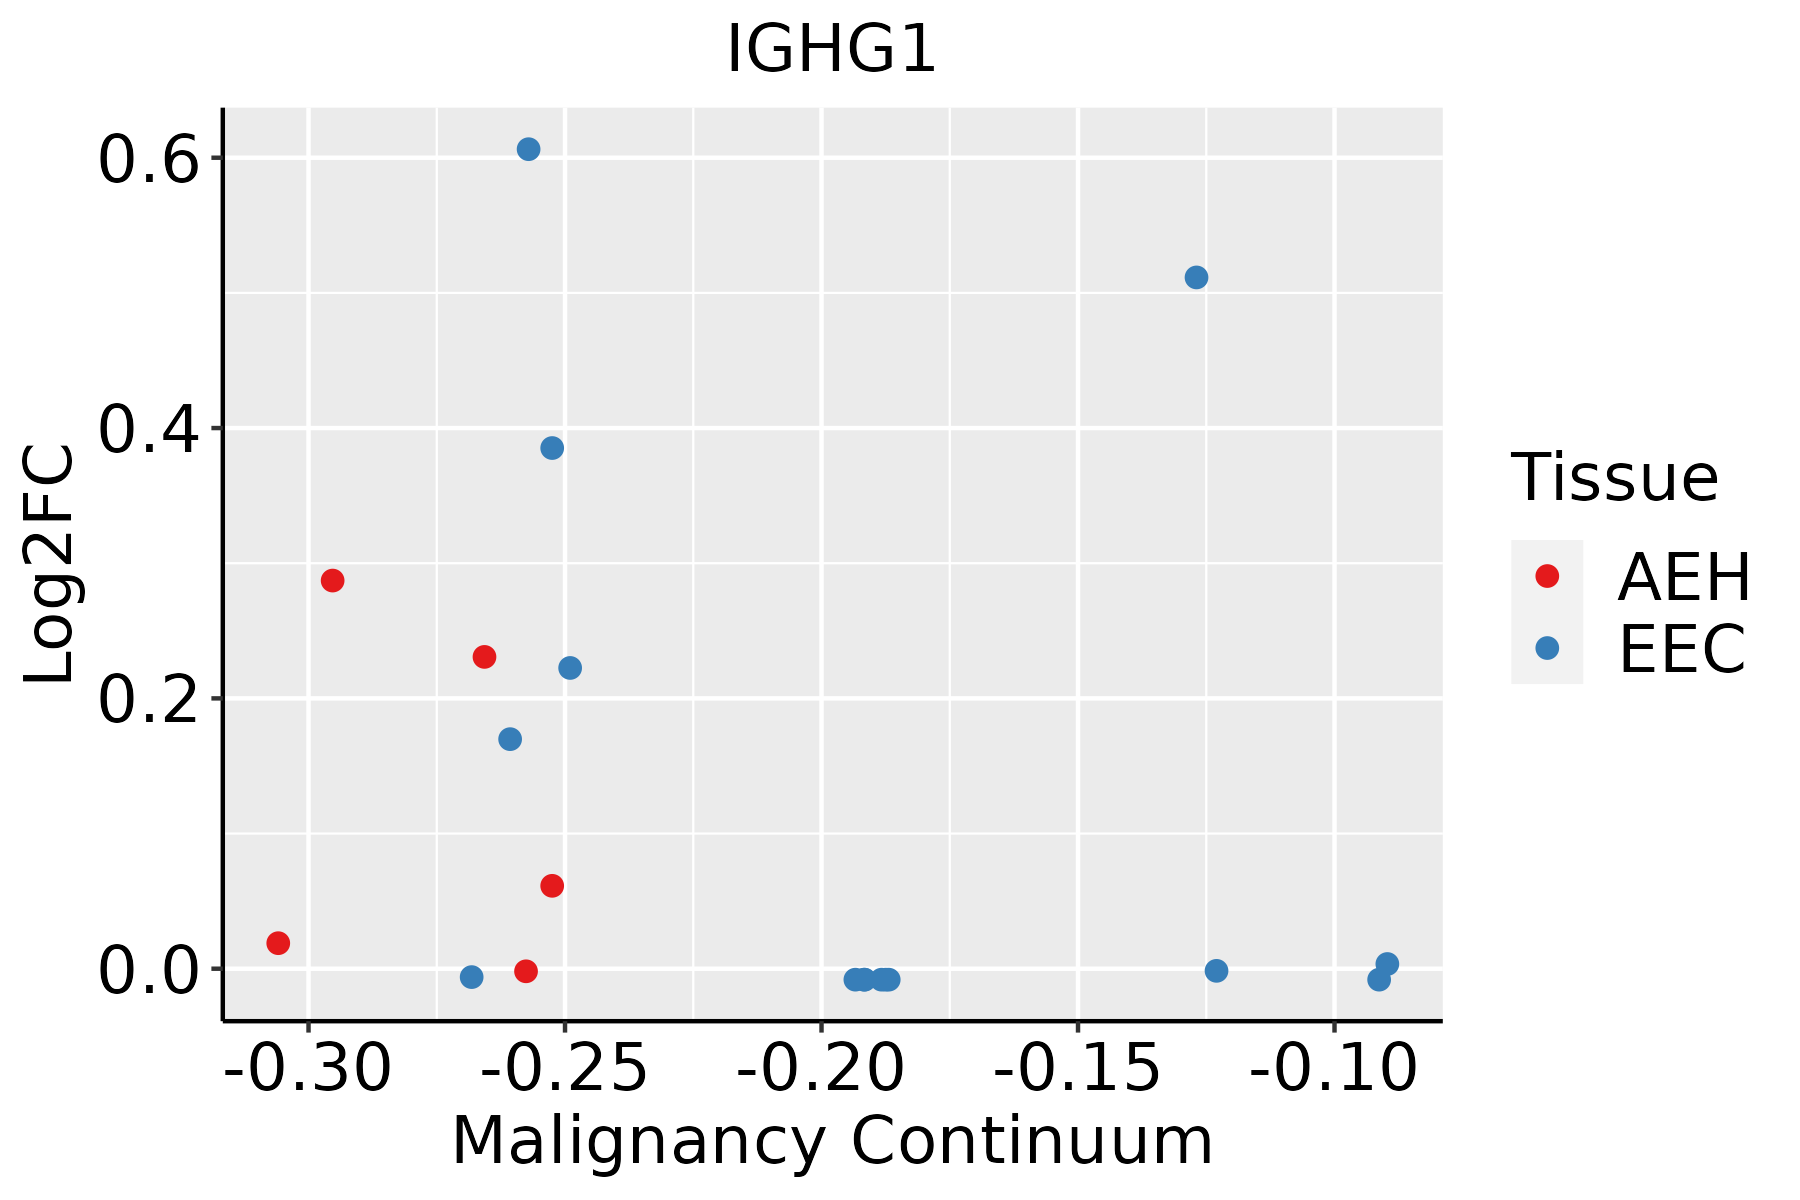 | AEH: Atypical endometrial hyperplasia |
| EEC: Endometrioid Cancer | ||
| GC | 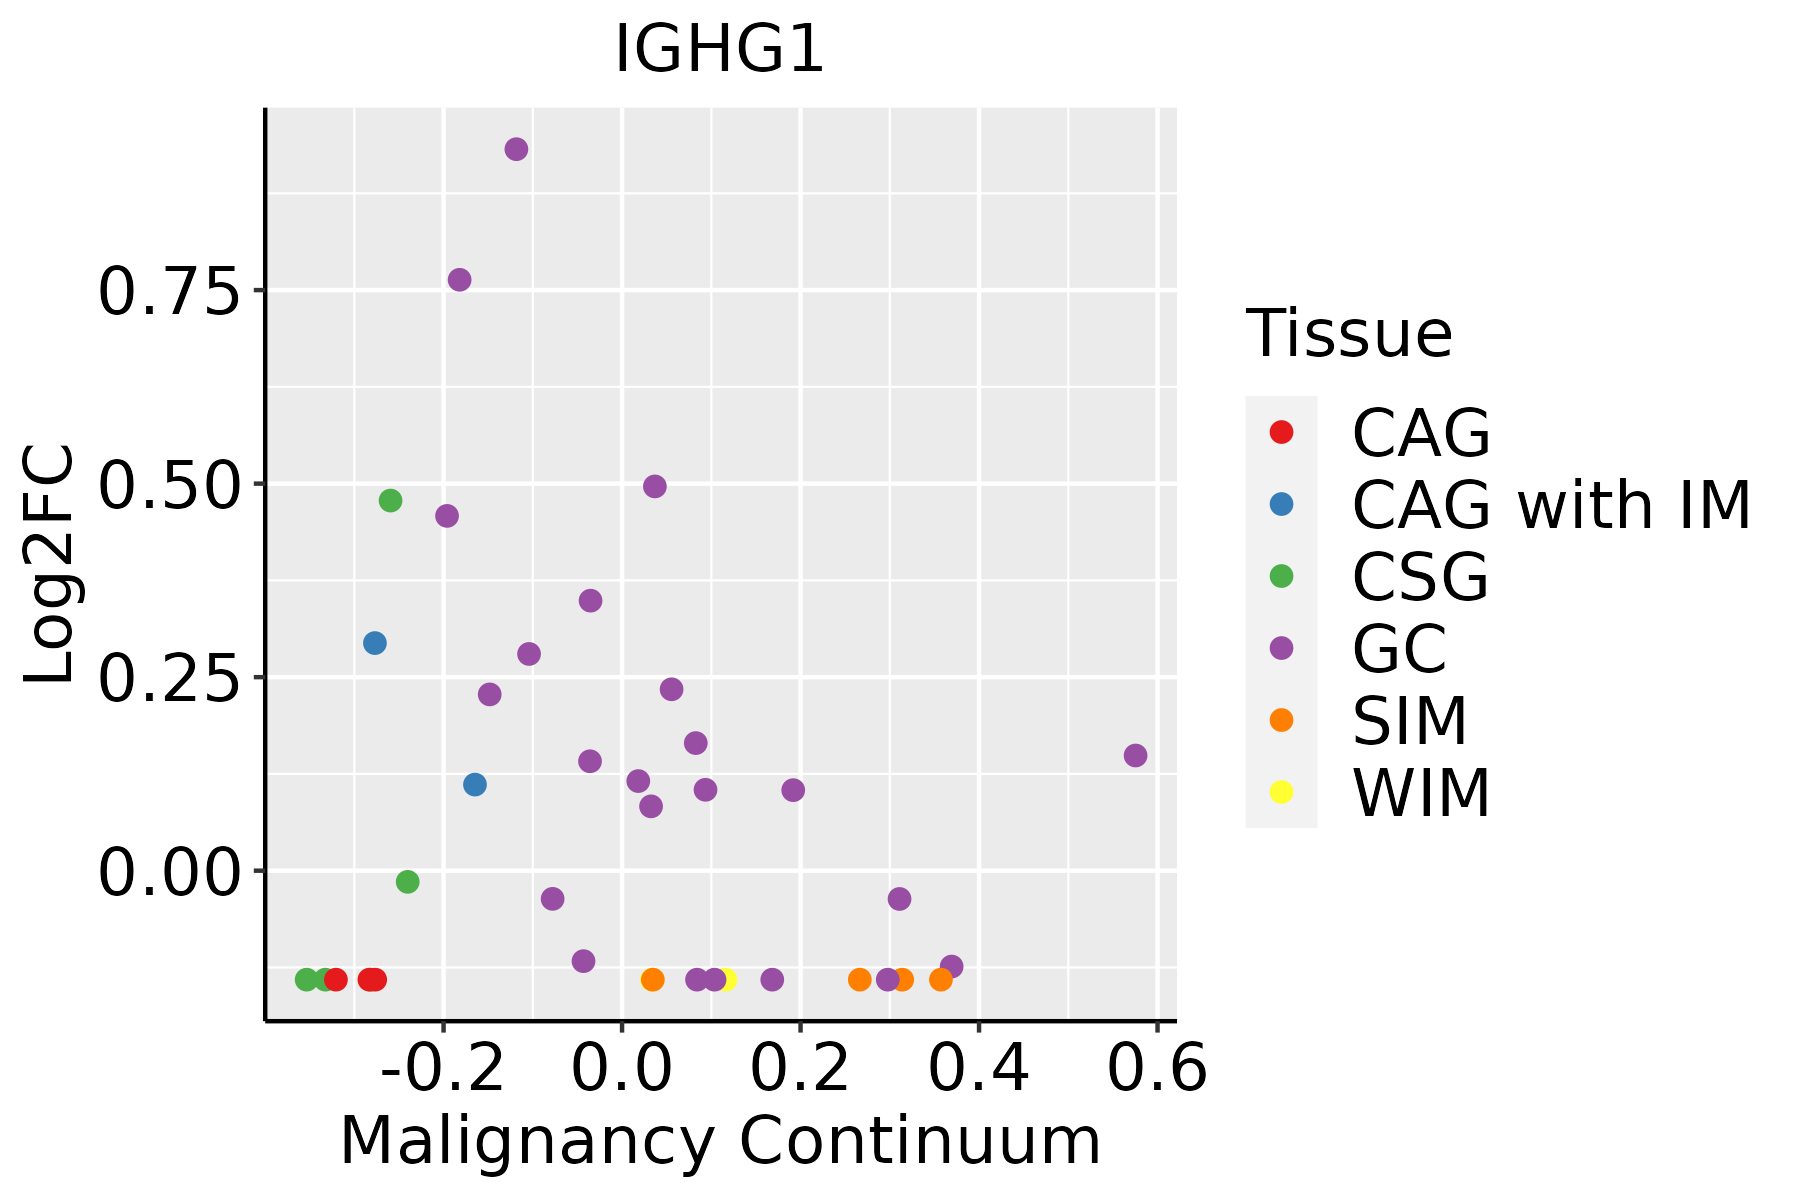 | CAG: Chronic atrophic gastritis |
| CAG with IM: Chronic atrophic gastritis with intestinal metaplasia | ||
| CSG: Chronic superficial gastritis | ||
| GC: Gastric cancer | ||
| SIM: Severe intestinal metaplasia | ||
| WIM: Wild intestinal metaplasia | ||
| Oral Cavity | 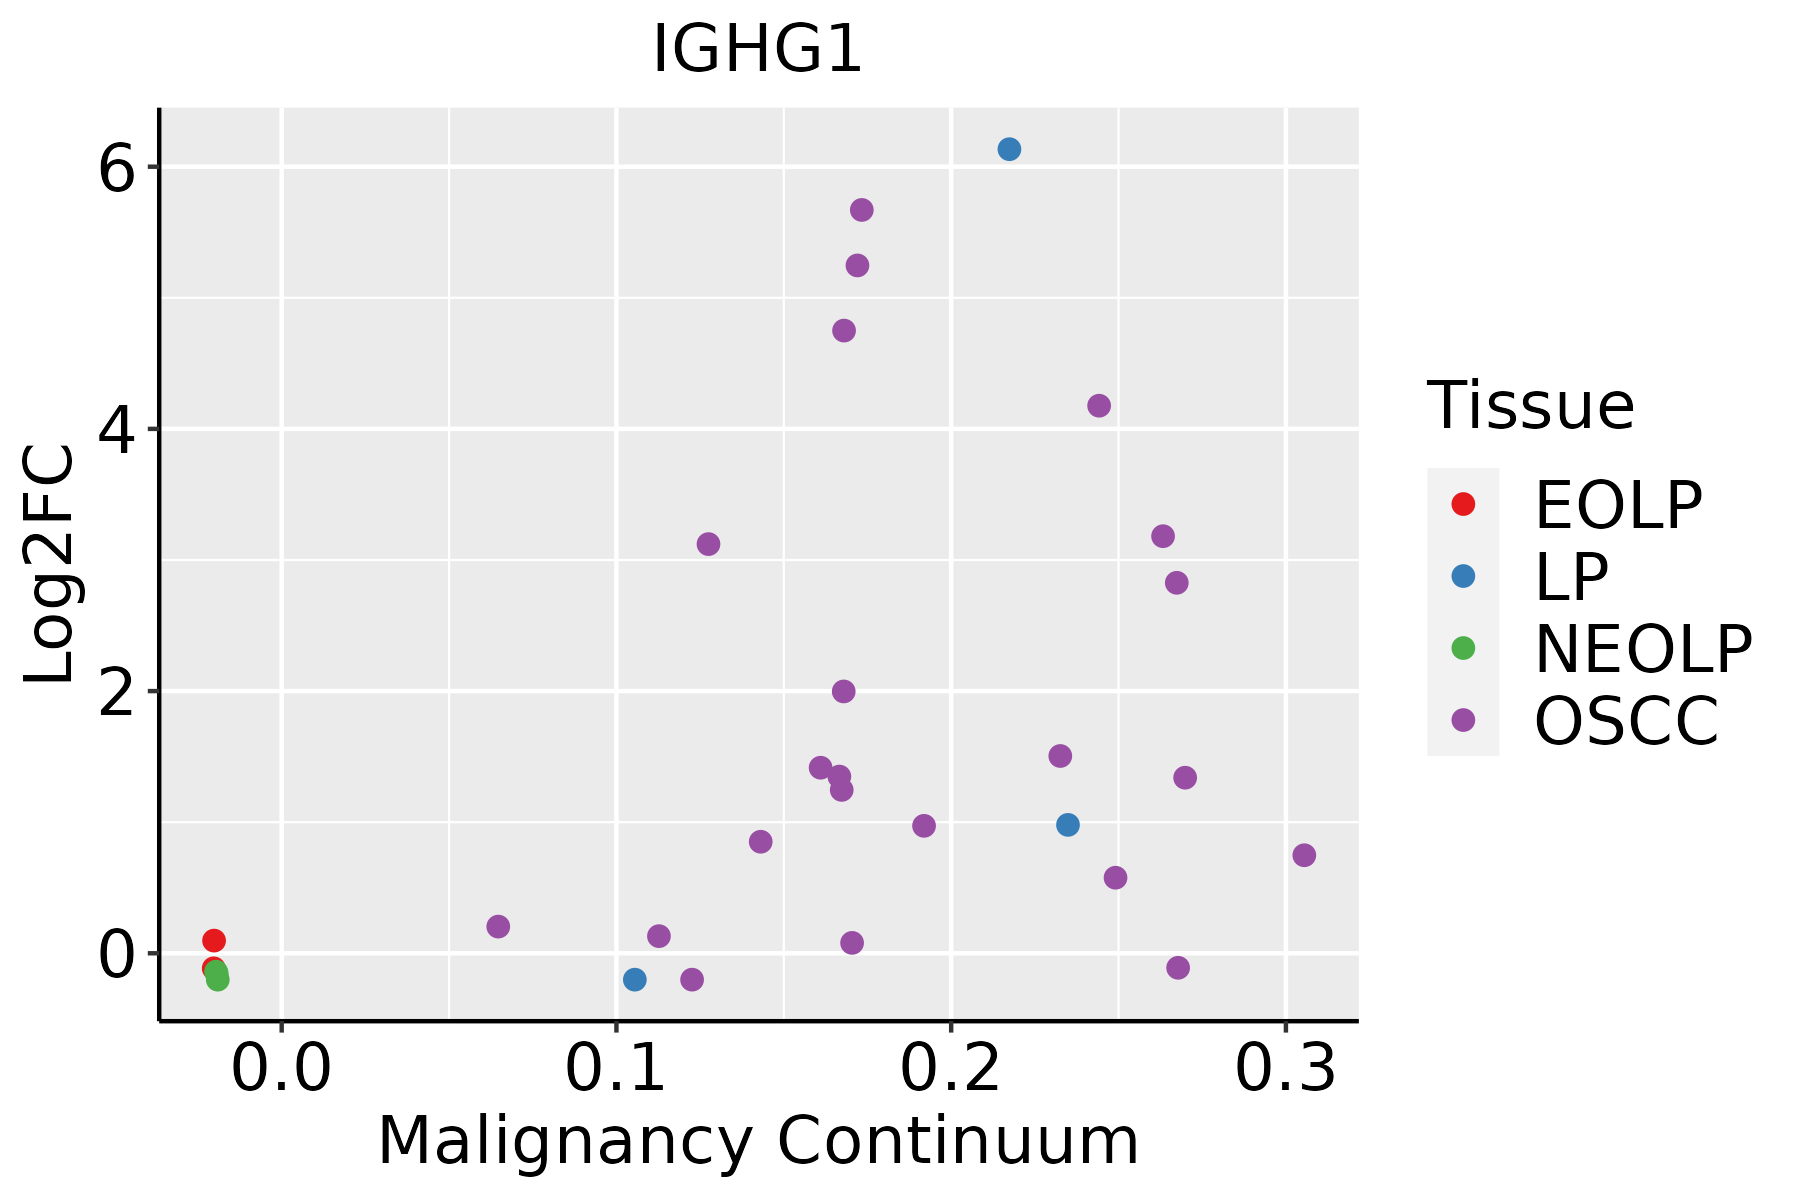 | EOLP: Erosive Oral lichen planus |
| LP: leukoplakia | ||
| NEOLP: Non-erosive oral lichen planus | ||
| OSCC: Oral squamous cell carcinoma | ||
| Prostate |  | BPH: Benign Prostatic Hyperplasia |
| Thyroid | 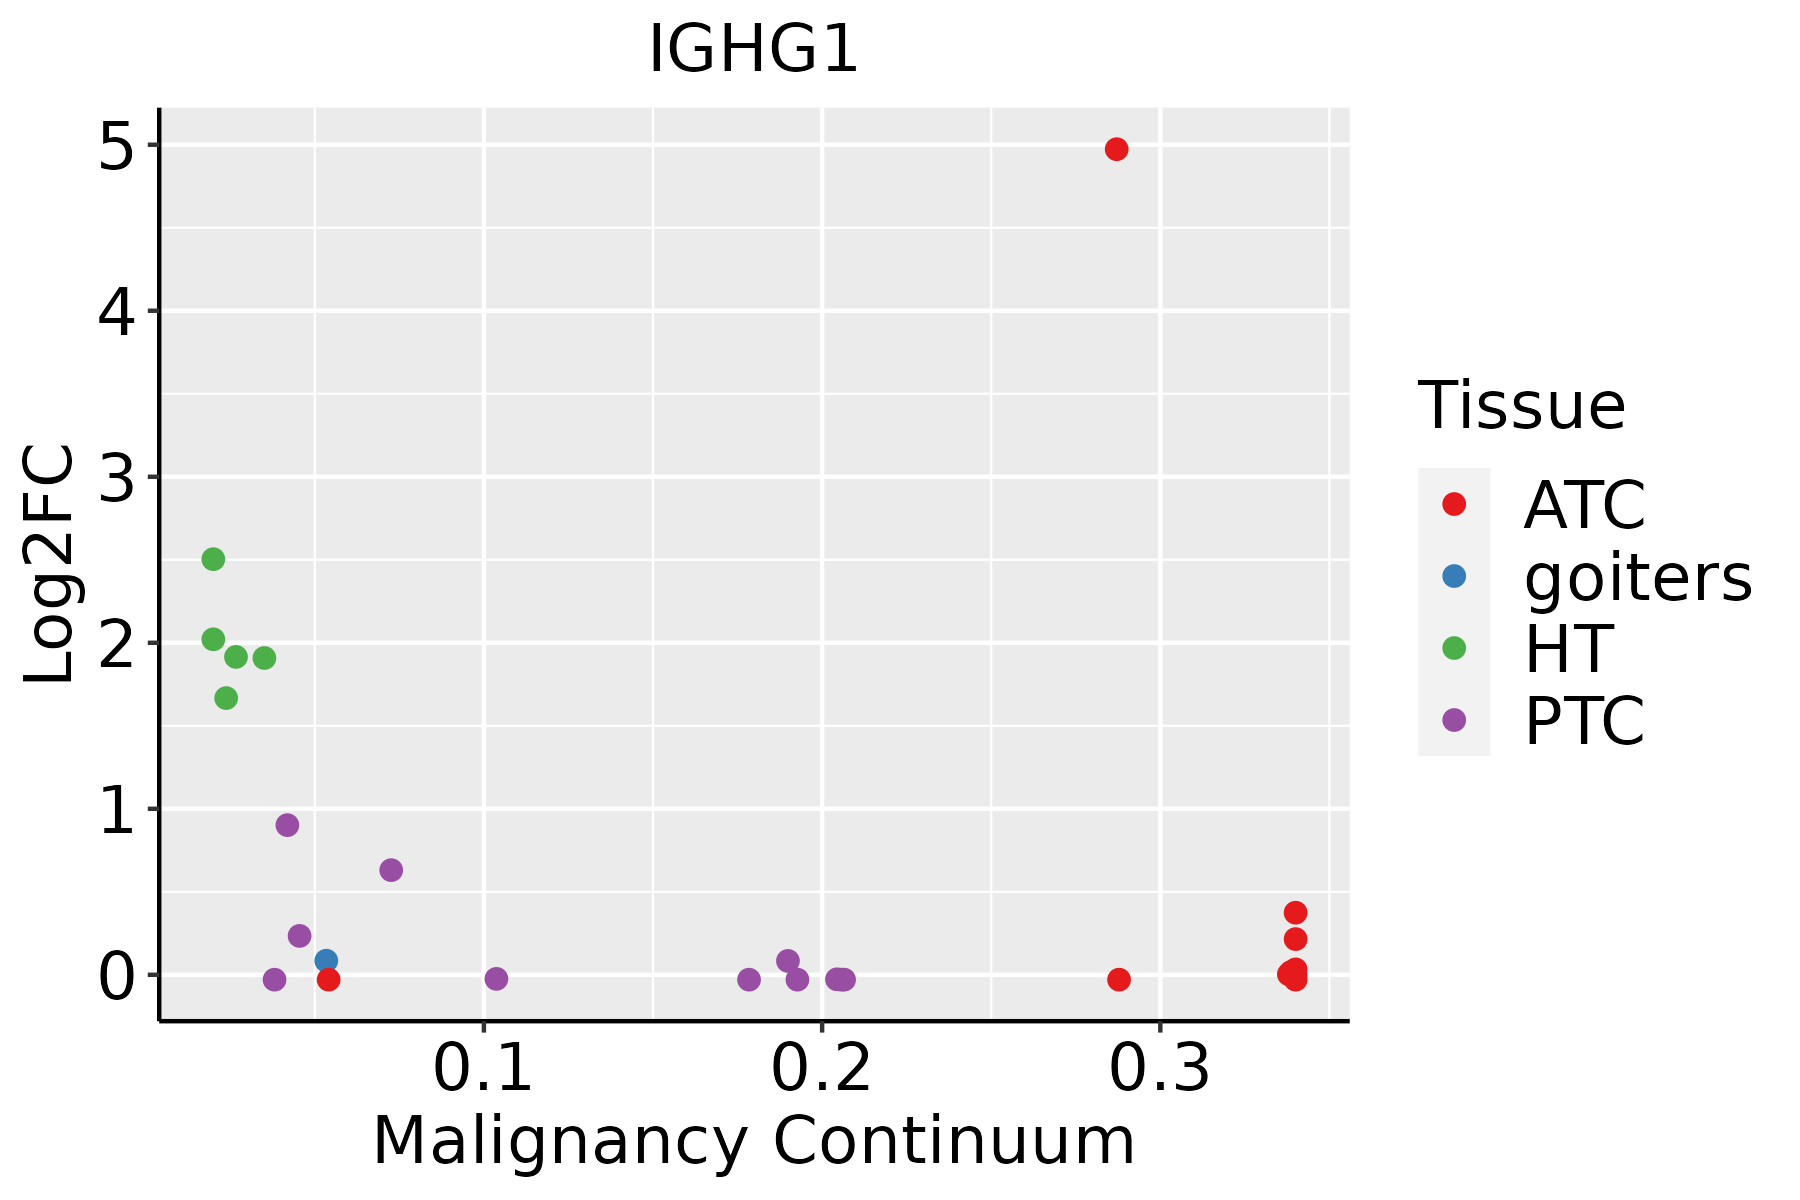 | ATC: Anaplastic thyroid cancer |
| HT: Hashimoto's thyroiditis | ||
| PTC: Papillary thyroid cancer |
| ∗log2FC in expression of this searched gene in stem-like cells from each diseased tissue sample relative to stem-like cells in normal samples in each tissue plotted against the malignancy continuum. Samples are colored based on if they are from different disease stage. |
Top |
Malignant transformation related pathway analysis |
| Find out the enriched GO biological processes and KEGG pathways involved in transition from healthy to precancer to cancer |
| Tissue | Disease Stage | Enriched GO biological Processes |
| Colorectum | AD |  |
| Colorectum | SER |  |
| Colorectum | MSS |  |
| Colorectum | MSI-H |  |
| Colorectum | FAP |  |
| ∗Top 15 enriched GO BP terms are showed in the bar plot of each disease state in each tissue. Each row represents a significant GO biological process which is colored according to the -log10(p.adjust). |
| Page: 1 2 3 4 5 6 7 8 9 |
| GO ID | Tissue | Disease Stage | Description | Gene Ratio | Bg Ratio | pvalue | p.adjust | Count |
| GO:00069596 | Breast | IDC | humoral immune response | 40/1434 | 317/18723 | 1.25e-03 | 1.33e-02 | 40 |
| GO:00512515 | Breast | IDC | positive regulation of lymphocyte activation | 43/1434 | 362/18723 | 2.72e-03 | 2.41e-02 | 43 |
| GO:00022532 | Breast | IDC | activation of immune response | 43/1434 | 375/18723 | 5.16e-03 | 3.84e-02 | 43 |
| GO:00026966 | Breast | IDC | positive regulation of leukocyte activation | 46/1434 | 409/18723 | 5.60e-03 | 4.07e-02 | 46 |
| GO:00027644 | Cervix | CC | immune response-regulating signaling pathway | 97/2311 | 468/18723 | 1.49e-07 | 7.07e-06 | 97 |
| GO:00022533 | Cervix | CC | activation of immune response | 72/2311 | 375/18723 | 8.26e-05 | 1.11e-03 | 72 |
| GO:0002768 | Cervix | CC | immune response-regulating cell surface receptor signaling pathway | 59/2311 | 315/18723 | 6.64e-04 | 6.11e-03 | 59 |
| GO:00026967 | Cervix | CC | positive regulation of leukocyte activation | 72/2311 | 409/18723 | 1.13e-03 | 9.31e-03 | 72 |
| GO:00512516 | Cervix | CC | positive regulation of lymphocyte activation | 65/2311 | 362/18723 | 1.15e-03 | 9.39e-03 | 65 |
| GO:00508676 | Cervix | CC | positive regulation of cell activation | 73/2311 | 420/18723 | 1.50e-03 | 1.16e-02 | 73 |
| GO:00024603 | Cervix | CC | adaptive immune response based on somatic recombination of immune receptors built from immunoglobulin superfamily domains | 62/2311 | 356/18723 | 3.09e-03 | 2.03e-02 | 62 |
| GO:0002443 | Cervix | CC | leukocyte mediated immunity | 73/2311 | 440/18723 | 5.01e-03 | 2.98e-02 | 73 |
| GO:0006909 | Cervix | CC | phagocytosis | 53/2311 | 308/18723 | 7.49e-03 | 4.01e-02 | 53 |
| GO:00069597 | Cervix | CC | humoral immune response | 54/2311 | 317/18723 | 8.57e-03 | 4.42e-02 | 54 |
| GO:00103243 | Cervix | CC | membrane invagination | 28/2311 | 144/18723 | 9.50e-03 | 4.72e-02 | 28 |
| GO:000695912 | Cervix | HSIL_HPV | humoral immune response | 39/737 | 317/18723 | 2.88e-10 | 7.02e-08 | 39 |
| GO:000269611 | Cervix | HSIL_HPV | positive regulation of leukocyte activation | 44/737 | 409/18723 | 1.58e-09 | 3.04e-07 | 44 |
| GO:005086711 | Cervix | HSIL_HPV | positive regulation of cell activation | 44/737 | 420/18723 | 3.59e-09 | 5.76e-07 | 44 |
| GO:005125112 | Cervix | HSIL_HPV | positive regulation of lymphocyte activation | 40/737 | 362/18723 | 4.11e-09 | 6.38e-07 | 40 |
| GO:000225312 | Cervix | HSIL_HPV | activation of immune response | 40/737 | 375/18723 | 1.12e-08 | 1.30e-06 | 40 |
| Page: 1 2 3 4 5 6 7 8 |
| Pathway ID | Tissue | Disease Stage | Description | Gene Ratio | Bg Ratio | pvalue | p.adjust | qvalue | Count |
| Page: 1 |
Top |
Cell-cell communication analysis |
| Identification of potential cell-cell interactions between two cell types and their ligand-receptor pairs for different disease states |
| Ligand | Receptor | LRpair | Pathway | Tissue | Disease Stage |
| Page: 1 |
Top |
Single-cell gene regulatory network inference analysis |
| Find out the significant the regulons (TFs) and the target genes of each regulon across cell types for different disease states |
| TF | Cell Type | Tissue | Disease Stage | Target Gene | RSS | Regulon Activity |
| ∗The dot plots of a searched regulon are shown for all cell subpopulations in each disease state of each tissue based on the regulon specific score inferred using pySCENIC and by calculating the average expression. |
| Page: 1 |
Top |
Somatic mutation of malignant transformation related genes |
| Annotation of somatic variants for genes involved in malignant transformation |
| Hugo Symbol | Variant Class | Variant Classification | dbSNP RS | HGVSc | HGVSp | HGVSp Short | SWISSPROT | BIOTYPE | SIFT | PolyPhen | Tumor Sample Barcode | Tissue | Histology | Sex | Age | Stage | Therapy Types | Drugs | Outcome |
| IGHG1 | SNV | Missense_Mutation | novel | c.460C>T | p.Pro154Ser | p.P154S | IG_C_gene | tolerated(0.14) | benign(0.033) | TCGA-VS-A8Q9-01 | Cervix | cervical & endocervical cancer | Female | >=65 | I/II | Unknown | Unknown | SD | |
| IGHG1 | SNV | Missense_Mutation | rs749070103 | c.604T>C | p.Tyr202His | p.Y202H | IG_C_gene | deleterious(0) | possibly_damaging(0.864) | TCGA-A6-6137-01 | Colorectum | colon adenocarcinoma | Male | <65 | III/IV | Chemotherapy | fluorouracil | SD | |
| IGHG1 | SNV | Missense_Mutation | novel | c.638N>T | p.Ala213Val | p.A213V | IG_C_gene | deleterious(0.04) | benign(0.054) | TCGA-A6-6652-01 | Colorectum | colon adenocarcinoma | Male | <65 | I/II | Targeted Molecular therapy | cetuximab | SD | |
| IGHG1 | SNV | Missense_Mutation | novel | c.305N>T | p.Ser102Phe | p.S102F | IG_C_gene | tolerated(0.08) | benign(0.01) | TCGA-AA-3984-01 | Colorectum | colon adenocarcinoma | Female | <65 | I/II | Unknown | Unknown | SD | |
| IGHG1 | SNV | Missense_Mutation | novel | c.956A>T | p.Tyr319Phe | p.Y319F | IG_C_gene | tolerated(0.86) | benign(0) | TCGA-CA-6716-01 | Colorectum | colon adenocarcinoma | Male | >=65 | I/II | Chemotherapy | oxaliplatin | CR | |
| IGHG1 | SNV | Missense_Mutation | novel | c.388N>T | p.Pro130Ser | p.P130S | IG_C_gene | deleterious(0.01) | possibly_damaging(0.511) | TCGA-CA-6718-01 | Colorectum | colon adenocarcinoma | Male | <65 | I/II | Unknown | Unknown | PD | |
| IGHG1 | SNV | Missense_Mutation | novel | c.304N>A | p.Ser102Thr | p.S102T | IG_C_gene | tolerated(0.63) | benign(0) | TCGA-DM-A1D8-01 | Colorectum | colon adenocarcinoma | Female | <65 | III/IV | Unknown | Unknown | SD | |
| IGHG1 | SNV | Missense_Mutation | novel | c.856T>C | p.Ser286Pro | p.S286P | IG_C_gene | deleterious(0) | possibly_damaging(0.852) | TCGA-G4-6626-01 | Colorectum | colon adenocarcinoma | Male | >=65 | I/II | Unknown | Unknown | SD | |
| IGHG1 | SNV | Missense_Mutation | rs587714136 | c.521C>T | p.Pro174Leu | p.P174L | IG_C_gene | tolerated(0.08) | benign(0.046) | TCGA-A5-A0G2-01 | Endometrium | uterine corpus endometrioid carcinoma | Female | <65 | III/IV | Unknown | Unknown | SD | |
| IGHG1 | SNV | Missense_Mutation | novel | c.305N>A | p.Ser102Tyr | p.S102Y | IG_C_gene | tolerated(0.09) | benign(0.003) | TCGA-AJ-A3BK-01 | Endometrium | uterine corpus endometrioid carcinoma | Female | >=65 | I/II | Unknown | Unknown | SD |
| Page: 1 2 3 4 5 6 |
Top |
Related drugs of malignant transformation related genes |
| Identification of chemicals and drugs interact with genes involved in malignant transfromation |
| (DGIdb 4.0) |
| Entrez ID | Symbol | Category | Interaction Types | Drug Claim Name | Drug Name | PMIDs |
| 3500 | IGHG1 | DRUGGABLE GENOME, EXTERNAL SIDE OF PLASMA MEMBRANE | IGG1 ANTIBODY |
| Page: 1 |

Copyright 2023-Present -The University of Texas Health Science Center at Houston |