
|
|||||
|
 | |
| |
| |
| |
| |
| |
|
Gene: IGHA2 |
Gene summary for IGHA2 |
| Gene information | Species | Human | Gene symbol | IGHA2 | Gene ID | 3494 |
| Gene name | immunoglobulin heavy constant alpha 2 (A2m marker) | |
| Gene Alias | A2M | |
| Cytomap | 14q32.33 | |
| Gene Type | other | GO ID | GO:0001775 | UniProtAcc | NA |
Top |
Malignant transformation analysis |
| Identification of the aberrant gene expression in precancerous and cancerous lesions by comparing the gene expression of stem-like cells in diseased tissues with normal stem cells |
| Entrez ID | Symbol | Replicates | Species | Organ | Tissue | Adj P-value | Log2FC | Malignancy |
| 3494 | IGHA2 | HTA11_2951_2000001011 | Human | Colorectum | AD | 5.85e-14 | 8.91e-01 | 0.0216 |
| 3494 | IGHA2 | HTA11_347_2000001011 | Human | Colorectum | AD | 1.65e-18 | 4.22e-01 | -0.1954 |
| 3494 | IGHA2 | HTA11_3361_2000001011 | Human | Colorectum | AD | 2.77e-05 | 3.41e-01 | -0.1207 |
| 3494 | IGHA2 | HTA11_83_2000001011 | Human | Colorectum | SER | 4.31e-04 | 4.00e-01 | -0.1526 |
| 3494 | IGHA2 | HTA11_1391_2000001011 | Human | Colorectum | AD | 3.44e-02 | 2.29e-01 | -0.059 |
| 3494 | IGHA2 | HTA11_546_2000001011 | Human | Colorectum | AD | 2.25e-02 | 1.06e+00 | -0.0842 |
| 3494 | IGHA2 | HTA11_7663_2000001011 | Human | Colorectum | SER | 8.52e-11 | 8.42e-01 | 0.0131 |
| 3494 | IGHA2 | HTA11_99999970781_79442 | Human | Colorectum | MSS | 3.61e-02 | -1.43e-01 | 0.294 |
| 3494 | IGHA2 | HTA11_99999974143_84620 | Human | Colorectum | MSS | 3.61e-02 | -1.43e-01 | 0.3005 |
| 3494 | IGHA2 | A002-C-203 | Human | Colorectum | FAP | 3.85e-03 | -1.43e-01 | 0.2786 |
| 3494 | IGHA2 | A001-C-108 | Human | Colorectum | FAP | 3.61e-02 | -1.30e-01 | -0.0272 |
| 3494 | IGHA2 | A002-C-021 | Human | Colorectum | FAP | 1.82e-03 | -1.36e-01 | 0.1171 |
| 3494 | IGHA2 | A001-C-104 | Human | Colorectum | FAP | 1.82e-03 | -1.39e-01 | 0.0184 |
| 3494 | IGHA2 | A001-C-014 | Human | Colorectum | FAP | 1.71e-02 | -1.43e-01 | 0.0135 |
| 3494 | IGHA2 | A002-C-016 | Human | Colorectum | FAP | 8.13e-03 | -1.43e-01 | 0.0521 |
| 3494 | IGHA2 | A001-C-203 | Human | Colorectum | FAP | 3.85e-03 | -1.43e-01 | -0.0481 |
| 3494 | IGHA2 | A002-C-116 | Human | Colorectum | FAP | 3.85e-03 | -1.43e-01 | -0.0452 |
| 3494 | IGHA2 | F034 | Human | Colorectum | FAP | 3.85e-03 | -1.43e-01 | -0.0665 |
| 3494 | IGHA2 | F072B | Human | Colorectum | FAP | 1.82e-03 | -1.43e-01 | 0.257 |
| 3494 | IGHA2 | CRC-1-8810 | Human | Colorectum | CRC | 1.82e-03 | -1.43e-01 | 0.6257 |
| Page: 1 2 3 |
| Tissue | Expression Dynamics | Abbreviation |
| Colorectum (GSE201348) |  | FAP: Familial adenomatous polyposis |
| CRC: Colorectal cancer | ||
| Colorectum (HTA11) |  | AD: Adenomas |
| SER: Sessile serrated lesions | ||
| MSI-H: Microsatellite-high colorectal cancer | ||
| MSS: Microsatellite stable colorectal cancer | ||
| GC |  | CAG: Chronic atrophic gastritis |
| CAG with IM: Chronic atrophic gastritis with intestinal metaplasia | ||
| CSG: Chronic superficial gastritis | ||
| GC: Gastric cancer | ||
| SIM: Severe intestinal metaplasia | ||
| WIM: Wild intestinal metaplasia | ||
| Oral Cavity | 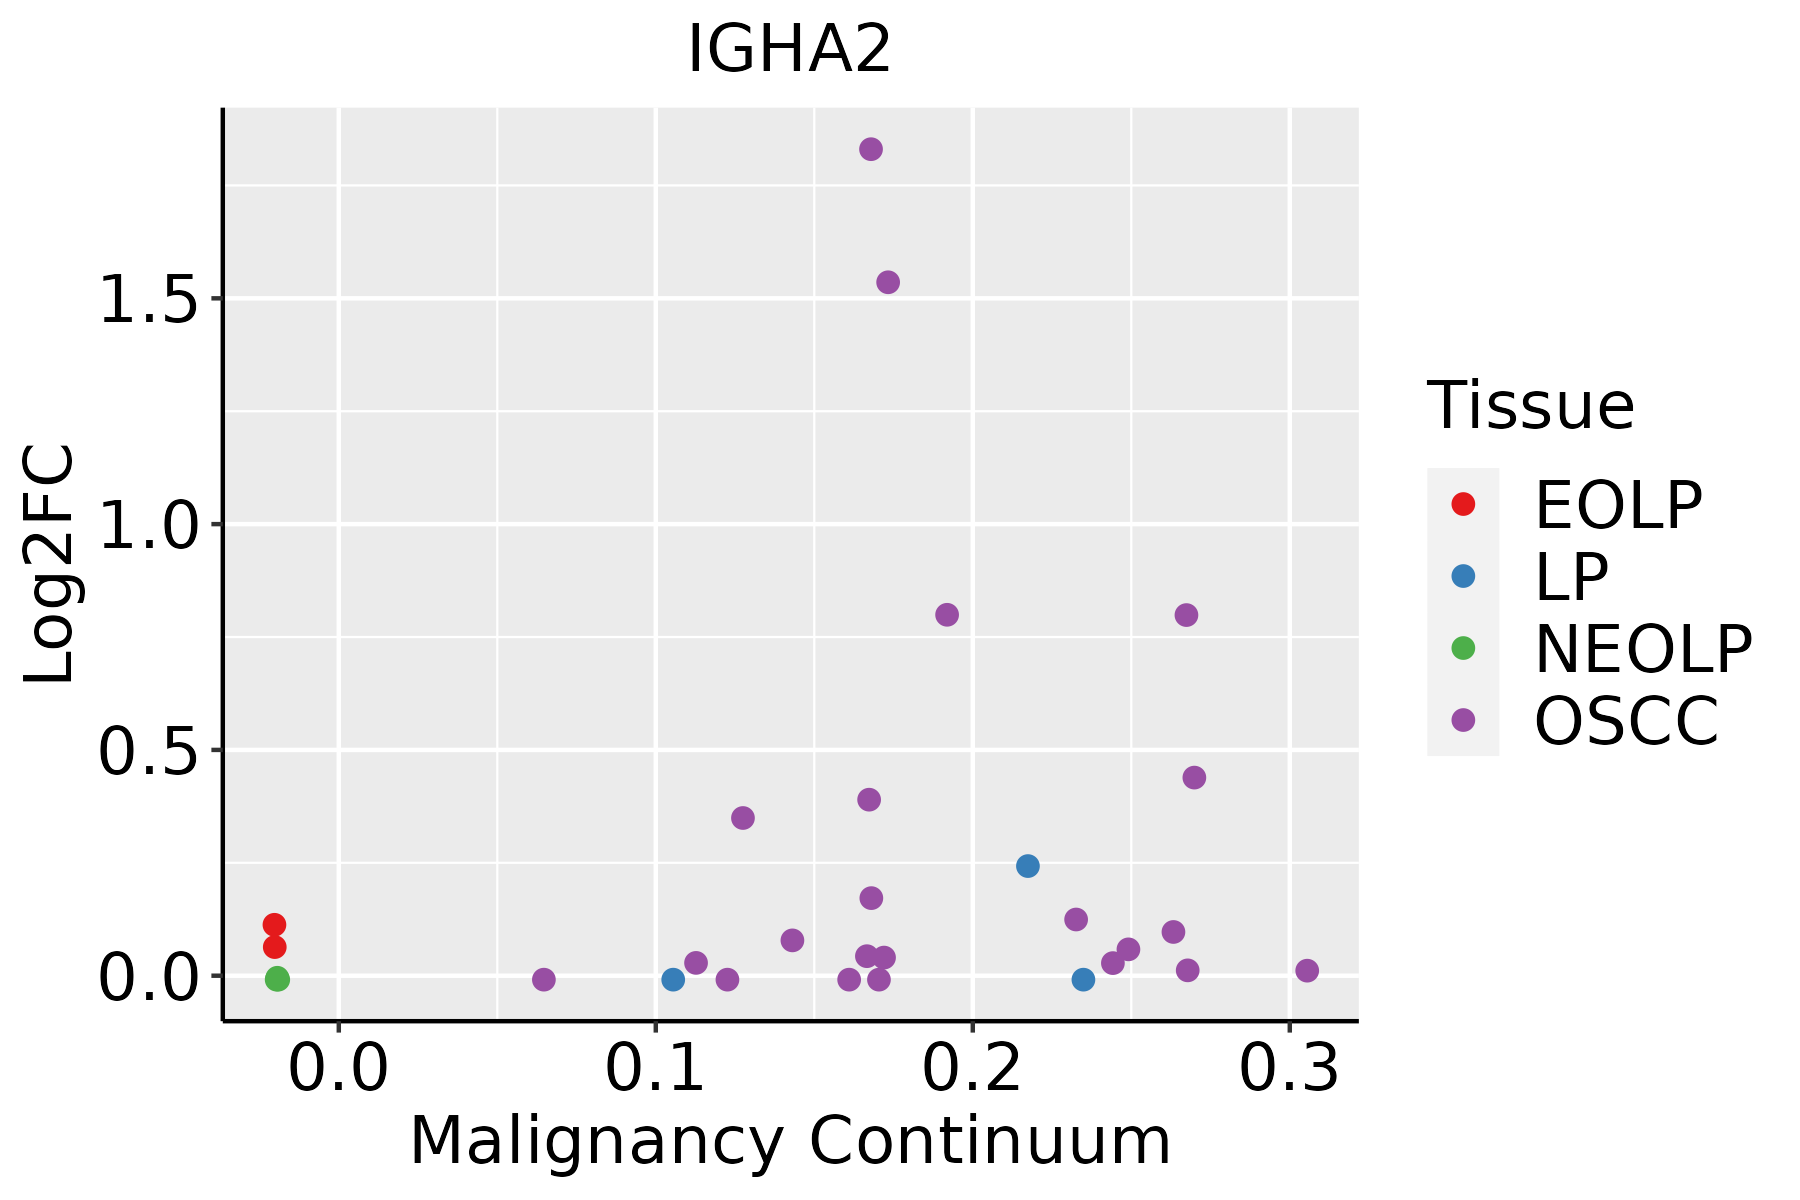 | EOLP: Erosive Oral lichen planus |
| LP: leukoplakia | ||
| NEOLP: Non-erosive oral lichen planus | ||
| OSCC: Oral squamous cell carcinoma | ||
| Prostate | 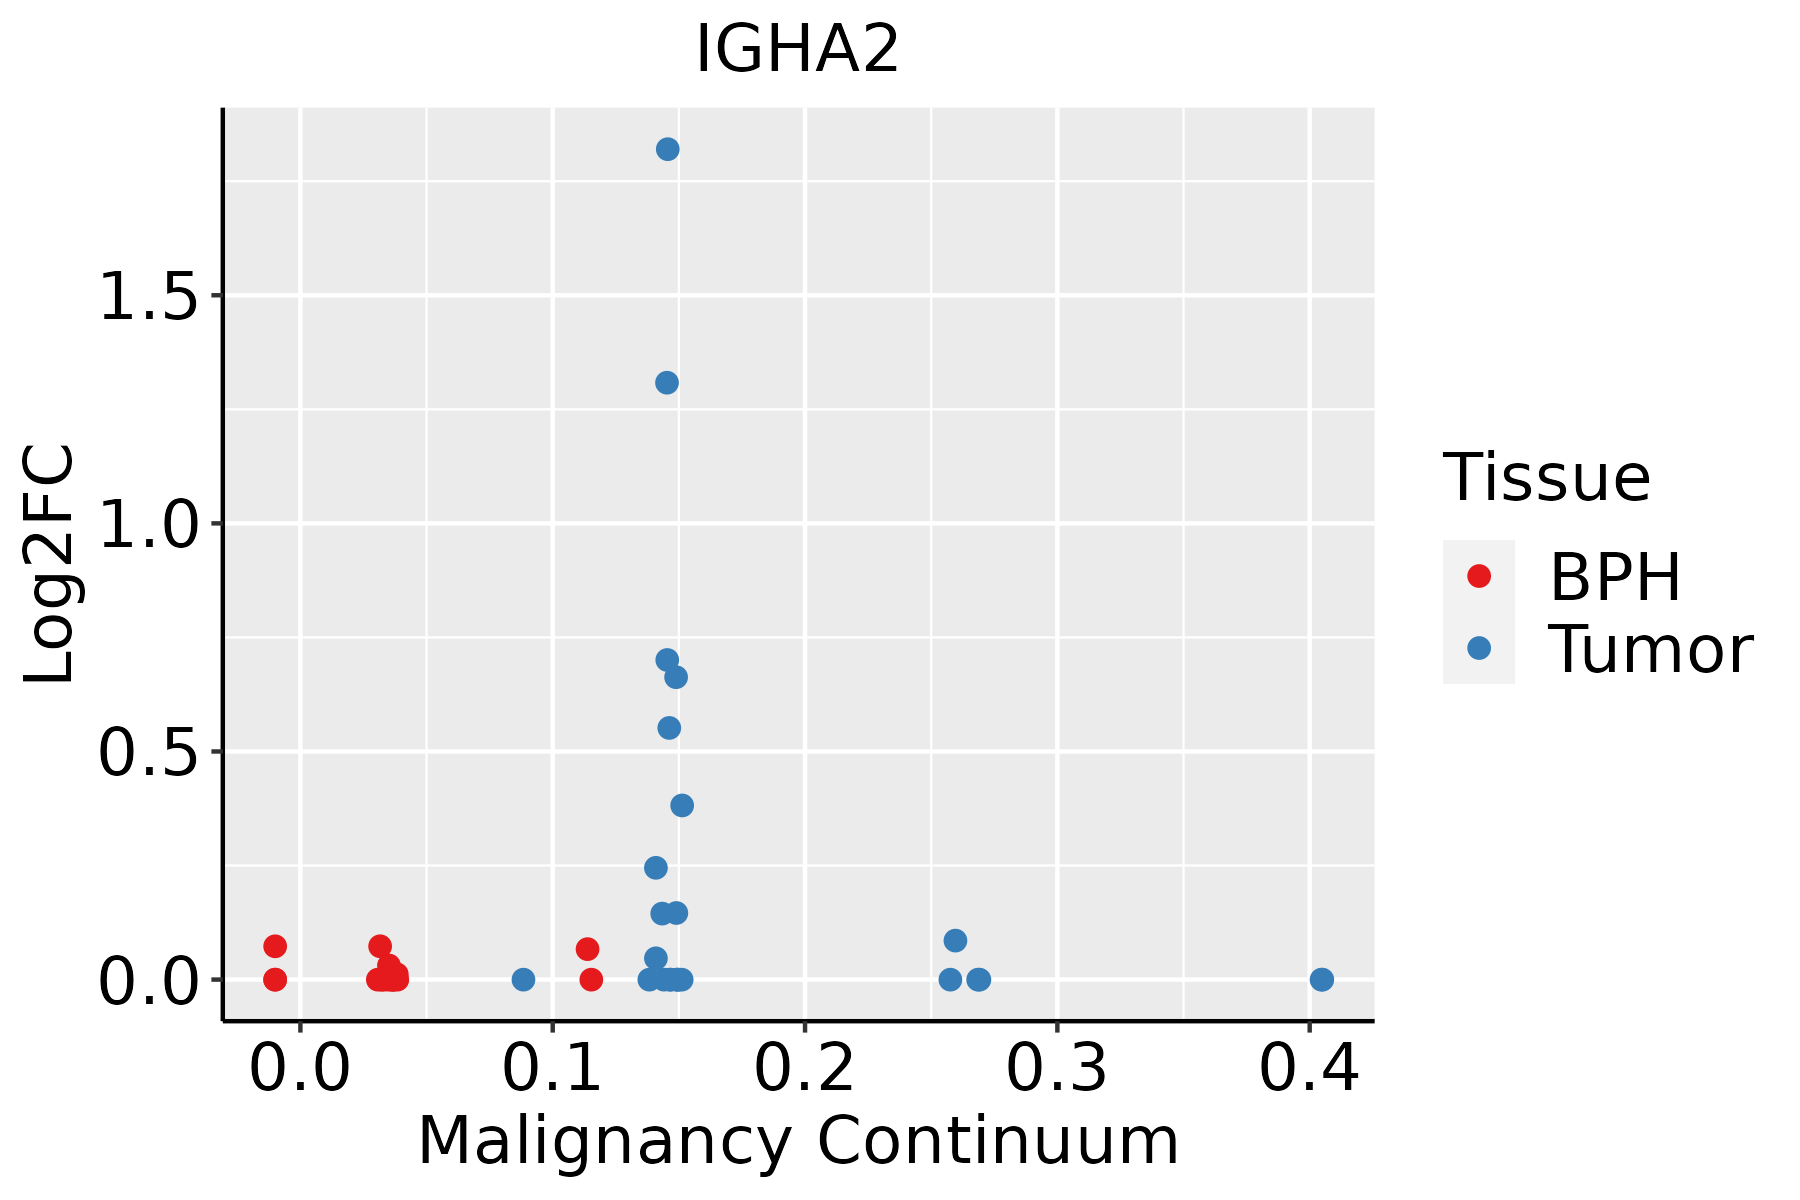 | BPH: Benign Prostatic Hyperplasia |
| Thyroid | 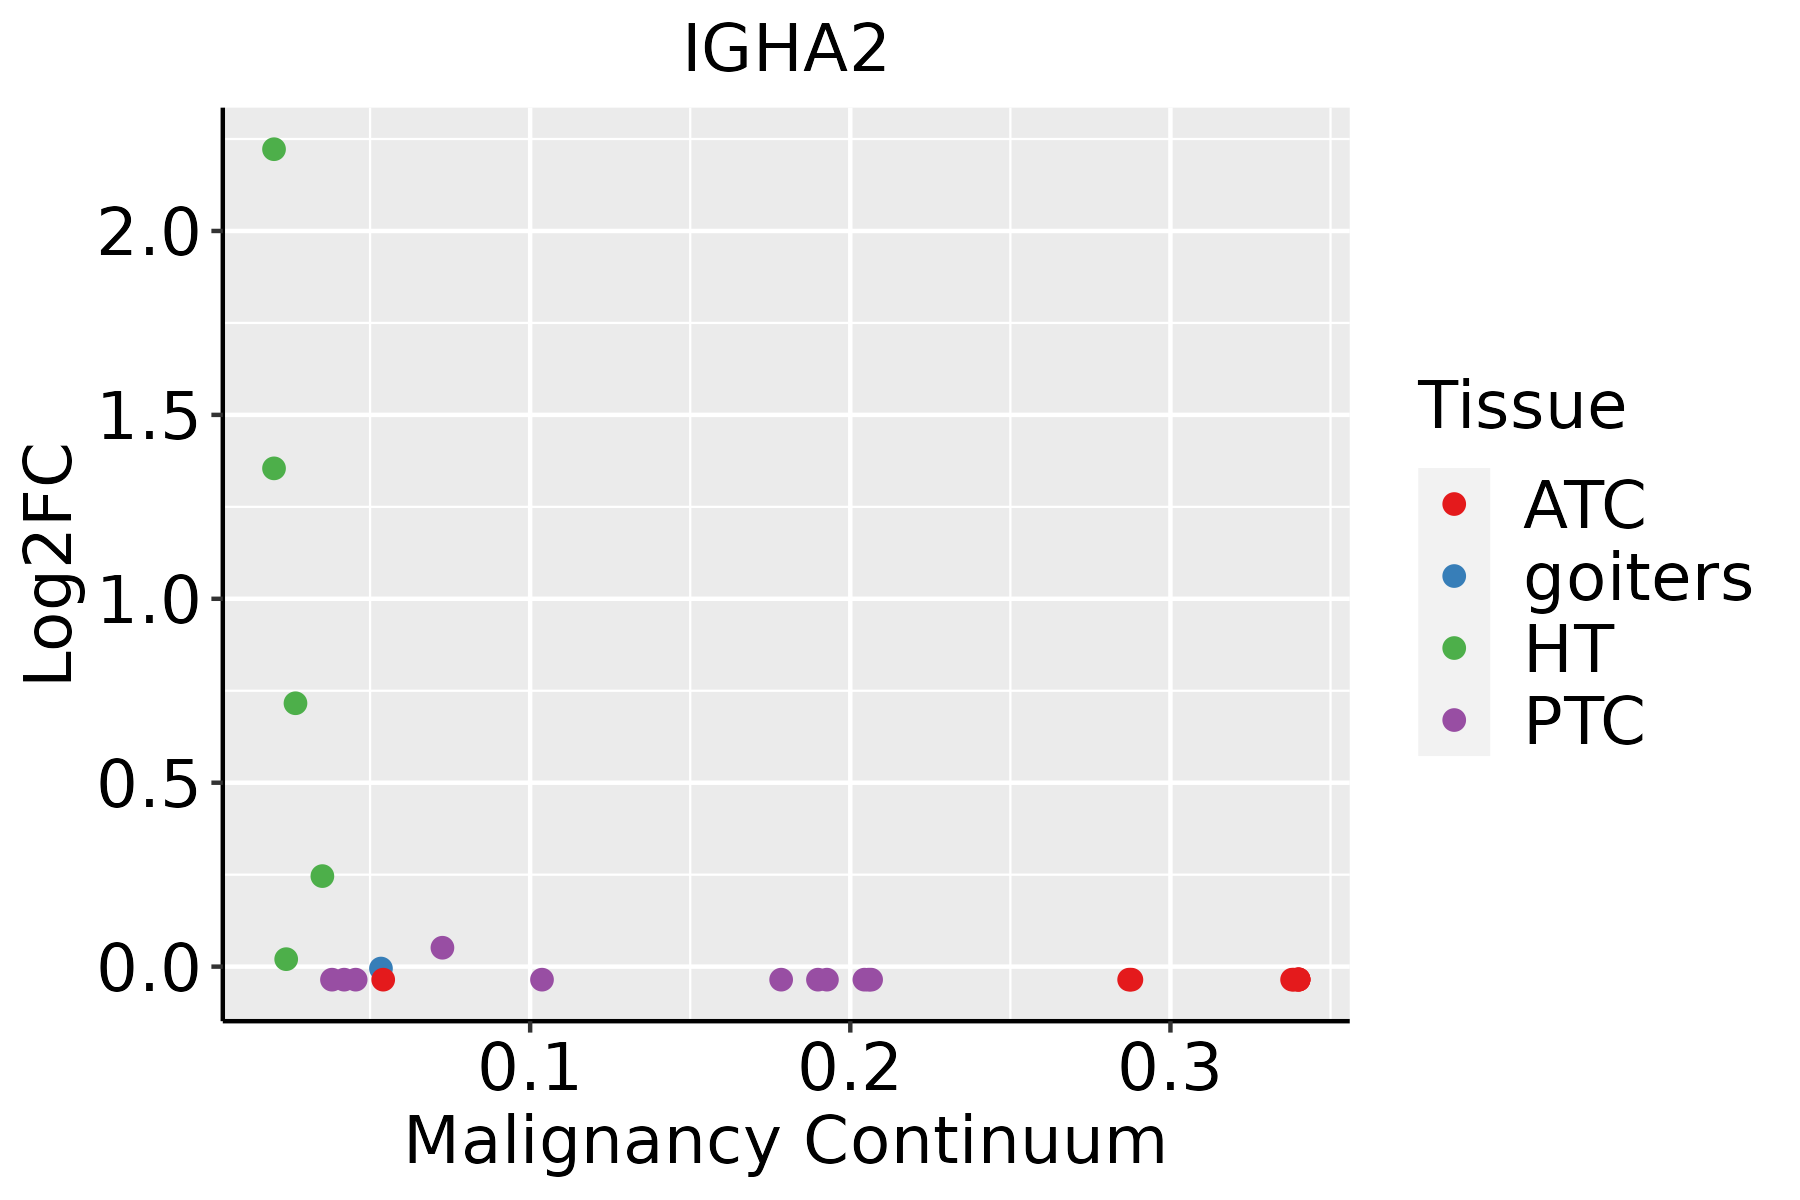 | ATC: Anaplastic thyroid cancer |
| HT: Hashimoto's thyroiditis | ||
| PTC: Papillary thyroid cancer |
| ∗log2FC in expression of this searched gene in stem-like cells from each diseased tissue sample relative to stem-like cells in normal samples in each tissue plotted against the malignancy continuum. Samples are colored based on if they are from different disease stage. |
Top |
Malignant transformation related pathway analysis |
| Find out the enriched GO biological processes and KEGG pathways involved in transition from healthy to precancer to cancer |
| Tissue | Disease Stage | Enriched GO biological Processes |
| Colorectum | AD |  |
| Colorectum | SER |  |
| Colorectum | MSS |  |
| Colorectum | MSI-H |  |
| Colorectum | FAP |  |
| ∗Top 15 enriched GO BP terms are showed in the bar plot of each disease state in each tissue. Each row represents a significant GO biological process which is colored according to the -log10(p.adjust). |
| Page: 1 2 3 4 5 6 7 8 9 |
| GO ID | Tissue | Disease Stage | Description | Gene Ratio | Bg Ratio | pvalue | p.adjust | Count |
| GO:0060249 | Colorectum | AD | anatomical structure homeostasis | 94/3918 | 314/18723 | 9.37e-05 | 1.42e-03 | 94 |
| GO:0001894 | Colorectum | AD | tissue homeostasis | 81/3918 | 268/18723 | 1.96e-04 | 2.62e-03 | 81 |
| GO:0003014 | Colorectum | AD | renal system process | 35/3918 | 110/18723 | 4.85e-03 | 3.27e-02 | 35 |
| GO:00018941 | Colorectum | SER | tissue homeostasis | 66/2897 | 268/18723 | 5.87e-05 | 1.37e-03 | 66 |
| GO:00602491 | Colorectum | SER | anatomical structure homeostasis | 74/2897 | 314/18723 | 1.01e-04 | 2.13e-03 | 74 |
| GO:0045730 | Colorectum | SER | respiratory burst | 14/2897 | 37/18723 | 7.80e-04 | 9.87e-03 | 14 |
| GO:00030141 | Colorectum | SER | renal system process | 30/2897 | 110/18723 | 1.05e-03 | 1.22e-02 | 30 |
| GO:0060263 | Colorectum | SER | regulation of respiratory burst | 8/2897 | 17/18723 | 2.12e-03 | 2.06e-02 | 8 |
| GO:00602492 | Colorectum | MSS | anatomical structure homeostasis | 84/3467 | 314/18723 | 1.87e-04 | 2.64e-03 | 84 |
| GO:00018942 | Colorectum | MSS | tissue homeostasis | 72/3467 | 268/18723 | 4.53e-04 | 5.40e-03 | 72 |
| GO:00018944 | Colorectum | FAP | tissue homeostasis | 61/2622 | 268/18723 | 6.71e-05 | 1.28e-03 | 61 |
| GO:00602494 | Colorectum | FAP | anatomical structure homeostasis | 69/2622 | 314/18723 | 7.51e-05 | 1.37e-03 | 69 |
| GO:00030142 | Colorectum | FAP | renal system process | 27/2622 | 110/18723 | 2.17e-03 | 1.78e-02 | 27 |
| GO:0097205 | Colorectum | FAP | renal filtration | 9/2622 | 26/18723 | 6.73e-03 | 4.14e-02 | 9 |
| GO:00602495 | Colorectum | CRC | anatomical structure homeostasis | 57/2078 | 314/18723 | 1.24e-04 | 2.41e-03 | 57 |
| GO:00018945 | Colorectum | CRC | tissue homeostasis | 48/2078 | 268/18723 | 5.56e-04 | 7.70e-03 | 48 |
| GO:00027646 | Oral cavity | OSCC | immune response-regulating signaling pathway | 212/7305 | 468/18723 | 2.93e-03 | 1.27e-02 | 212 |
| GO:006024910 | Prostate | BPH | anatomical structure homeostasis | 68/3107 | 314/18723 | 1.10e-02 | 4.53e-02 | 68 |
| GO:000189416 | Prostate | Tumor | tissue homeostasis | 65/3246 | 268/18723 | 2.39e-03 | 1.35e-02 | 65 |
| GO:006024915 | Prostate | Tumor | anatomical structure homeostasis | 74/3246 | 314/18723 | 2.82e-03 | 1.54e-02 | 74 |
| Page: 1 2 3 4 5 |
| Pathway ID | Tissue | Disease Stage | Description | Gene Ratio | Bg Ratio | pvalue | p.adjust | qvalue | Count |
| Page: 1 |
Top |
Cell-cell communication analysis |
| Identification of potential cell-cell interactions between two cell types and their ligand-receptor pairs for different disease states |
| Ligand | Receptor | LRpair | Pathway | Tissue | Disease Stage |
| Page: 1 |
Top |
Single-cell gene regulatory network inference analysis |
| Find out the significant the regulons (TFs) and the target genes of each regulon across cell types for different disease states |
| TF | Cell Type | Tissue | Disease Stage | Target Gene | RSS | Regulon Activity |
| ∗The dot plots of a searched regulon are shown for all cell subpopulations in each disease state of each tissue based on the regulon specific score inferred using pySCENIC and by calculating the average expression. |
| Page: 1 |
Top |
Somatic mutation of malignant transformation related genes |
| Annotation of somatic variants for genes involved in malignant transformation |
| Hugo Symbol | Variant Class | Variant Classification | dbSNP RS | HGVSc | HGVSp | HGVSp Short | SWISSPROT | BIOTYPE | SIFT | PolyPhen | Tumor Sample Barcode | Tissue | Histology | Sex | Age | Stage | Therapy Types | Drugs | Outcome |
| IGHA2 | SNV | Missense_Mutation | novel | c.587N>T | p.Pro196Leu | p.P196L | IG_C_gene | deleterious(0.04) | benign(0.094) | TCGA-A2-A3KD-01 | Breast | breast invasive carcinoma | Female | <65 | III/IV | Chemotherapy | taxotere | SD | |
| IGHA2 | SNV | Missense_Mutation | rs782766831 | c.19N>G | p.Lys7Glu | p.K7E | IG_C_gene | tolerated(0.61) | benign(0.003) | TCGA-A2-A3XT-01 | Breast | breast invasive carcinoma | Female | <65 | I/II | Chemotherapy | cyclophosphamide | PR | |
| IGHA2 | SNV | Missense_Mutation | rs782201993 | c.41N>G | p.Asp14Gly | p.D14G | IG_C_gene | tolerated(0.46) | benign(0) | TCGA-AC-A62Y-01 | Breast | breast invasive carcinoma | Female | >=65 | I/II | Unknown | Unknown | SD | |
| IGHA2 | SNV | Missense_Mutation | rs377678733 | c.133N>A | p.Gly45Arg | p.G45R | IG_C_gene | tolerated(0.09) | benign(0.129) | TCGA-AC-A8OP-01 | Breast | breast invasive carcinoma | Female | >=65 | I/II | Unknown | Unknown | SD | |
| IGHA2 | SNV | Missense_Mutation | rs782124108 | c.781N>A | p.Glu261Lys | p.E261K | IG_C_gene | tolerated(0.2) | benign(0.04) | TCGA-E2-A574-01 | Breast | breast invasive carcinoma | Female | <65 | I/II | Chemotherapy | adriamycin | SD | |
| IGHA2 | SNV | Missense_Mutation | rs373443615 | c.134N>A | p.Gly45Glu | p.G45E | IG_C_gene | tolerated(0.06) | possibly_damaging(0.726) | TCGA-C5-A1BQ-01 | Cervix | cervical & endocervical cancer | Female | >=65 | III/IV | Chemotherapy | cisplatin | CR | |
| IGHA2 | SNV | Missense_Mutation | rs373443615 | c.134N>A | p.Gly45Glu | p.G45E | IG_C_gene | tolerated(0.06) | possibly_damaging(0.726) | TCGA-C5-A3HL-01 | Cervix | cervical & endocervical cancer | Female | >=65 | I/II | Unknown | Unknown | SD | |
| IGHA2 | SNV | Missense_Mutation | novel | c.379N>C | p.Gly127Arg | p.G127R | IG_C_gene | deleterious(0) | probably_damaging(0.949) | TCGA-EK-A3GK-01 | Cervix | cervical & endocervical cancer | Female | <65 | I/II | Unknown | Unknown | SD | |
| IGHA2 | SNV | Missense_Mutation | rs782257693 | c.238G>A | p.Gly80Ser | p.G80S | IG_C_gene | tolerated(0.27) | benign(0.012) | TCGA-XS-A8TJ-01 | Cervix | cervical & endocervical cancer | Female | <65 | I/II | Chemotherapy | cisplatin | SD | |
| IGHA2 | SNV | Missense_Mutation | rs782085693 | c.662N>T | p.Pro221Leu | p.P221L | IG_C_gene | deleterious(0) | probably_damaging(1) | TCGA-A6-2686-01 | Colorectum | colon adenocarcinoma | Female | >=65 | I/II | Unknown | Unknown | SD |
| Page: 1 2 3 4 |
Top |
Related drugs of malignant transformation related genes |
| Identification of chemicals and drugs interact with genes involved in malignant transfromation |
| (DGIdb 4.0) |
| Entrez ID | Symbol | Category | Interaction Types | Drug Claim Name | Drug Name | PMIDs |
| Page: 1 |

Copyright 2023-Present -The University of Texas Health Science Center at Houston |