Schematic overview of the cellular and molecular mechanisms involved in the cancer progression, including the proposed cellular and molecular mechanisms in cancer cells trajectory. AT1: alveolar type 1 cells; AT2: alveolar type 2 cells; AAH: atypical adenomatous hyperplasia; AIS: adenocarcinoma in situ; MIA: minimally invasive adenocarcinoma; IA: invasive adenocarcinoma; EMT: epithelial-mesenchymal transition

Home

Download

Statistics

Help

Contact

Center for Computational Systems Medicine
leaf

Gene summary

leaf

Malignant transformation analysis

leaf

Malignant transformation related pathway analysis

leaf

Cell-cell communication analysis

leaf

Single-cell gene regulatory network inference analysis

leaf

Somatic mutation of malignant transformation related genes

leaf

Related drugs of malignant transformation related genes

Gene: IGHA1

Gene summary for IGHA1

check button Gene summary.

Gene informationSpeciesHuman
Gene symbol

IGHA1

Gene ID

3493

Gene nameimmunoglobulin heavy constant alpha 1
Gene AliasIgA1
Cytomap14q32.33
Gene Typeother
GO ID

GO:0001775

UniProtAcc

NA


Top

Malignant transformation analysis

check button Identification of the aberrant gene expression in precancerous and cancerous lesions by comparing the gene expression of stem-like cells in diseased tissues with normal stem cells
check button Malignant transformation involving gene list.
Entrez IDSymbolReplicatesSpeciesOrganTissueAdj P-valueLog2FCMalignancy
3493IGHA1CA_HPV_1HumanCervixCC1.35e-66-1.51e+000.0264
3493IGHA1CA_HPV_2HumanCervixCC6.59e-80-1.60e+000.0391
3493IGHA1CA_HPV_3HumanCervixCC5.86e-60-1.53e+000.0414
3493IGHA1HSIL_HPV_1HumanCervixHSIL_HPV2.77e-32-1.23e+000.0116
3493IGHA1HSIL_HPV_2HumanCervixHSIL_HPV3.23e-31-9.70e-010.0208
3493IGHA1N_HPV_1HumanCervixN_HPV2.25e-16-7.67e-010.0079
3493IGHA1N_HPV_2HumanCervixN_HPV3.98e-78-1.59e+00-0.0131
3493IGHA1CCI_1HumanCervixCC4.05e-30-1.66e+000.528
3493IGHA1CCI_2HumanCervixCC4.11e-28-1.66e+000.5249
3493IGHA1CCI_3HumanCervixCC4.38e-38-1.66e+000.516
3493IGHA1CCII_1HumanCervixCC5.65e-50-1.66e+000.3249
3493IGHA1TumorHumanCervixCC1.01e-90-1.66e+000.1241
3493IGHA1sample1HumanCervixCC4.98e-43-1.66e+000.0959
3493IGHA1sample3HumanCervixCC1.69e-85-1.65e+000.1387
3493IGHA1H2HumanCervixHSIL_HPV5.44e-66-1.47e+000.0632
3493IGHA1L1HumanCervixCC9.32e-46-1.60e+000.0802
3493IGHA1T1HumanCervixCC1.50e-77-1.61e+000.0918
3493IGHA1T2HumanCervixCC1.72e-17-1.37e+000.0709
3493IGHA1T3HumanCervixCC2.92e-80-1.63e+000.1389
3493IGHA1HTA11_2951_2000001011HumanColorectumAD6.26e-261.49e+000.0216
Page: 1 2 3 4 5 6 

check button Transcriptomic changes along malignancy continuum.
TissueExpression DynamicsAbbreviation
CervixThe image shows the transcriptomic changes along malignancy continuum.log2FC in expression of this searched gene in stem-like cells from each diseased tissue sample relative to stem-like cells in normal samples in each tissue plotted against the malignancy continuum. Samples are colored based on if they are from different disease stage.CC: Cervix cancer
HSIL_HPV: HPV-infected high-grade squamous intraepithelial lesions
N_HPV: HPV-infected normal cervix
Colorectum (GSE201348)The image shows the transcriptomic changes along malignancy continuum.log2FC in expression of this searched gene in stem-like cells from each diseased tissue sample relative to stem-like cells in normal samples in each tissue plotted against the malignancy continuum. Samples are colored based on if they are from different disease stage.FAP: Familial adenomatous polyposis
CRC: Colorectal cancer
Colorectum (HTA11)The image shows the transcriptomic changes along malignancy continuum.log2FC in expression of this searched gene in stem-like cells from each diseased tissue sample relative to stem-like cells in normal samples in each tissue plotted against the malignancy continuum. Samples are colored based on if they are from different disease stage.AD: Adenomas
SER: Sessile serrated lesions
MSI-H: Microsatellite-high colorectal cancer
MSS: Microsatellite stable colorectal cancer
GCThe image shows the transcriptomic changes along malignancy continuum.log2FC in expression of this searched gene in stem-like cells from each diseased tissue sample relative to stem-like cells in normal samples in each tissue plotted against the malignancy continuum. Samples are colored based on if they are from different disease stage.
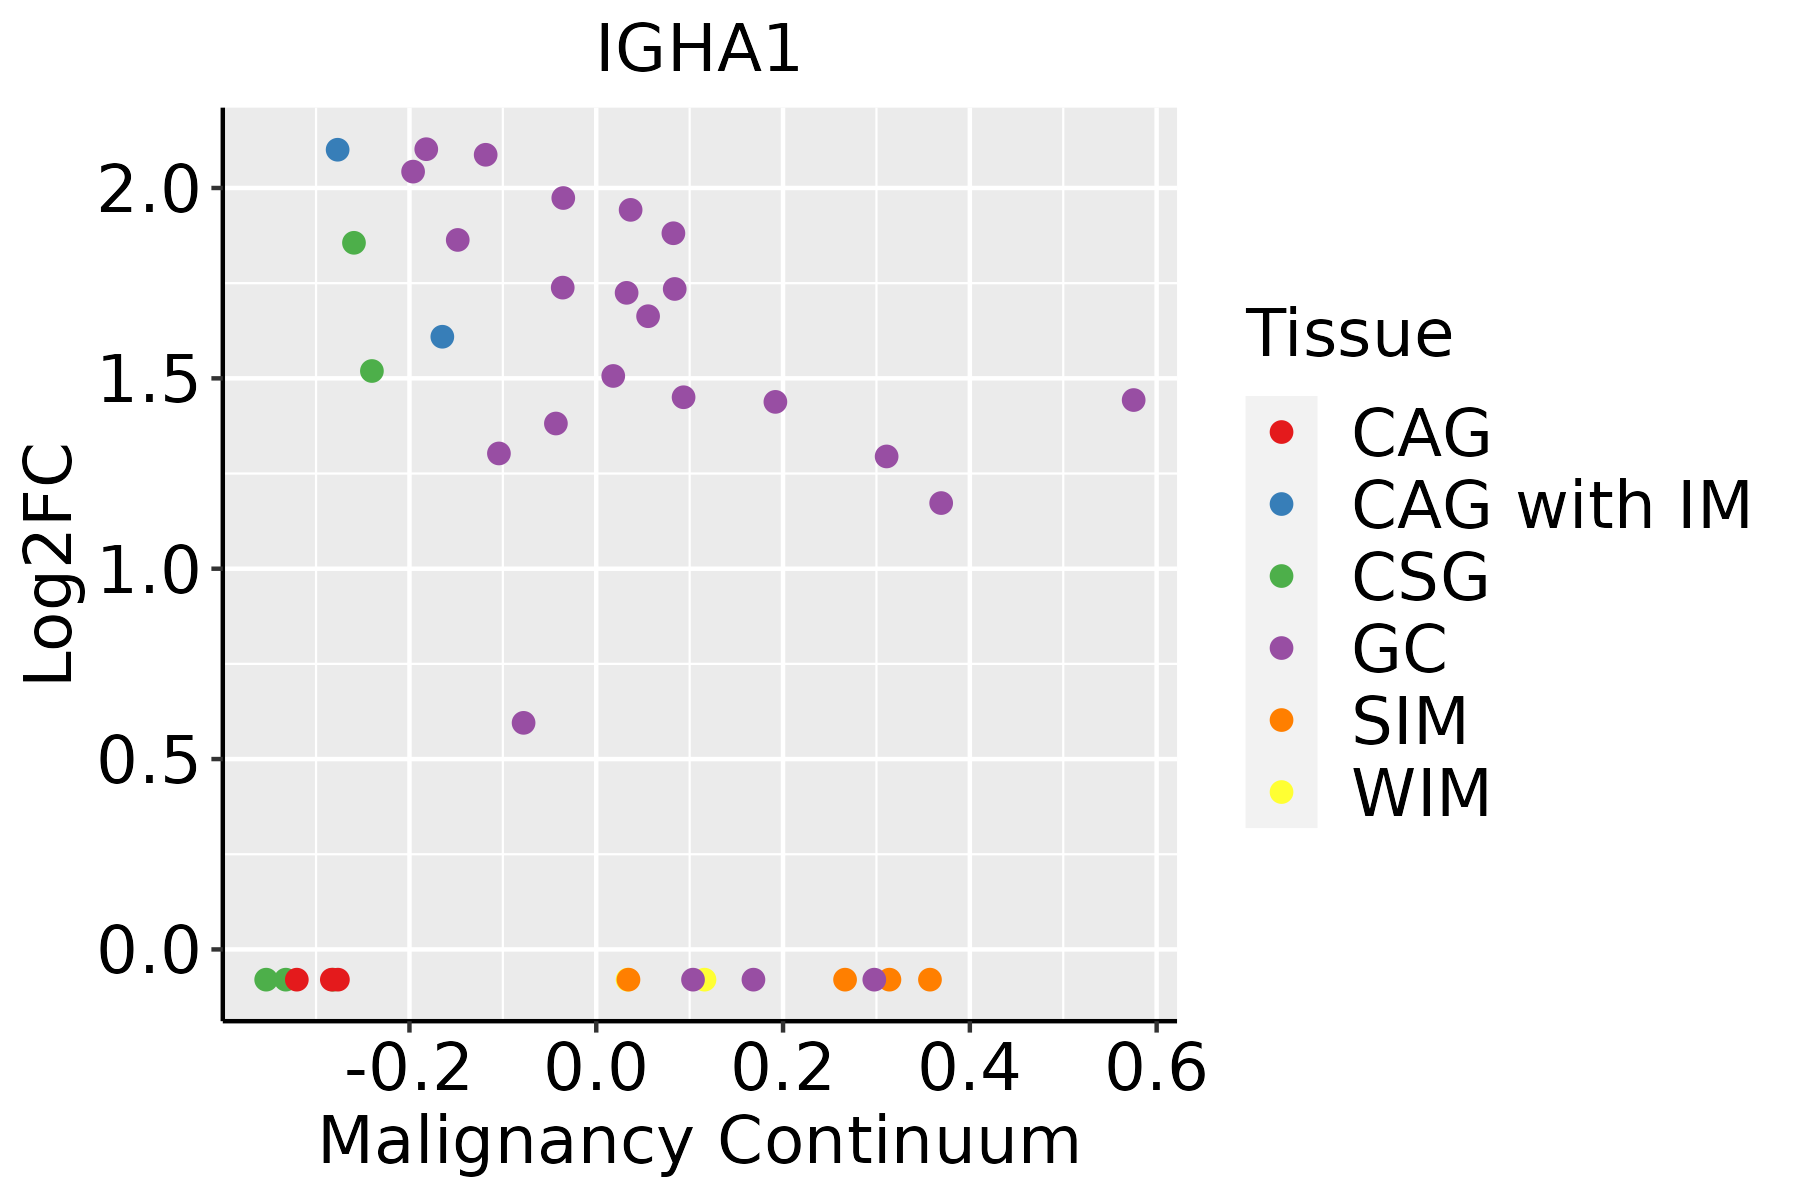
CAG: Chronic atrophic gastritis
CAG with IM: Chronic atrophic gastritis with intestinal metaplasia
CSG: Chronic superficial gastritis
GC: Gastric cancer
SIM: Severe intestinal metaplasia
WIM: Wild intestinal metaplasia
LiverThe image shows the transcriptomic changes along malignancy continuum.log2FC in expression of this searched gene in stem-like cells from each diseased tissue sample relative to stem-like cells in normal samples in each tissue plotted against the malignancy continuum. Samples are colored based on if they are from different disease stage.HCC: Hepatocellular carcinoma
NAFLD: Non-alcoholic fatty liver disease
Oral CavityThe image shows the transcriptomic changes along malignancy continuum.log2FC in expression of this searched gene in stem-like cells from each diseased tissue sample relative to stem-like cells in normal samples in each tissue plotted against the malignancy continuum. Samples are colored based on if they are from different disease stage.EOLP: Erosive Oral lichen planus
LP: leukoplakia
NEOLP: Non-erosive oral lichen planus
OSCC: Oral squamous cell carcinoma
ProstateThe image shows the transcriptomic changes along malignancy continuum.log2FC in expression of this searched gene in stem-like cells from each diseased tissue sample relative to stem-like cells in normal samples in each tissue plotted against the malignancy continuum. Samples are colored based on if they are from different disease stage.BPH: Benign Prostatic Hyperplasia
ThyroidThe image shows the transcriptomic changes along malignancy continuum.log2FC in expression of this searched gene in stem-like cells from each diseased tissue sample relative to stem-like cells in normal samples in each tissue plotted against the malignancy continuum. Samples are colored based on if they are from different disease stage.ATC: Anaplastic thyroid cancer
HT: Hashimoto's thyroiditis
PTC: Papillary thyroid cancer
∗log2FC in expression of this searched gene in stem-like cells from each diseased tissue sample relative to stem-like cells in normal samples in each tissue plotted against the malignancy continuum. Samples are colored based on if they are from different disease stage.

Top

Malignant transformation related pathway analysis

check buttonFind out the enriched GO biological processes and KEGG pathways involved in transition from healthy to precancer to cancer
check button Figure of enriched GO biological processes.
TissueDisease StageEnriched GO biological Processes
ColorectumADGO analysis - Figure of enriched GO biological processes: Top 15 enriched GO BP terms are showed in the bar plot of each disease state in each tissue. Each row represents a significant GO biological process which is colored according to the -log10(p.adjust).
ColorectumSERGO analysis - Figure of enriched GO biological processes: Top 15 enriched GO BP terms are showed in the bar plot of each disease state in each tissue. Each row represents a significant GO biological process which is colored according to the -log10(p.adjust).
ColorectumMSSGO analysis - Figure of enriched GO biological processes: Top 15 enriched GO BP terms are showed in the bar plot of each disease state in each tissue. Each row represents a significant GO biological process which is colored according to the -log10(p.adjust).
ColorectumMSI-HGO analysis - Figure of enriched GO biological processes: Top 15 enriched GO BP terms are showed in the bar plot of each disease state in each tissue. Each row represents a significant GO biological process which is colored according to the -log10(p.adjust).
ColorectumFAPGO analysis - Figure of enriched GO biological processes: Top 15 enriched GO BP terms are showed in the bar plot of each disease state in each tissue. Each row represents a significant GO biological process which is colored according to the -log10(p.adjust).
∗Top 15 enriched GO BP terms are showed in the bar plot of each disease state in each tissue. Each row represents a significant GO biological process which is colored according to the -log10(p.adjust).
Page: 1 2 3 4 5 6 7 8 9 

check button Enriched GO biological processes.
GO IDTissueDisease StageDescriptionGene RatioBg Ratiopvaluep.adjustCount
GO:00027644CervixCCimmune response-regulating signaling pathway97/2311468/187231.49e-077.07e-0697
GO:00018949CervixCCtissue homeostasis57/2311268/187232.43e-054.21e-0457
GO:00602498CervixCCanatomical structure homeostasis63/2311314/187236.03e-058.68e-0463
GO:00457306CervixCCrespiratory burst14/231137/187236.97e-059.81e-0414
GO:00022533CervixCCactivation of immune response72/2311375/187238.26e-051.11e-0372
GO:0002768CervixCCimmune response-regulating cell surface receptor signaling pathway59/2311315/187236.64e-046.11e-0359
GO:00026967CervixCCpositive regulation of leukocyte activation72/2311409/187231.13e-039.31e-0372
GO:00512516CervixCCpositive regulation of lymphocyte activation65/2311362/187231.15e-039.39e-0365
GO:00508676CervixCCpositive regulation of cell activation73/2311420/187231.50e-031.16e-0273
GO:00197308CervixCCantimicrobial humoral response27/2311122/187231.70e-031.29e-0227
GO:00602634CervixCCregulation of respiratory burst7/231117/187232.72e-031.85e-027
GO:00018957CervixCCretina homeostasis19/231179/187232.94e-031.94e-0219
GO:00024603CervixCCadaptive immune response based on somatic recombination of immune receptors built from immunoglobulin superfamily domains62/2311356/187233.09e-032.03e-0262
GO:0002443CervixCCleukocyte mediated immunity73/2311440/187235.01e-032.98e-0273
GO:0006909CervixCCphagocytosis53/2311308/187237.49e-034.01e-0253
GO:00069597CervixCChumoral immune response54/2311317/187238.57e-034.42e-0254
GO:00103243CervixCCmembrane invagination28/2311144/187239.50e-034.72e-0228
GO:000695912CervixHSIL_HPVhumoral immune response39/737317/187232.88e-107.02e-0839
GO:000269611CervixHSIL_HPVpositive regulation of leukocyte activation44/737409/187231.58e-093.04e-0744
GO:005086711CervixHSIL_HPVpositive regulation of cell activation44/737420/187233.59e-095.76e-0744
Page: 1 2 3 4 5 6 7 8 9 10 11 

check button Enriched KEGG pathways.
Pathway IDTissueDisease StageDescriptionGene RatioBg Ratiopvaluep.adjustqvalueCount
Page: 1 

Top

Cell-cell communication analysis

check buttonIdentification of potential cell-cell interactions between two cell types and their ligand-receptor pairs for different disease states
LigandReceptorLRpairPathwayTissueDisease Stage
Page: 1 

Top

Single-cell gene regulatory network inference analysis

check buttonFind out the significant the regulons (TFs) and the target genes of each regulon across cell types for different disease states
TFCell TypeTissueDisease StageTarget GeneRSSRegulon Activity
∗The dot plots of a searched regulon are shown for all cell subpopulations in each disease state of each tissue based on the regulon specific score inferred using pySCENIC and by calculating the average expression.
Page: 1 

Top

Somatic mutation of malignant transformation related genes

check buttonAnnotation of somatic variants for genes involved in malignant transformation
Hugo SymbolVariant ClassVariant ClassificationdbSNP RSHGVScHGVSpHGVSp ShortSWISSPROTBIOTYPESIFTPolyPhenTumor Sample BarcodeTissueHistologySexAgeStageTherapy TypesDrugsOutcome
IGHA1SNVMissense_Mutationrs587723177c.820N>Ap.Glu274Lysp.E274KP01876IG_C_genetolerated(0.19)benign(0.276)TCGA-BH-A0W4-01Breastbreast invasive carcinomaFemale<65I/IIUnknownUnknownSD
IGHA1SNVMissense_Mutationrs771398040c.403N>Ap.Glu135Lysp.E135KP01876IG_C_genedeleterious(0.01)probably_damaging(0.984)TCGA-C8-A130-01Breastbreast invasive carcinomaFemale<65III/IVUnknownUnknownSD
IGHA1SNVMissense_Mutationrs768421910c.419N>Ap.Gly140Aspp.G140DP01876IG_C_genetolerated(0.07)possibly_damaging(0.575)TCGA-E2-A14S-01Breastbreast invasive carcinomaFemale>=65I/IIChemotherapycytoxanSD
IGHA1SNVMissense_Mutationnovelc.390C>Ap.His130Glnp.H130QP01876IG_C_genetolerated(0.8)benign(0.006)TCGA-E9-A228-01Breastbreast invasive carcinomaFemale<65I/IIChemotherapydoxorubicinSD
IGHA1SNVMissense_Mutationnovelc.859N>Ap.Gln287Lysp.Q287KP01876IG_C_genetolerated(0.12)benign(0.17)TCGA-LL-A5YP-01Breastbreast invasive carcinomaFemale<65I/IIChemotherapycytoxanSD
IGHA1SNVMissense_Mutationrs1128904c.361N>Cp.Ser121Prop.S121PP01876IG_C_genetolerated(0.33)benign(0)TCGA-DS-A1OA-01Cervixcervical & endocervical cancerFemale>=65I/IIChemotherapycarboplatinPD
IGHA1SNVMissense_Mutationnovelc.808N>Ap.Glu270Lysp.E270KP01876IG_C_genetolerated(0.1)possibly_damaging(0.498)TCGA-JW-A5VL-01Cervixcervical & endocervical cancerFemale<65I/IIUnknownUnknownSD
IGHA1SNVMissense_Mutationnovelc.972C>Ap.Phe324Leup.F324LP01876IG_C_genedeleterious(0)probably_damaging(0.999)TCGA-JW-A69B-01Cervixcervical & endocervical cancerFemale<65I/IIUnknownUnknownSD
IGHA1SNVMissense_Mutationnovelc.1042N>Ap.Val348Metp.V348MP01876IG_C_genedeleterious(0.04)possibly_damaging(0.617)TCGA-UC-A7PG-06Cervixcervical & endocervical cancerFemale<65III/IVChemotherapycisplatinPD
IGHA1SNVMissense_Mutationrs587723177c.820G>Ap.Glu274Lysp.E274KP01876IG_C_genetolerated(0.19)benign(0.276)TCGA-AZ-4313-01Colorectumcolon adenocarcinomaFemale<65I/IIUnknownUnknownSD
Page: 1 2 3 4 5 6 

Top

Related drugs of malignant transformation related genes

check buttonIdentification of chemicals and drugs interact with genes involved in malignant transfromation
(DGIdb 4.0)
Entrez IDSymbolCategoryInteraction TypesDrug Claim NameDrug NamePMIDs
Page: 1