
|
|||||
|
 | |
| |
| |
| |
| |
| |
|
Gene: IGFL1 |
Gene summary for IGFL1 |
| Gene information | Species | Human | Gene symbol | IGFL1 | Gene ID | 374918 |
| Gene name | IGF like family member 1 | |
| Gene Alias | APRG644 | |
| Cytomap | 19q13.32 | |
| Gene Type | protein-coding | GO ID | GO:0005575 | UniProtAcc | Q6UW32 |
Top |
Malignant transformation analysis |
| Identification of the aberrant gene expression in precancerous and cancerous lesions by comparing the gene expression of stem-like cells in diseased tissues with normal stem cells |
| Entrez ID | Symbol | Replicates | Species | Organ | Tissue | Adj P-value | Log2FC | Malignancy |
| 374918 | IGFL1 | LZE4T | Human | Esophagus | ESCC | 9.66e-09 | 6.43e-01 | 0.0811 |
| 374918 | IGFL1 | LZE6T | Human | Esophagus | ESCC | 5.26e-07 | 8.54e-01 | 0.0845 |
| 374918 | IGFL1 | P11T-E | Human | Esophagus | ESCC | 3.66e-11 | 2.93e+00 | 0.1426 |
| 374918 | IGFL1 | P17T-E | Human | Esophagus | ESCC | 4.79e-04 | 4.94e-01 | 0.1278 |
| 374918 | IGFL1 | P21T-E | Human | Esophagus | ESCC | 1.66e-02 | 2.42e-01 | 0.1617 |
| 374918 | IGFL1 | P28T-E | Human | Esophagus | ESCC | 9.44e-07 | 3.11e-01 | 0.1149 |
| 374918 | IGFL1 | P32T-E | Human | Esophagus | ESCC | 7.90e-03 | 5.35e-01 | 0.1666 |
| 374918 | IGFL1 | P83T-E | Human | Esophagus | ESCC | 6.97e-08 | 8.10e-01 | 0.1738 |
| 374918 | IGFL1 | P89T-E | Human | Esophagus | ESCC | 1.41e-20 | 5.71e+00 | 0.1752 |
| 374918 | IGFL1 | P91T-E | Human | Esophagus | ESCC | 1.38e-03 | 1.23e+00 | 0.1828 |
| 374918 | IGFL1 | P107T-E | Human | Esophagus | ESCC | 1.48e-31 | 2.76e+00 | 0.171 |
| 374918 | IGFL1 | P130T-E | Human | Esophagus | ESCC | 4.12e-11 | 7.66e-01 | 0.1676 |
| 374918 | IGFL1 | C04 | Human | Oral cavity | OSCC | 4.60e-23 | 2.07e+00 | 0.2633 |
| 374918 | IGFL1 | C30 | Human | Oral cavity | OSCC | 3.40e-07 | 5.09e-01 | 0.3055 |
| 374918 | IGFL1 | C06 | Human | Oral cavity | OSCC | 2.06e-09 | 2.77e+00 | 0.2699 |
| 374918 | IGFL1 | C07 | Human | Oral cavity | OSCC | 9.93e-03 | 3.41e+00 | 0.2491 |
| 374918 | IGFL1 | C09 | Human | Oral cavity | OSCC | 1.38e-06 | 1.11e+00 | 0.1431 |
| 374918 | IGFL1 | SYSMH2 | Human | Oral cavity | OSCC | 8.75e-05 | 3.20e-01 | 0.2326 |
| 374918 | IGFL1 | SYSMH3 | Human | Oral cavity | OSCC | 1.53e-25 | 1.27e+00 | 0.2442 |
| 374918 | IGFL1 | SYSMH5 | Human | Oral cavity | OSCC | 8.66e-11 | 3.14e-01 | 0.0647 |
| Page: 1 2 |
| Tissue | Expression Dynamics | Abbreviation |
| Esophagus |  | ESCC: Esophageal squamous cell carcinoma |
| HGIN: High-grade intraepithelial neoplasias | ||
| LGIN: Low-grade intraepithelial neoplasias | ||
| Oral Cavity |  | EOLP: Erosive Oral lichen planus |
| LP: leukoplakia | ||
| NEOLP: Non-erosive oral lichen planus | ||
| OSCC: Oral squamous cell carcinoma | ||
| Skin | 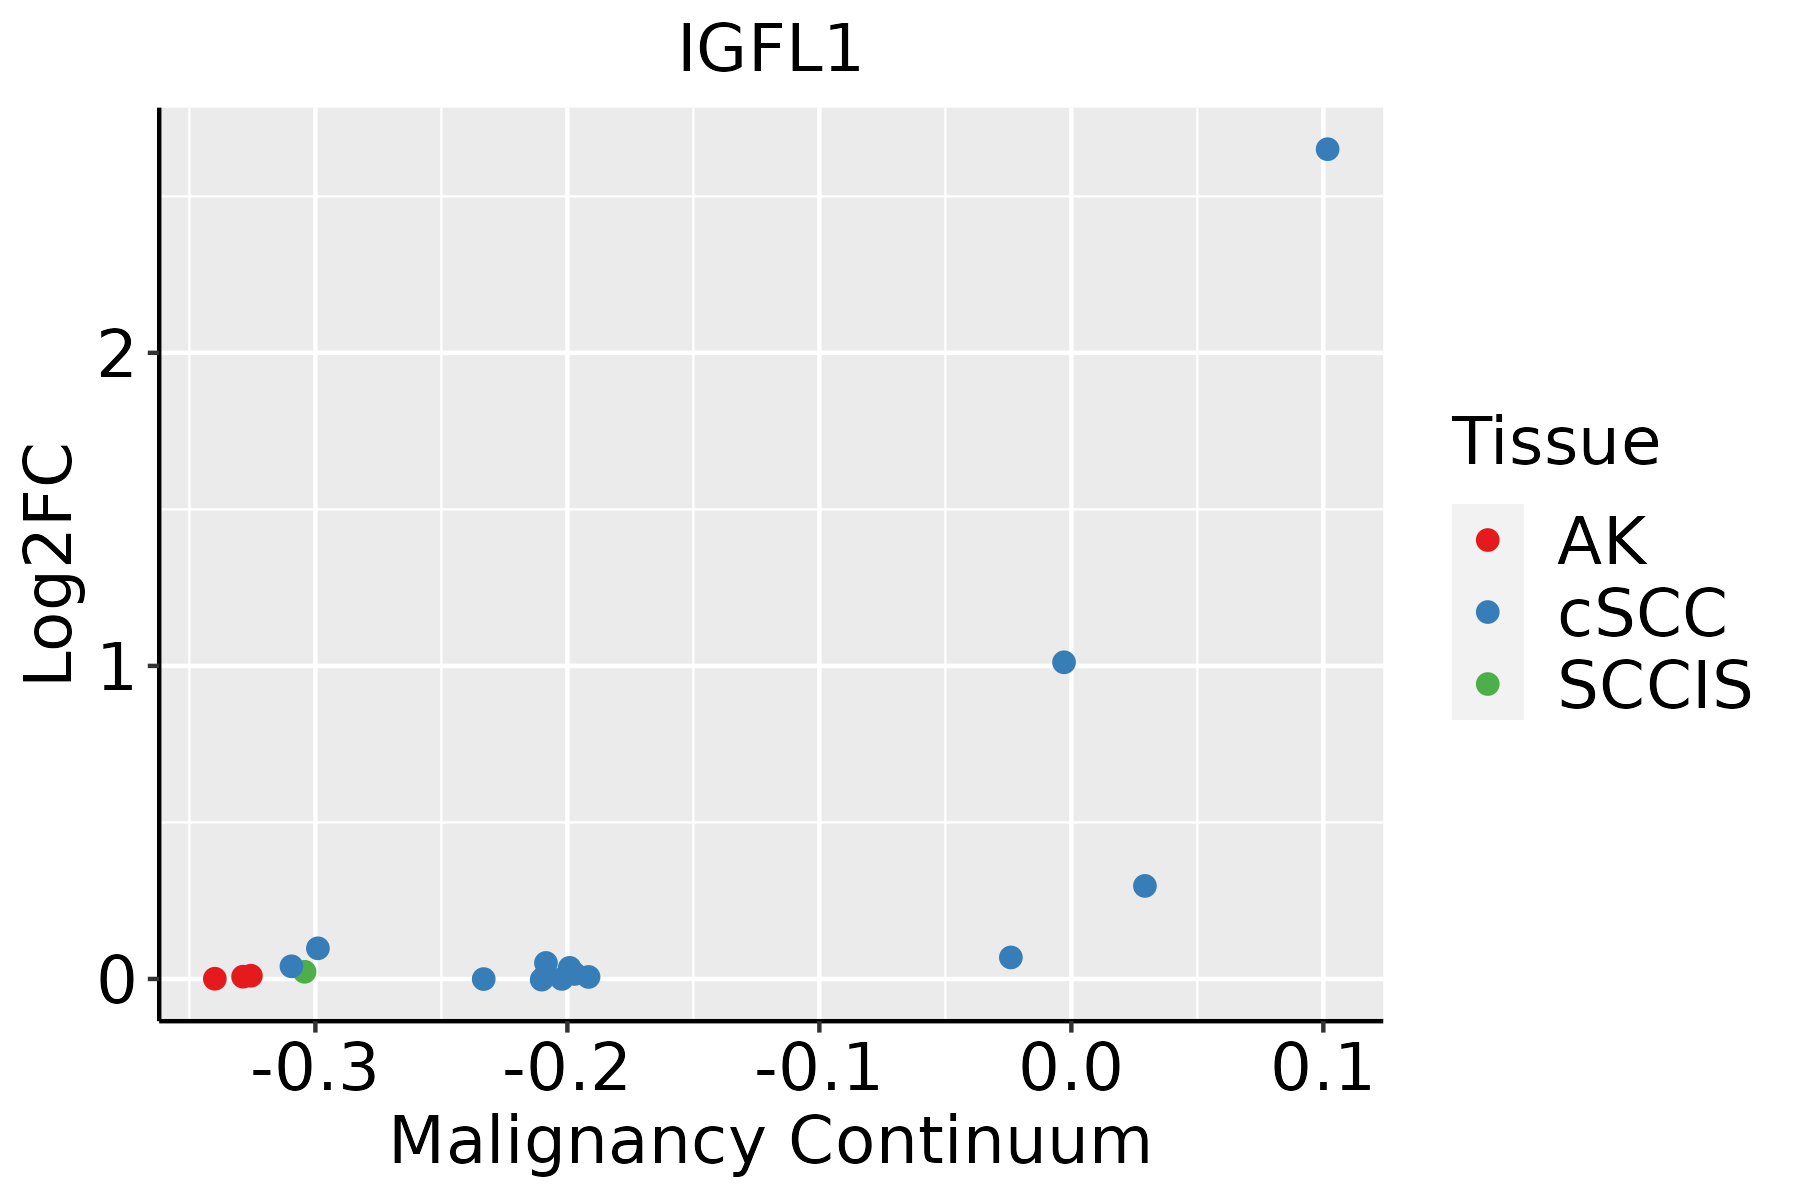 | AK: Actinic keratosis |
| cSCC: Cutaneous squamous cell carcinoma | ||
| SCCIS:squamous cell carcinoma in situ |
| ∗log2FC in expression of this searched gene in stem-like cells from each diseased tissue sample relative to stem-like cells in normal samples in each tissue plotted against the malignancy continuum. Samples are colored based on if they are from different disease stage. |
Top |
Malignant transformation related pathway analysis |
| Find out the enriched GO biological processes and KEGG pathways involved in transition from healthy to precancer to cancer |
| Tissue | Disease Stage | Enriched GO biological Processes |
| Colorectum | AD |  |
| Colorectum | SER |  |
| Colorectum | MSS |  |
| Colorectum | MSI-H |  |
| Colorectum | FAP |  |
| ∗Top 15 enriched GO BP terms are showed in the bar plot of each disease state in each tissue. Each row represents a significant GO biological process which is colored according to the -log10(p.adjust). |
| Page: 1 2 3 4 5 6 7 8 9 |
| GO ID | Tissue | Disease Stage | Description | Gene Ratio | Bg Ratio | pvalue | p.adjust | Count |
| Page: 1 |
| Pathway ID | Tissue | Disease Stage | Description | Gene Ratio | Bg Ratio | pvalue | p.adjust | qvalue | Count |
| Page: 1 |
Top |
Cell-cell communication analysis |
| Identification of potential cell-cell interactions between two cell types and their ligand-receptor pairs for different disease states |
| Ligand | Receptor | LRpair | Pathway | Tissue | Disease Stage |
| Page: 1 |
Top |
Single-cell gene regulatory network inference analysis |
| Find out the significant the regulons (TFs) and the target genes of each regulon across cell types for different disease states |
| TF | Cell Type | Tissue | Disease Stage | Target Gene | RSS | Regulon Activity |
| ∗The dot plots of a searched regulon are shown for all cell subpopulations in each disease state of each tissue based on the regulon specific score inferred using pySCENIC and by calculating the average expression. |
| Page: 1 |
Top |
Somatic mutation of malignant transformation related genes |
| Annotation of somatic variants for genes involved in malignant transformation |
| Hugo Symbol | Variant Class | Variant Classification | dbSNP RS | HGVSc | HGVSp | HGVSp Short | SWISSPROT | BIOTYPE | SIFT | PolyPhen | Tumor Sample Barcode | Tissue | Histology | Sex | Age | Stage | Therapy Types | Drugs | Outcome |
| IGFL1 | insertion | Frame_Shift_Ins | novel | c.155_156insTCTGGGAACTCTGG | p.Gln52HisfsTer42 | p.Q52Hfs*42 | Q6UW32 | protein_coding | TCGA-AN-A0FN-01 | Breast | breast invasive carcinoma | Female | <65 | I/II | Unknown | Unknown | SD | ||
| IGFL1 | insertion | Frame_Shift_Ins | novel | c.158_159insAGAAGAAAGGTGGGAAAGCCAGA | p.His53GlnfsTer44 | p.H53Qfs*44 | Q6UW32 | protein_coding | TCGA-AN-A0FN-01 | Breast | breast invasive carcinoma | Female | <65 | I/II | Unknown | Unknown | SD | ||
| IGFL1 | SNV | Missense_Mutation | rs757887214 | c.58N>T | p.Leu20Phe | p.L20F | Q6UW32 | protein_coding | tolerated(0.24) | benign(0.027) | TCGA-AZ-4315-01 | Colorectum | colon adenocarcinoma | Male | <65 | I/II | Unknown | Unknown | SD |
| IGFL1 | SNV | Missense_Mutation | c.172N>T | p.Asp58Tyr | p.D58Y | Q6UW32 | protein_coding | deleterious(0) | possibly_damaging(0.847) | TCGA-DM-A0XD-01 | Colorectum | colon adenocarcinoma | Male | >=65 | I/II | Unknown | Unknown | PD | |
| IGFL1 | SNV | Missense_Mutation | c.173A>G | p.Asp58Gly | p.D58G | Q6UW32 | protein_coding | deleterious(0.04) | benign(0.027) | TCGA-AP-A0LM-01 | Endometrium | uterine corpus endometrioid carcinoma | Female | <65 | III/IV | Chemotherapy | cisplatin | SD | |
| IGFL1 | SNV | Missense_Mutation | c.293N>T | p.Ala98Val | p.A98V | Q6UW32 | protein_coding | tolerated(0.22) | benign(0.007) | TCGA-B5-A0JY-01 | Endometrium | uterine corpus endometrioid carcinoma | Female | <65 | III/IV | Chemotherapy | doxorubicin | SD | |
| IGFL1 | SNV | Missense_Mutation | c.258C>A | p.Phe86Leu | p.F86L | Q6UW32 | protein_coding | tolerated(0.4) | benign(0.001) | TCGA-55-5899-01 | Lung | lung adenocarcinoma | Male | <65 | I/II | Chemotherapy | carboplatin | CR | |
| IGFL1 | SNV | Missense_Mutation | c.260N>A | p.Met87Lys | p.M87K | Q6UW32 | protein_coding | tolerated(0.34) | benign(0.069) | TCGA-62-A46O-01 | Lung | lung adenocarcinoma | Female | >=65 | I/II | Unknown | Unknown | PD | |
| IGFL1 | SNV | Missense_Mutation | c.260N>A | p.Met87Lys | p.M87K | Q6UW32 | protein_coding | tolerated(0.34) | benign(0.069) | TCGA-L9-A444-01 | Lung | lung adenocarcinoma | Female | <65 | I/II | Unknown | Unknown | SD | |
| IGFL1 | SNV | Missense_Mutation | novel | c.154C>A | p.Gln52Lys | p.Q52K | Q6UW32 | protein_coding | deleterious(0.02) | benign(0.057) | TCGA-MN-A4N4-01 | Lung | lung adenocarcinoma | Male | <65 | I/II | Unknown | Unknown | SD |
| Page: 1 2 |
Top |
Related drugs of malignant transformation related genes |
| Identification of chemicals and drugs interact with genes involved in malignant transfromation |
| (DGIdb 4.0) |
| Entrez ID | Symbol | Category | Interaction Types | Drug Claim Name | Drug Name | PMIDs |
| Page: 1 |

Copyright 2023-Present -The University of Texas Health Science Center at Houston |