Schematic overview of the cellular and molecular mechanisms involved in the cancer progression, including the proposed cellular and molecular mechanisms in cancer cells trajectory. AT1: alveolar type 1 cells; AT2: alveolar type 2 cells; AAH: atypical adenomatous hyperplasia; AIS: adenocarcinoma in situ; MIA: minimally invasive adenocarcinoma; IA: invasive adenocarcinoma; EMT: epithelial-mesenchymal transition

Home

Download

Statistics

Help

Contact

Center for Computational Systems Medicine
leaf

Gene summary

leaf

Malignant transformation analysis

leaf

Malignant transformation related pathway analysis

leaf

Cell-cell communication analysis

leaf

Single-cell gene regulatory network inference analysis

leaf

Somatic mutation of malignant transformation related genes

leaf

Related drugs of malignant transformation related genes

Gene: IGFBP6

Gene summary for IGFBP6

check button Gene summary.

Gene informationSpeciesHuman
Gene symbol

IGFBP6

Gene ID

3489

Gene nameinsulin like growth factor binding protein 6
Gene AliasIBP6
Cytomap12q13.13
Gene Typeprotein-coding
GO ID

GO:0000165

UniProtAcc

P24592


Top

Malignant transformation analysis

check button Identification of the aberrant gene expression in precancerous and cancerous lesions by comparing the gene expression of stem-like cells in diseased tissues with normal stem cells
check button Malignant transformation involving gene list.
Entrez IDSymbolReplicatesSpeciesOrganTissueAdj P-valueLog2FCMalignancy
3489IGFBP6TumorHumanCervixCC1.57e-297.28e-010.1241
3489IGFBP6sample3HumanCervixCC2.28e-266.42e-010.1387
3489IGFBP6T3HumanCervixCC2.15e-306.44e-010.1389
3489IGFBP6AEH-subject1HumanEndometriumAEH1.22e-28-6.54e-01-0.3059
3489IGFBP6AEH-subject2HumanEndometriumAEH6.31e-23-6.51e-01-0.2525
3489IGFBP6AEH-subject3HumanEndometriumAEH1.17e-31-6.80e-01-0.2576
3489IGFBP6AEH-subject4HumanEndometriumAEH1.08e-16-6.40e-01-0.2657
3489IGFBP6AEH-subject5HumanEndometriumAEH4.32e-36-6.92e-01-0.2953
3489IGFBP6EEC-subject1HumanEndometriumEEC2.00e-39-6.96e-01-0.2682
3489IGFBP6EEC-subject2HumanEndometriumEEC4.59e-39-7.11e-01-0.2607
3489IGFBP6EEC-subject3HumanEndometriumEEC8.95e-36-6.66e-01-0.2525
3489IGFBP6EEC-subject4HumanEndometriumEEC2.12e-28-6.61e-01-0.2571
3489IGFBP6EEC-subject5HumanEndometriumEEC1.38e-33-6.68e-01-0.249
3489IGFBP6GSM5276934HumanEndometriumEEC8.35e-276.16e-01-0.0913
3489IGFBP6GSM5276935HumanEndometriumEEC1.17e-37-6.95e-01-0.123
3489IGFBP6GSM6177620_NYU_UCEC1_lib1_lib1HumanEndometriumEEC1.03e-28-7.15e-01-0.1869
3489IGFBP6GSM6177620_NYU_UCEC1_lib2_lib2HumanEndometriumEEC1.19e-25-7.15e-01-0.1875
3489IGFBP6GSM6177620_NYU_UCEC1_lib3_lib3HumanEndometriumEEC5.88e-25-6.93e-01-0.1883
3489IGFBP6GSM6177621_NYU_UCEC2_lib1_lib1HumanEndometriumEEC3.75e-43-7.04e-01-0.1934
3489IGFBP6GSM6177622_NYU_UCEC3_lib1_lib1HumanEndometriumEEC5.43e-41-7.06e-01-0.1917
Page: 1 2 3 4 5 6 7 

check button Transcriptomic changes along malignancy continuum.
TissueExpression DynamicsAbbreviation
CervixThe image shows the transcriptomic changes along malignancy continuum.log2FC in expression of this searched gene in stem-like cells from each diseased tissue sample relative to stem-like cells in normal samples in each tissue plotted against the malignancy continuum. Samples are colored based on if they are from different disease stage.CC: Cervix cancer
HSIL_HPV: HPV-infected high-grade squamous intraepithelial lesions
N_HPV: HPV-infected normal cervix
EndometriumThe image shows the transcriptomic changes along malignancy continuum.log2FC in expression of this searched gene in stem-like cells from each diseased tissue sample relative to stem-like cells in normal samples in each tissue plotted against the malignancy continuum. Samples are colored based on if they are from different disease stage.AEH: Atypical endometrial hyperplasia
EEC: Endometrioid Cancer
EsophagusThe image shows the transcriptomic changes along malignancy continuum.log2FC in expression of this searched gene in stem-like cells from each diseased tissue sample relative to stem-like cells in normal samples in each tissue plotted against the malignancy continuum. Samples are colored based on if they are from different disease stage.
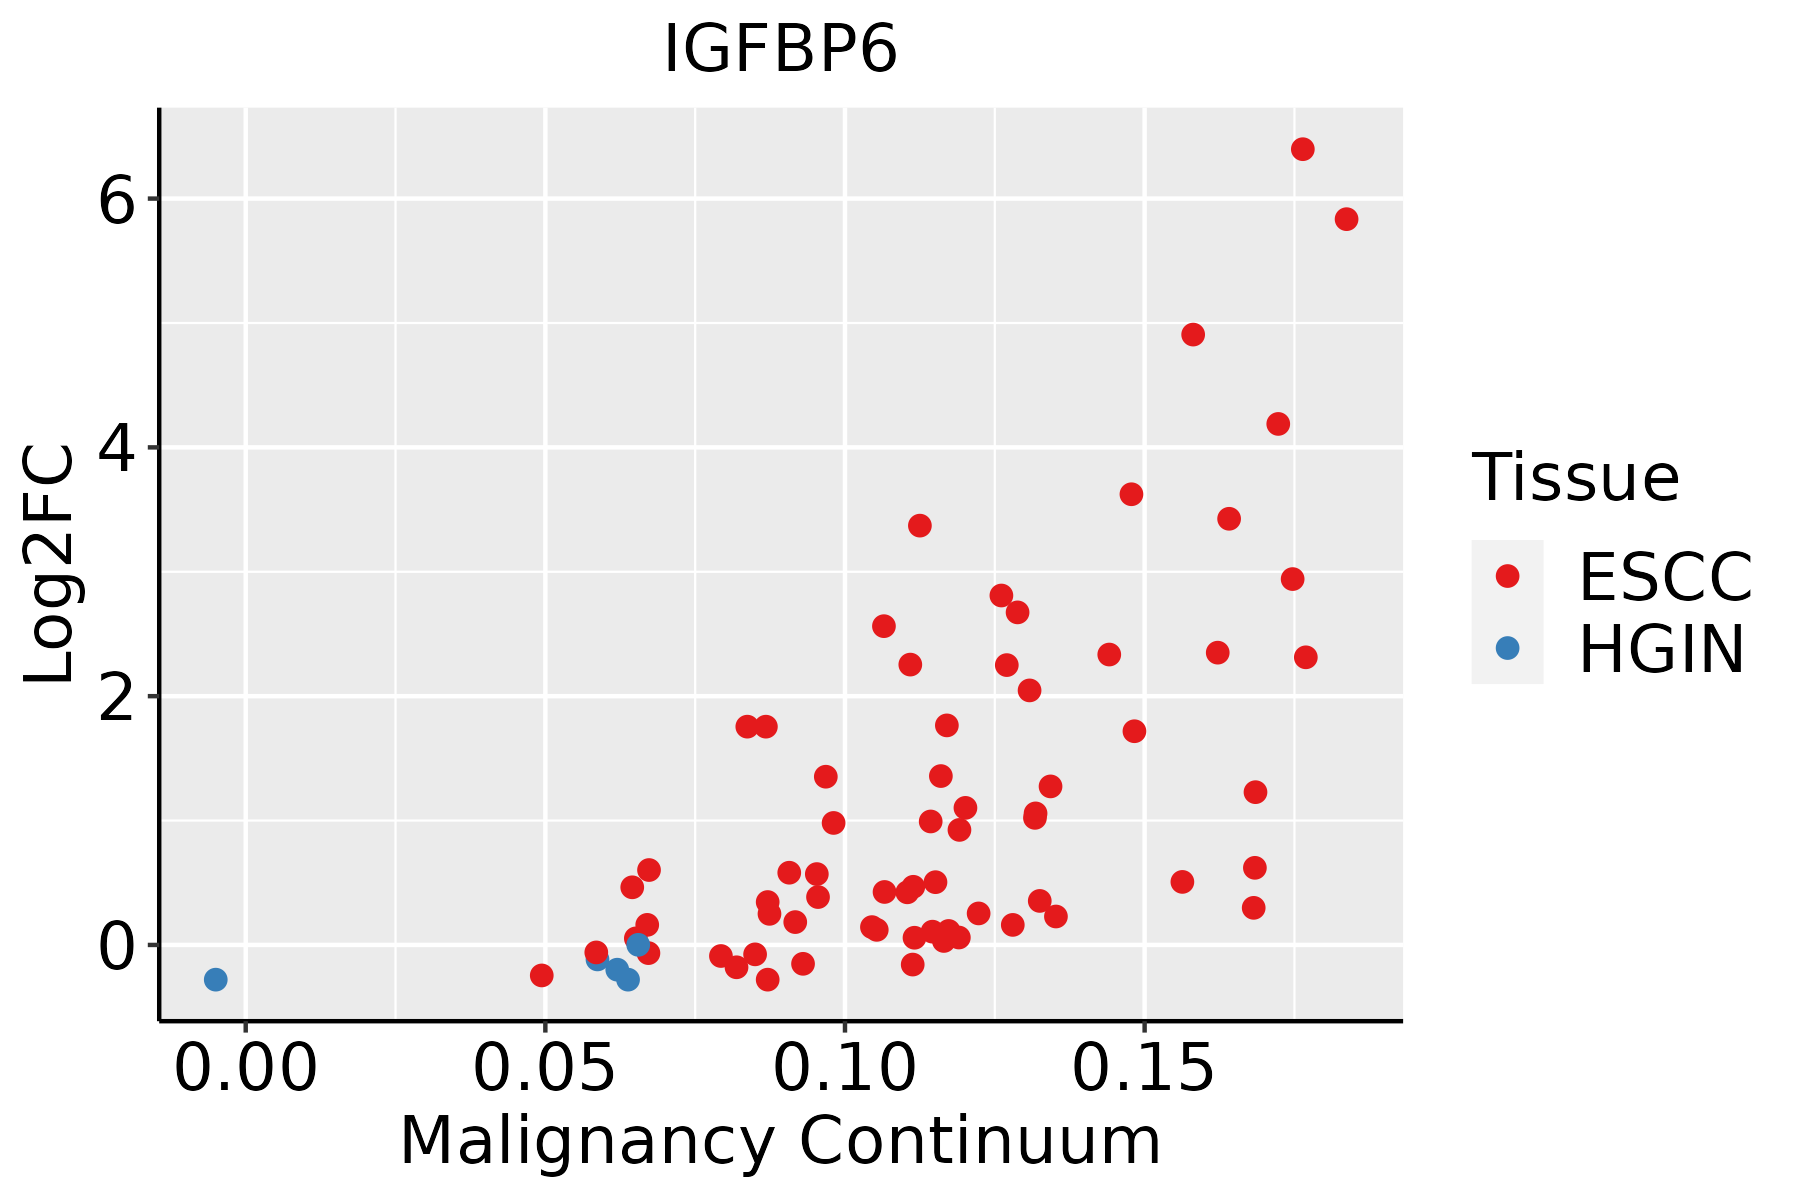
ESCC: Esophageal squamous cell carcinoma
HGIN: High-grade intraepithelial neoplasias
LGIN: Low-grade intraepithelial neoplasias
LiverThe image shows the transcriptomic changes along malignancy continuum.log2FC in expression of this searched gene in stem-like cells from each diseased tissue sample relative to stem-like cells in normal samples in each tissue plotted against the malignancy continuum. Samples are colored based on if they are from different disease stage.
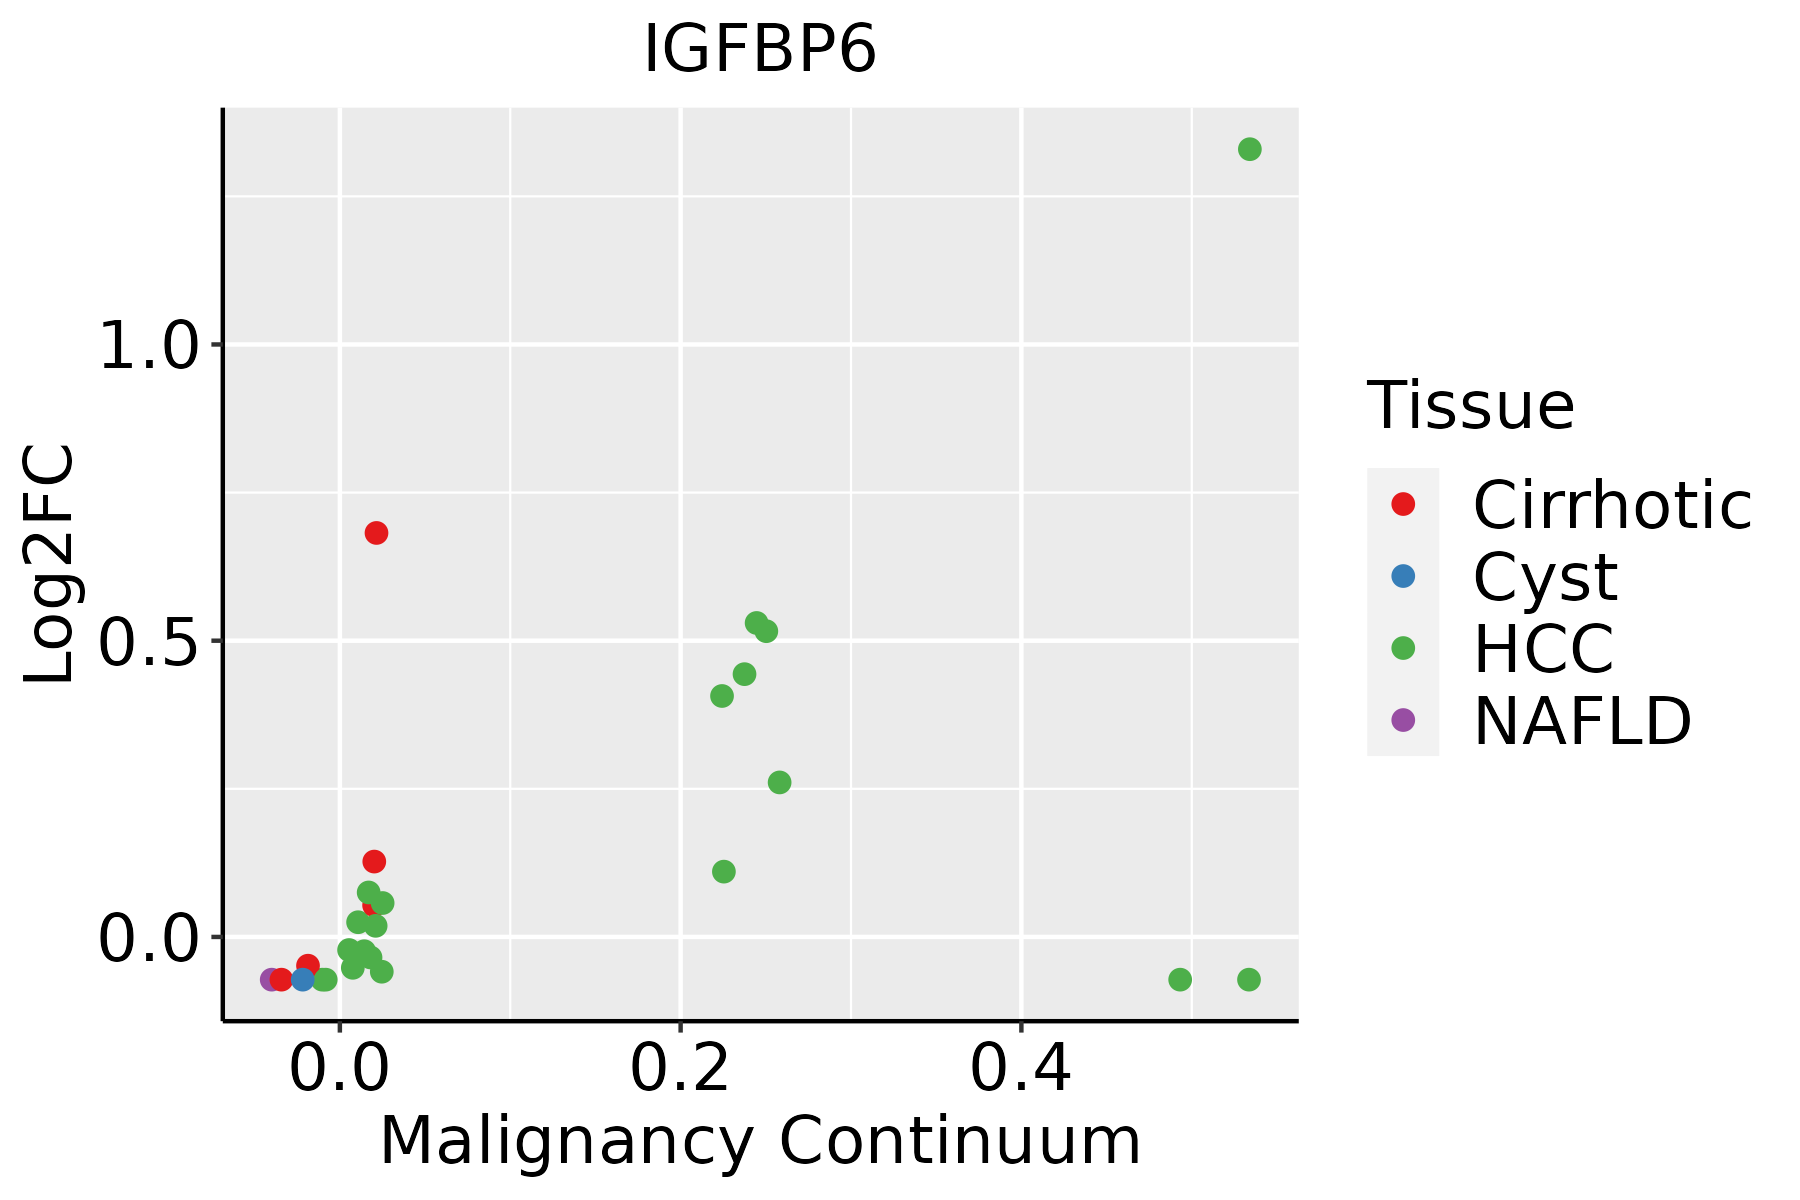
HCC: Hepatocellular carcinoma
NAFLD: Non-alcoholic fatty liver disease
LungThe image shows the transcriptomic changes along malignancy continuum.log2FC in expression of this searched gene in stem-like cells from each diseased tissue sample relative to stem-like cells in normal samples in each tissue plotted against the malignancy continuum. Samples are colored based on if they are from different disease stage.
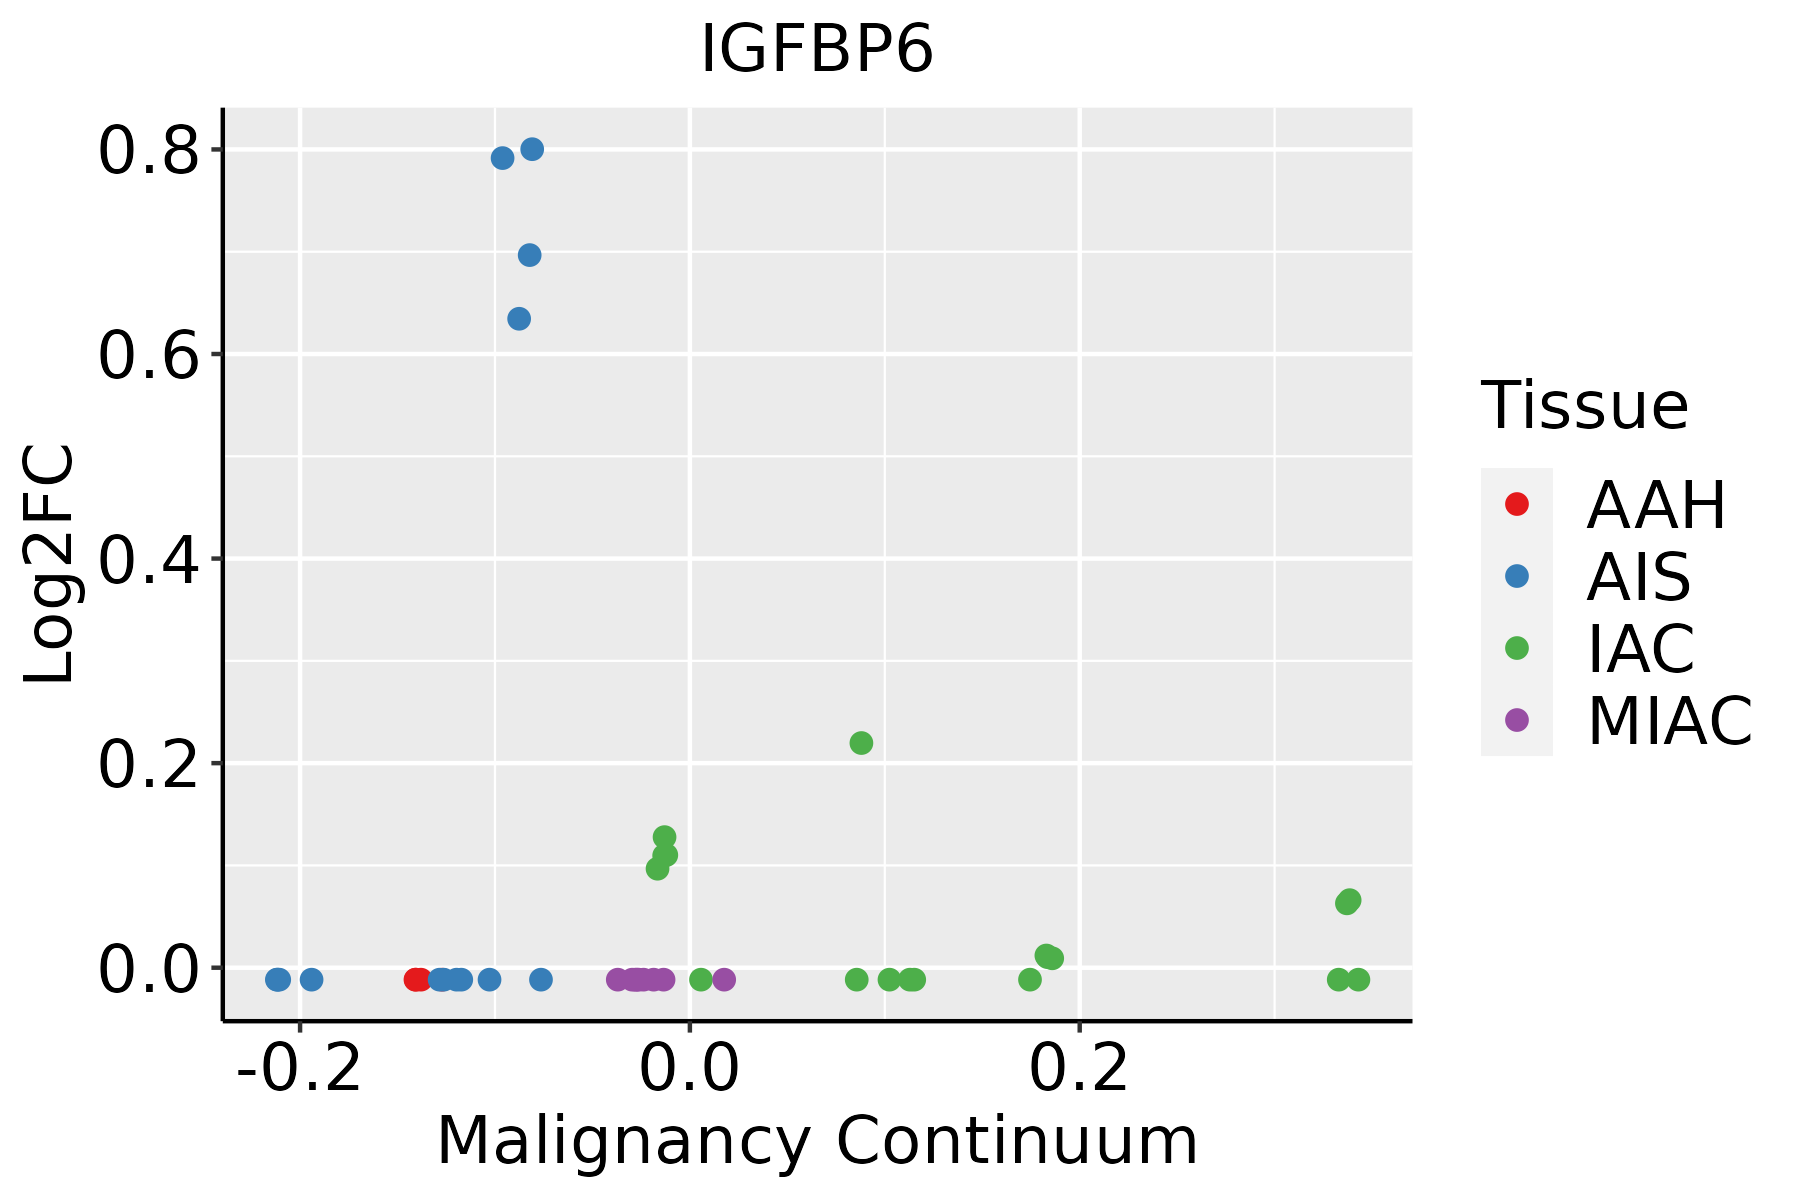
AAH: Atypical adenomatous hyperplasia
AIS: Adenocarcinoma in situ
IAC: Invasive lung adenocarcinoma
MIA: Minimally invasive adenocarcinoma
Oral CavityThe image shows the transcriptomic changes along malignancy continuum.log2FC in expression of this searched gene in stem-like cells from each diseased tissue sample relative to stem-like cells in normal samples in each tissue plotted against the malignancy continuum. Samples are colored based on if they are from different disease stage.
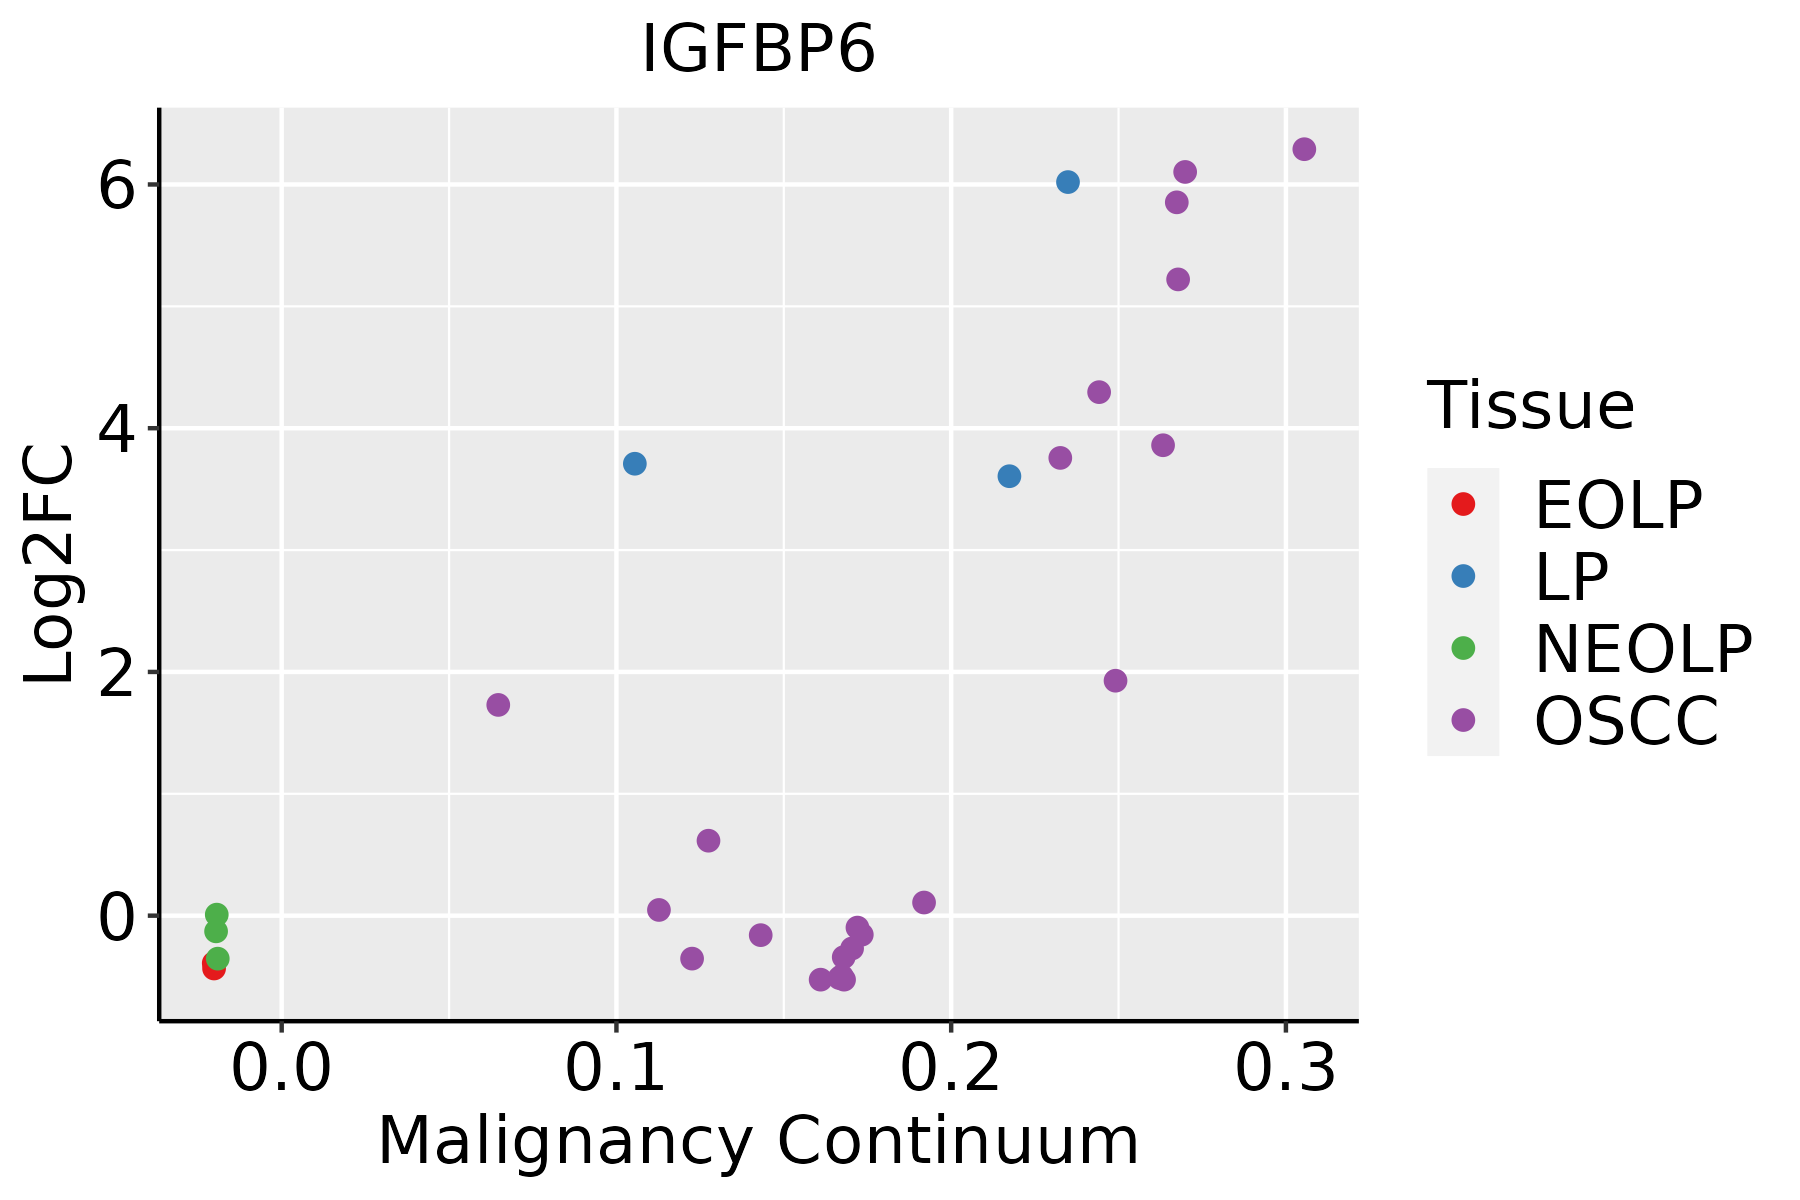
EOLP: Erosive Oral lichen planus
LP: leukoplakia
NEOLP: Non-erosive oral lichen planus
OSCC: Oral squamous cell carcinoma
SkinThe image shows the transcriptomic changes along malignancy continuum.log2FC in expression of this searched gene in stem-like cells from each diseased tissue sample relative to stem-like cells in normal samples in each tissue plotted against the malignancy continuum. Samples are colored based on if they are from different disease stage.AK: Actinic keratosis
cSCC: Cutaneous squamous cell carcinoma
SCCIS:squamous cell carcinoma in situ
ThyroidThe image shows the transcriptomic changes along malignancy continuum.log2FC in expression of this searched gene in stem-like cells from each diseased tissue sample relative to stem-like cells in normal samples in each tissue plotted against the malignancy continuum. Samples are colored based on if they are from different disease stage.ATC: Anaplastic thyroid cancer
HT: Hashimoto's thyroiditis
PTC: Papillary thyroid cancer
∗log2FC in expression of this searched gene in stem-like cells from each diseased tissue sample relative to stem-like cells in normal samples in each tissue plotted against the malignancy continuum. Samples are colored based on if they are from different disease stage.

Top

Malignant transformation related pathway analysis

check buttonFind out the enriched GO biological processes and KEGG pathways involved in transition from healthy to precancer to cancer
check button Figure of enriched GO biological processes.
TissueDisease StageEnriched GO biological Processes
ColorectumADGO analysis - Figure of enriched GO biological processes: Top 15 enriched GO BP terms are showed in the bar plot of each disease state in each tissue. Each row represents a significant GO biological process which is colored according to the -log10(p.adjust).
ColorectumSERGO analysis - Figure of enriched GO biological processes: Top 15 enriched GO BP terms are showed in the bar plot of each disease state in each tissue. Each row represents a significant GO biological process which is colored according to the -log10(p.adjust).
ColorectumMSSGO analysis - Figure of enriched GO biological processes: Top 15 enriched GO BP terms are showed in the bar plot of each disease state in each tissue. Each row represents a significant GO biological process which is colored according to the -log10(p.adjust).
ColorectumMSI-HGO analysis - Figure of enriched GO biological processes: Top 15 enriched GO BP terms are showed in the bar plot of each disease state in each tissue. Each row represents a significant GO biological process which is colored according to the -log10(p.adjust).
ColorectumFAPGO analysis - Figure of enriched GO biological processes: Top 15 enriched GO BP terms are showed in the bar plot of each disease state in each tissue. Each row represents a significant GO biological process which is colored according to the -log10(p.adjust).
∗Top 15 enriched GO BP terms are showed in the bar plot of each disease state in each tissue. Each row represents a significant GO biological process which is colored according to the -log10(p.adjust).
Page: 1 2 3 4 5 6 7 8 9 

check button Enriched GO biological processes.
GO IDTissueDisease StageDescriptionGene RatioBg Ratiopvaluep.adjustCount
GO:00160557CervixCCWnt signaling pathway98/2311444/187234.82e-094.65e-0798
GO:01987387CervixCCcell-cell signaling by wnt98/2311446/187236.16e-095.58e-0798
GO:00301117CervixCCregulation of Wnt signaling pathway76/2311328/187233.05e-082.08e-0676
GO:00310988CervixCCstress-activated protein kinase signaling cascade58/2311247/187238.02e-072.89e-0558
GO:00608287CervixCCregulation of canonical Wnt signaling pathway58/2311253/187231.83e-065.89e-0558
GO:00600707CervixCCcanonical Wnt signaling pathway66/2311303/187232.47e-067.35e-0566
GO:00514038CervixCCstress-activated MAPK cascade55/2311239/187232.96e-068.31e-0555
GO:00703027CervixCCregulation of stress-activated protein kinase signaling cascade46/2311195/187239.35e-062.11e-0446
GO:00434104CervixCCpositive regulation of MAPK cascade90/2311480/187232.92e-054.83e-0490
GO:00328727CervixCCregulation of stress-activated MAPK cascade44/2311192/187233.09e-055.10e-0444
GO:00301784CervixCCnegative regulation of Wnt signaling pathway35/2311170/187231.52e-031.17e-0235
GO:00900901CervixCCnegative regulation of canonical Wnt signaling pathway29/2311137/187232.40e-031.70e-0229
GO:00703043CervixCCpositive regulation of stress-activated protein kinase signaling cascade27/2311128/187233.49e-032.26e-0227
GO:00301118EndometriumAEHregulation of Wnt signaling pathway71/2100328/187233.31e-081.87e-0671
GO:00160558EndometriumAEHWnt signaling pathway85/2100444/187234.99e-071.97e-0585
GO:01987388EndometriumAEHcell-cell signaling by wnt85/2100446/187236.07e-072.29e-0585
GO:00608288EndometriumAEHregulation of canonical Wnt signaling pathway54/2100253/187232.22e-066.56e-0554
GO:00514039EndometriumAEHstress-activated MAPK cascade50/2100239/187239.33e-062.18e-0450
GO:00310989EndometriumAEHstress-activated protein kinase signaling cascade51/2100247/187231.12e-052.52e-0451
GO:00328728EndometriumAEHregulation of stress-activated MAPK cascade42/2100192/187231.53e-053.23e-0442
Page: 1 2 3 4 5 6 7 8 9 10 

check button Enriched KEGG pathways.
Pathway IDTissueDisease StageDescriptionGene RatioBg Ratiopvaluep.adjustqvalueCount
Page: 1 

Top

Cell-cell communication analysis

check buttonIdentification of potential cell-cell interactions between two cell types and their ligand-receptor pairs for different disease states
LigandReceptorLRpairPathwayTissueDisease Stage
Page: 1 

Top

Single-cell gene regulatory network inference analysis

check buttonFind out the significant the regulons (TFs) and the target genes of each regulon across cell types for different disease states
TFCell TypeTissueDisease StageTarget GeneRSSRegulon Activity
∗The dot plots of a searched regulon are shown for all cell subpopulations in each disease state of each tissue based on the regulon specific score inferred using pySCENIC and by calculating the average expression.
Page: 1 

Top

Somatic mutation of malignant transformation related genes

check buttonAnnotation of somatic variants for genes involved in malignant transformation
Hugo SymbolVariant ClassVariant ClassificationdbSNP RSHGVScHGVSpHGVSp ShortSWISSPROTBIOTYPESIFTPolyPhenTumor Sample BarcodeTissueHistologySexAgeStageTherapy TypesDrugsOutcome
IGFBP6SNVMissense_Mutationc.364C>Ap.Pro122Thrp.P122TP24592protein_codingtolerated(0.1)benign(0.255)TCGA-E2-A1II-01Breastbreast invasive carcinomaFemale<65I/IIChemotherapydoxorubicinSD
IGFBP6insertionNonsense_Mutationnovelc.582_583insGGACTGAGGGCAGGCTAGGGCGTAGGTTAGGGGAGAGGGGAGAAAGAGp.Gly194_Phe195insGlyLeuArgAlaGlyTerGlyValGlyTerGlyArgGlyGluLysGlup.G194_F195insGLRAG*GVG*GRGEKEP24592protein_codingTCGA-AR-A0TY-01Breastbreast invasive carcinomaFemale<65I/IIUnspecificPaclitaxelPD
IGFBP6SNVMissense_Mutationc.614A>Gp.Gln205Argp.Q205RP24592protein_codingdeleterious(0.04)possibly_damaging(0.478)TCGA-AZ-6598-01Colorectumcolon adenocarcinomaFemale>=65I/IIUnknownUnknownSD
IGFBP6SNVMissense_Mutationc.245N>Ap.Leu82Glnp.L82QP24592protein_codingdeleterious(0)probably_damaging(0.999)TCGA-CM-4743-01Colorectumcolon adenocarcinomaMale>=65I/IIChemotherapycapecitabineSD
IGFBP6SNVMissense_Mutationnovelc.656N>Ap.Gly219Aspp.G219DP24592protein_codingdeleterious(0)probably_damaging(1)TCGA-AJ-A3BH-01Endometriumuterine corpus endometrioid carcinomaFemaleUnknownI/IIUnknownUnknownSD
IGFBP6SNVMissense_Mutationrs771934053c.425G>Ap.Gly142Aspp.G142DP24592protein_codingdeleterious(0)possibly_damaging(0.82)TCGA-AX-A06F-01Endometriumuterine corpus endometrioid carcinomaFemale<65III/IVChemotherapycarboplatinSD
IGFBP6SNVMissense_Mutationrs375017830c.458N>Tp.Ala153Valp.A153VP24592protein_codingtolerated(0.14)benign(0.15)TCGA-B5-A11E-01Endometriumuterine corpus endometrioid carcinomaFemale<65I/IIUnknownUnknownSD
IGFBP6SNVMissense_Mutationnovelc.549N>Cp.Gln183Hisp.Q183HP24592protein_codingtolerated(0.75)benign(0.001)TCGA-B5-A1MR-01Endometriumuterine corpus endometrioid carcinomaFemale>=65III/IVUnknownUnknownSD
IGFBP6SNVMissense_Mutationnovelc.353A>Cp.Lys118Thrp.K118TP24592protein_codingtolerated(0.21)possibly_damaging(0.879)TCGA-B5-A1MX-01Endometriumuterine corpus endometrioid carcinomaFemale<65I/IIHormone TherapymegaceSD
IGFBP6SNVMissense_Mutationrs201732293c.491G>Ap.Arg164Hisp.R164HP24592protein_codingdeleterious(0)probably_damaging(0.989)TCGA-B5-A1MX-01Endometriumuterine corpus endometrioid carcinomaFemale<65I/IIHormone TherapymegaceSD
Page: 1 2 

Top

Related drugs of malignant transformation related genes

check buttonIdentification of chemicals and drugs interact with genes involved in malignant transfromation
(DGIdb 4.0)
Entrez IDSymbolCategoryInteraction TypesDrug Claim NameDrug NamePMIDs
3489IGFBP6DRUGGABLE GENOMEANTISERUM8940357
Page: 1