
|
|||||
|
 | |
| |
| |
| |
| |
| |
|
Gene: IGFBP2 |
Gene summary for IGFBP2 |
| Gene information | Species | Human | Gene symbol | IGFBP2 | Gene ID | 3485 |
| Gene name | insulin like growth factor binding protein 2 | |
| Gene Alias | IBP2 | |
| Cytomap | 2q35 | |
| Gene Type | protein-coding | GO ID | GO:0000003 | UniProtAcc | P18065 |
Top |
Malignant transformation analysis |
| Identification of the aberrant gene expression in precancerous and cancerous lesions by comparing the gene expression of stem-like cells in diseased tissues with normal stem cells |
| Entrez ID | Symbol | Replicates | Species | Organ | Tissue | Adj P-value | Log2FC | Malignancy |
| 3485 | IGFBP2 | GSM4909281 | Human | Breast | IDC | 1.35e-11 | 3.23e-01 | 0.21 |
| 3485 | IGFBP2 | GSM4909293 | Human | Breast | IDC | 5.87e-95 | 1.29e+00 | 0.1581 |
| 3485 | IGFBP2 | GSM4909301 | Human | Breast | IDC | 1.10e-03 | 2.17e-01 | 0.1577 |
| 3485 | IGFBP2 | GSM4909303 | Human | Breast | IDC | 2.38e-06 | 4.93e-01 | 0.0438 |
| 3485 | IGFBP2 | GSM4909307 | Human | Breast | IDC | 2.28e-07 | 2.77e-01 | 0.1569 |
| 3485 | IGFBP2 | GSM4909308 | Human | Breast | IDC | 1.58e-04 | 2.05e-01 | 0.158 |
| 3485 | IGFBP2 | GSM4909316 | Human | Breast | IDC | 4.73e-08 | 6.75e-01 | 0.21 |
| 3485 | IGFBP2 | GSM4909319 | Human | Breast | IDC | 2.28e-07 | 5.55e-02 | 0.1563 |
| 3485 | IGFBP2 | GSM4909321 | Human | Breast | IDC | 8.62e-13 | 4.56e-01 | 0.1559 |
| 3485 | IGFBP2 | ctrl6 | Human | Breast | Precancer | 3.78e-14 | 6.46e-01 | -0.0061 |
| 3485 | IGFBP2 | NCCBC3 | Human | Breast | DCIS | 1.61e-02 | 2.63e-01 | 0.1198 |
| 3485 | IGFBP2 | NCCBC5 | Human | Breast | DCIS | 1.68e-03 | 3.42e-01 | 0.2046 |
| 3485 | IGFBP2 | P3 | Human | Breast | IDC | 6.53e-05 | 6.65e-01 | 0.1542 |
| 3485 | IGFBP2 | DCIS2 | Human | Breast | DCIS | 5.83e-06 | -8.19e-02 | 0.0085 |
| 3485 | IGFBP2 | HTA11_3410_2000001011 | Human | Colorectum | AD | 1.03e-08 | 4.26e-01 | 0.0155 |
| 3485 | IGFBP2 | HTA11_2487_2000001011 | Human | Colorectum | SER | 5.04e-06 | 5.72e-01 | -0.1808 |
| 3485 | IGFBP2 | HTA11_2951_2000001011 | Human | Colorectum | AD | 3.76e-02 | 7.79e-01 | 0.0216 |
| 3485 | IGFBP2 | HTA11_1938_2000001011 | Human | Colorectum | AD | 1.89e-30 | 1.27e+00 | -0.0811 |
| 3485 | IGFBP2 | HTA11_78_2000001011 | Human | Colorectum | AD | 5.97e-27 | 1.03e+00 | -0.1088 |
| 3485 | IGFBP2 | HTA11_347_2000001011 | Human | Colorectum | AD | 3.77e-04 | 4.32e-01 | -0.1954 |
| Page: 1 2 3 4 5 6 7 8 9 10 11 |
| Tissue | Expression Dynamics | Abbreviation |
| Breast | 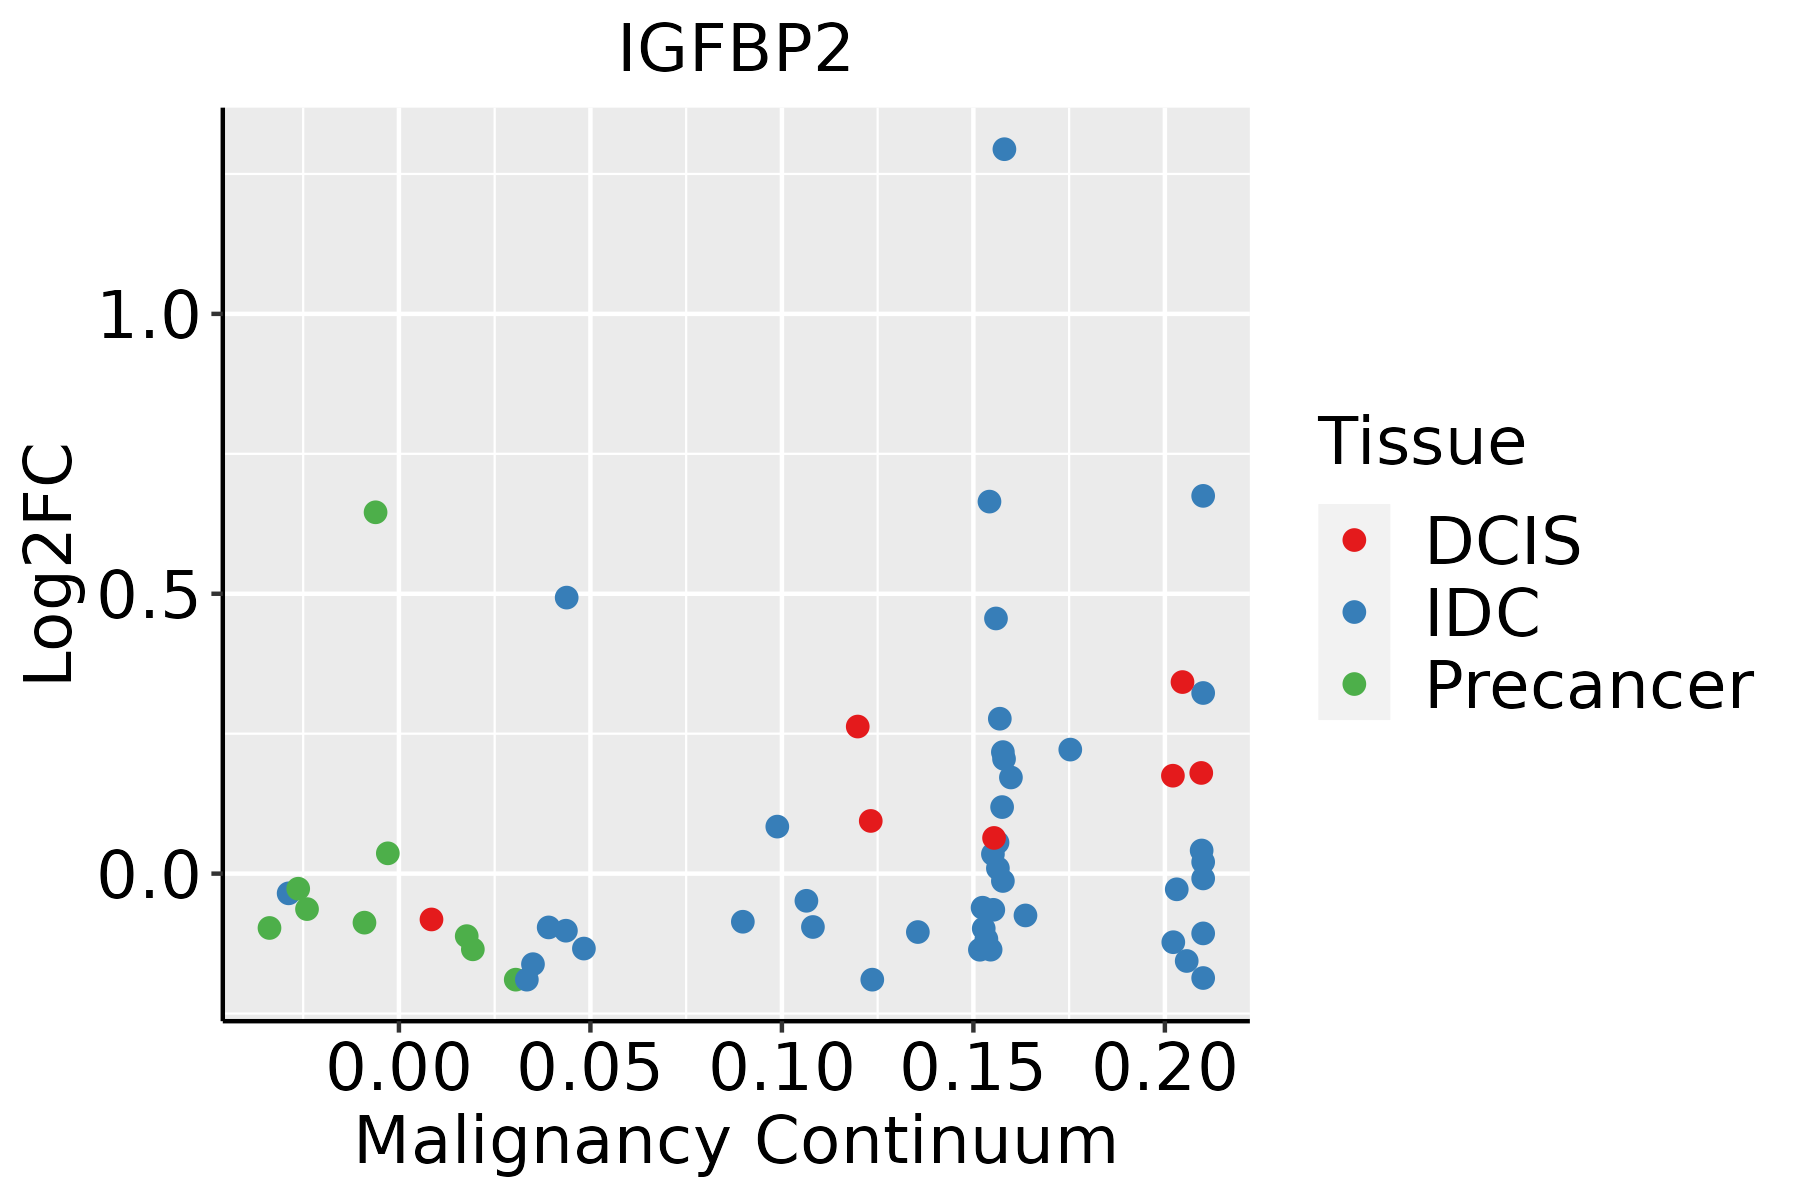 | IDC: Invasive ductal carcinoma |
| DCIS: Ductal carcinoma in situ | ||
| Precancer(BRCA1-mut): Precancerous lesion from BRCA1 mutation carriers | ||
| Colorectum (GSE201348) |  | FAP: Familial adenomatous polyposis |
| CRC: Colorectal cancer | ||
| Colorectum (HTA11) |  | AD: Adenomas |
| SER: Sessile serrated lesions | ||
| MSI-H: Microsatellite-high colorectal cancer | ||
| MSS: Microsatellite stable colorectal cancer | ||
| Endometrium | 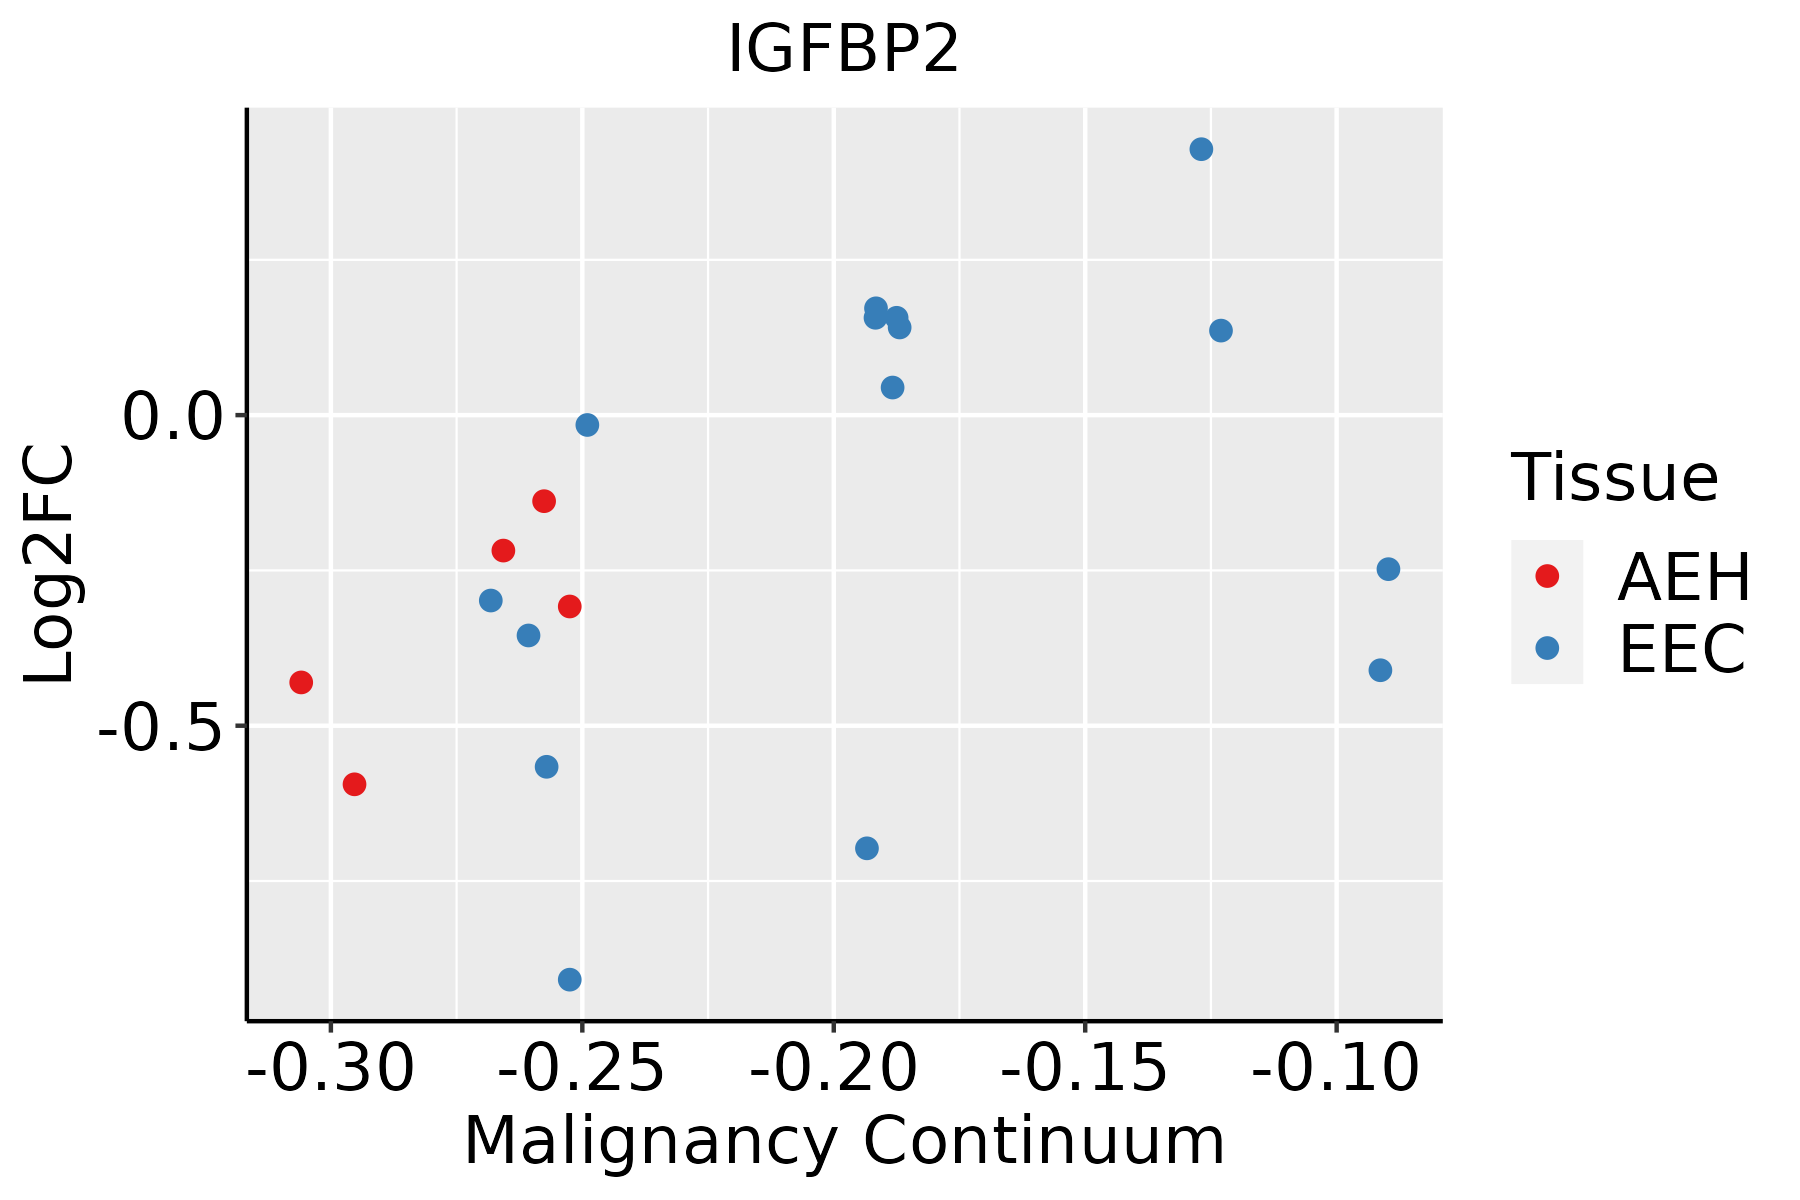 | AEH: Atypical endometrial hyperplasia |
| EEC: Endometrioid Cancer | ||
| Esophagus |  | ESCC: Esophageal squamous cell carcinoma |
| HGIN: High-grade intraepithelial neoplasias | ||
| LGIN: Low-grade intraepithelial neoplasias | ||
| GC |  | CAG: Chronic atrophic gastritis |
| CAG with IM: Chronic atrophic gastritis with intestinal metaplasia | ||
| CSG: Chronic superficial gastritis | ||
| GC: Gastric cancer | ||
| SIM: Severe intestinal metaplasia | ||
| WIM: Wild intestinal metaplasia | ||
| Liver | 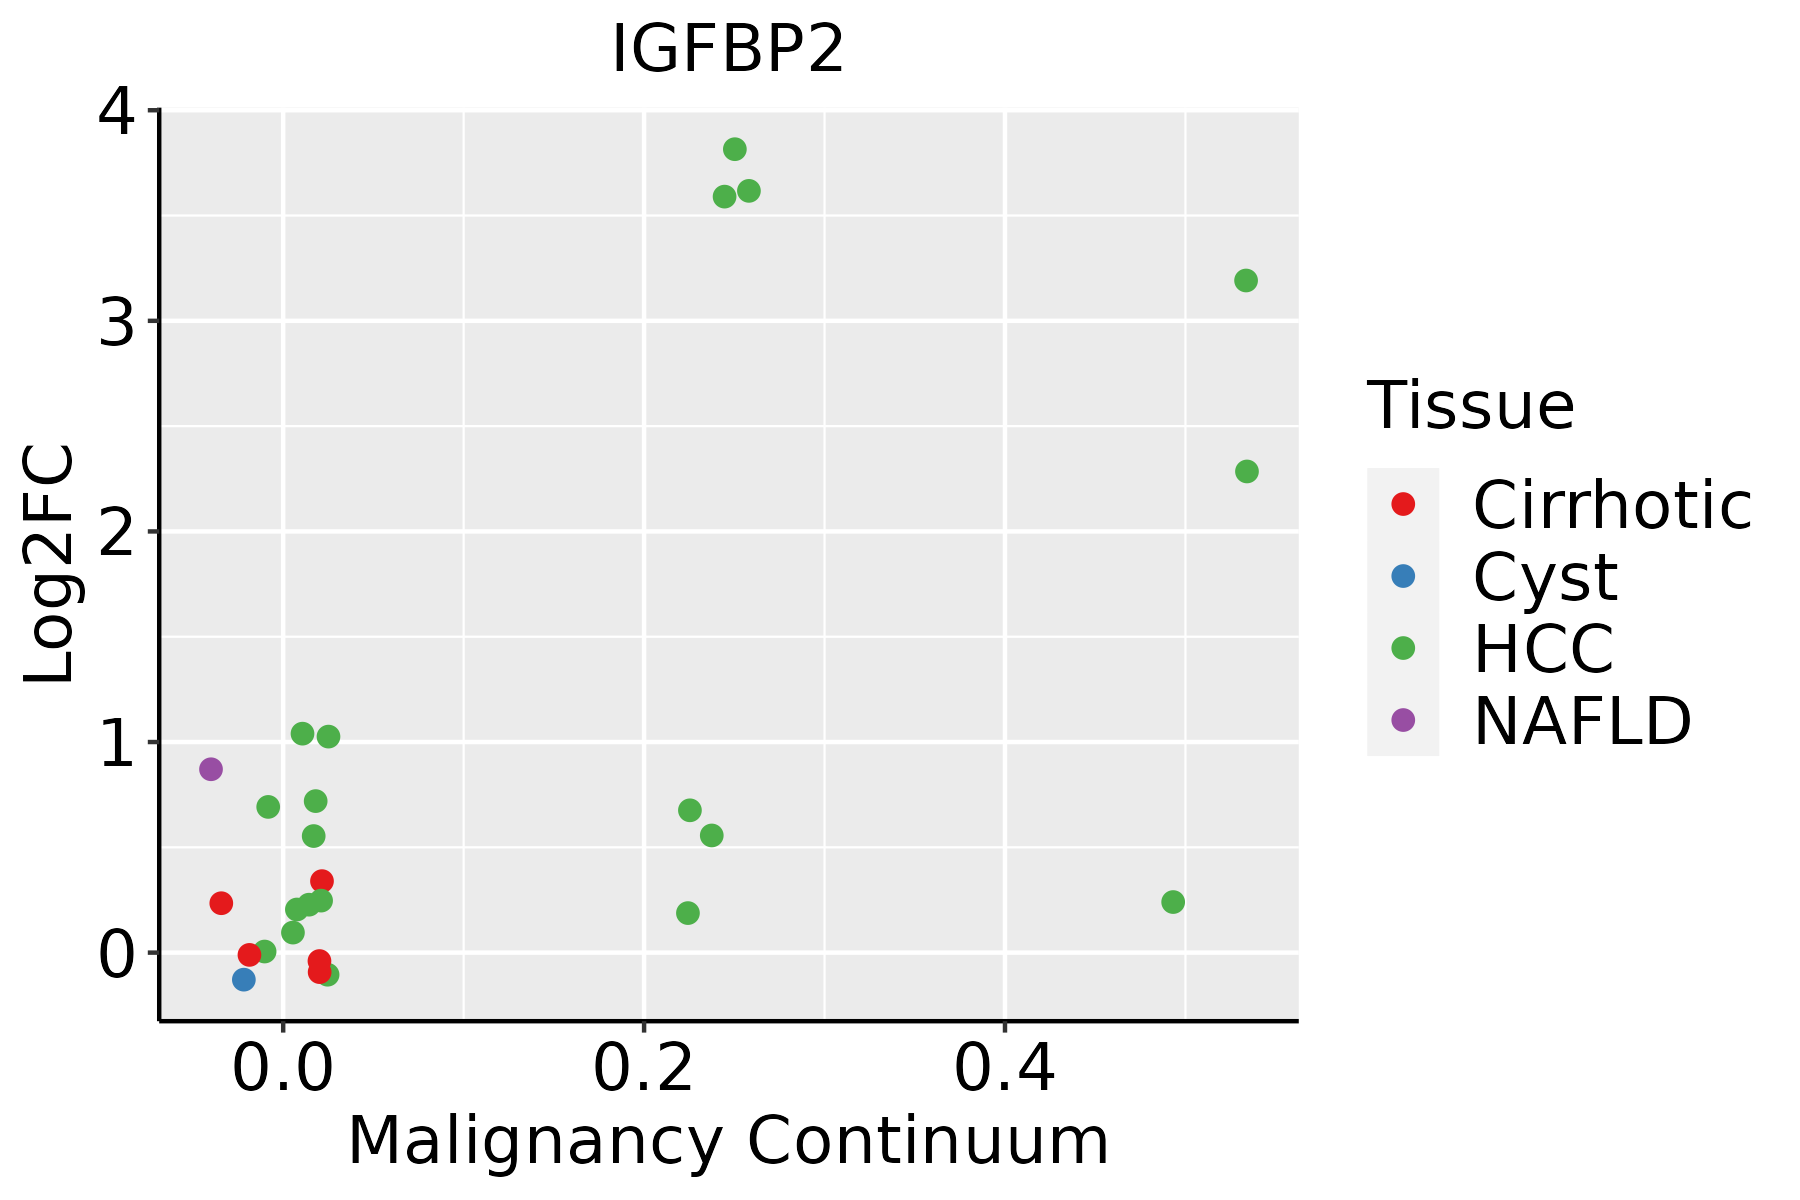 | HCC: Hepatocellular carcinoma |
| NAFLD: Non-alcoholic fatty liver disease | ||
| Lung | 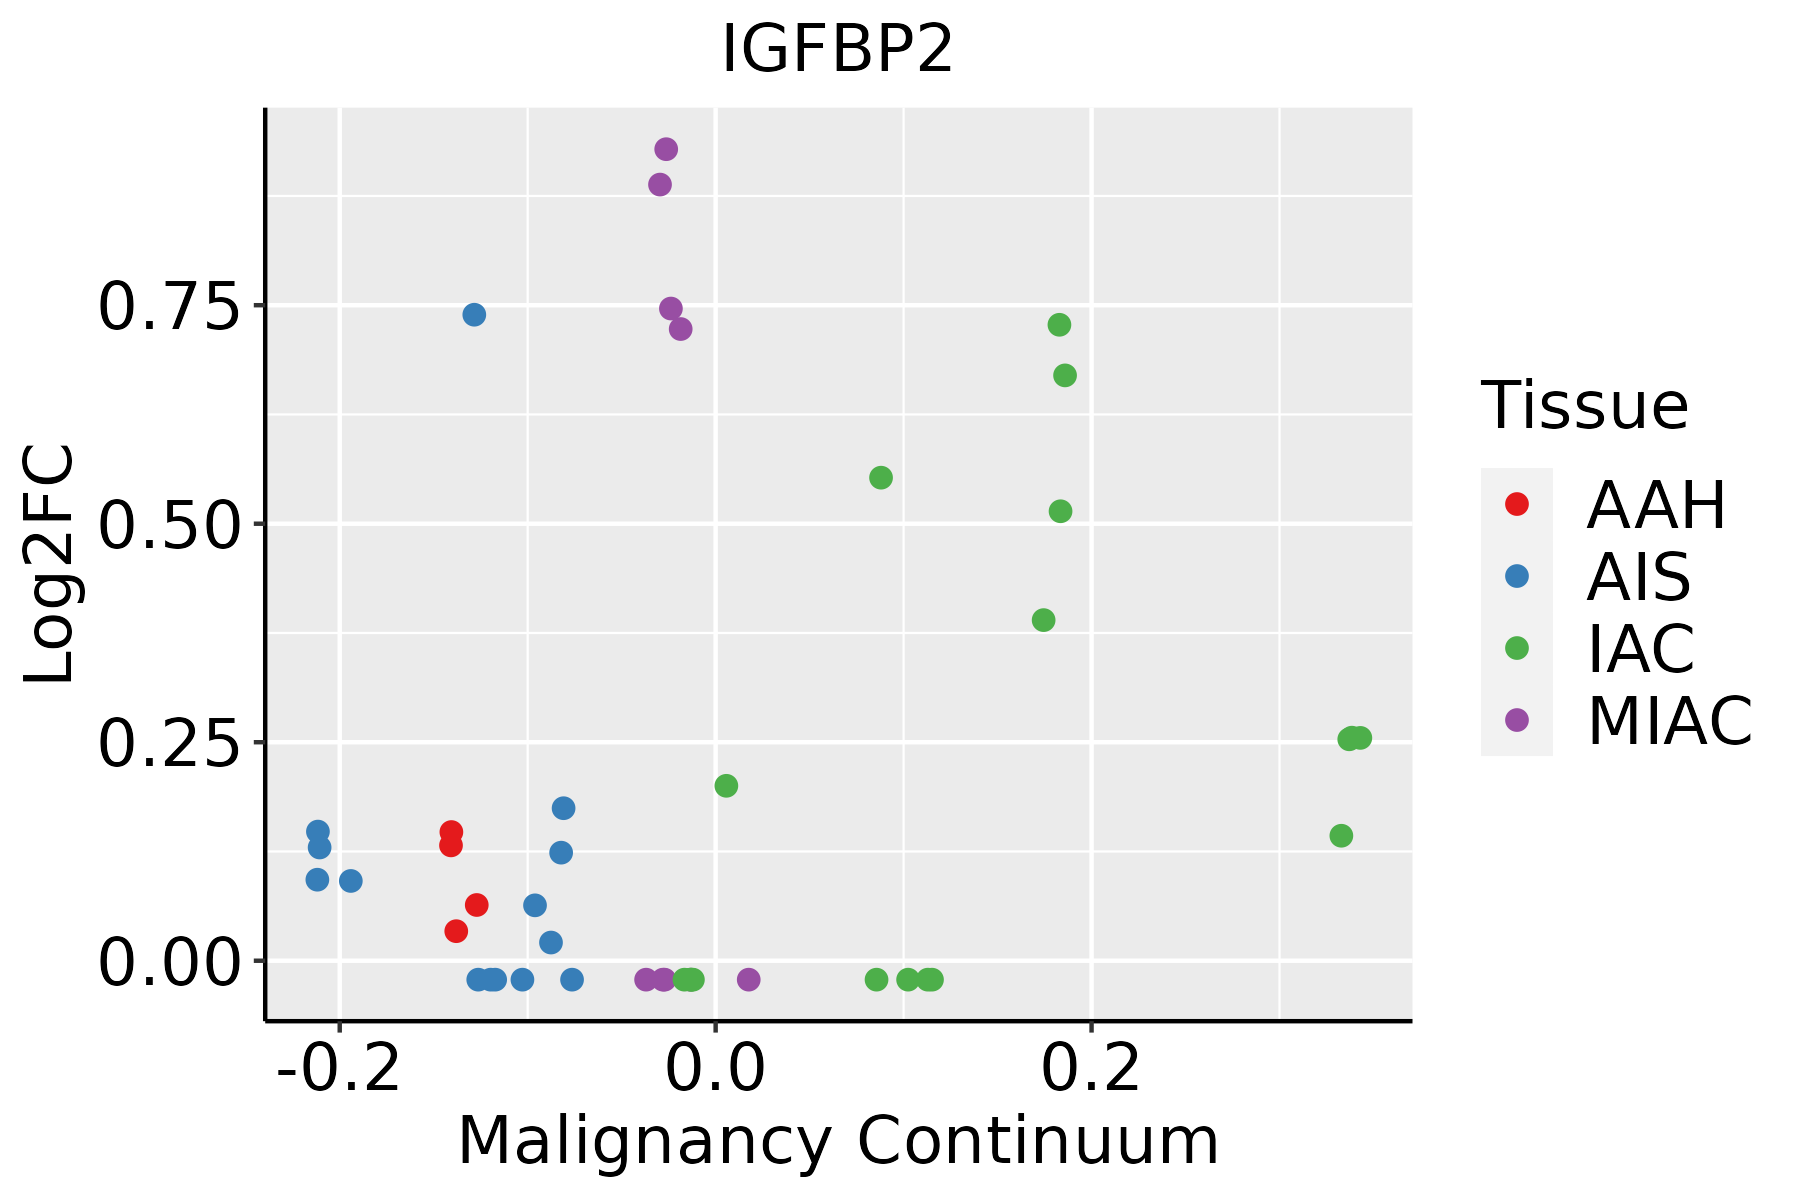 | AAH: Atypical adenomatous hyperplasia |
| AIS: Adenocarcinoma in situ | ||
| IAC: Invasive lung adenocarcinoma | ||
| MIA: Minimally invasive adenocarcinoma | ||
| Oral Cavity | 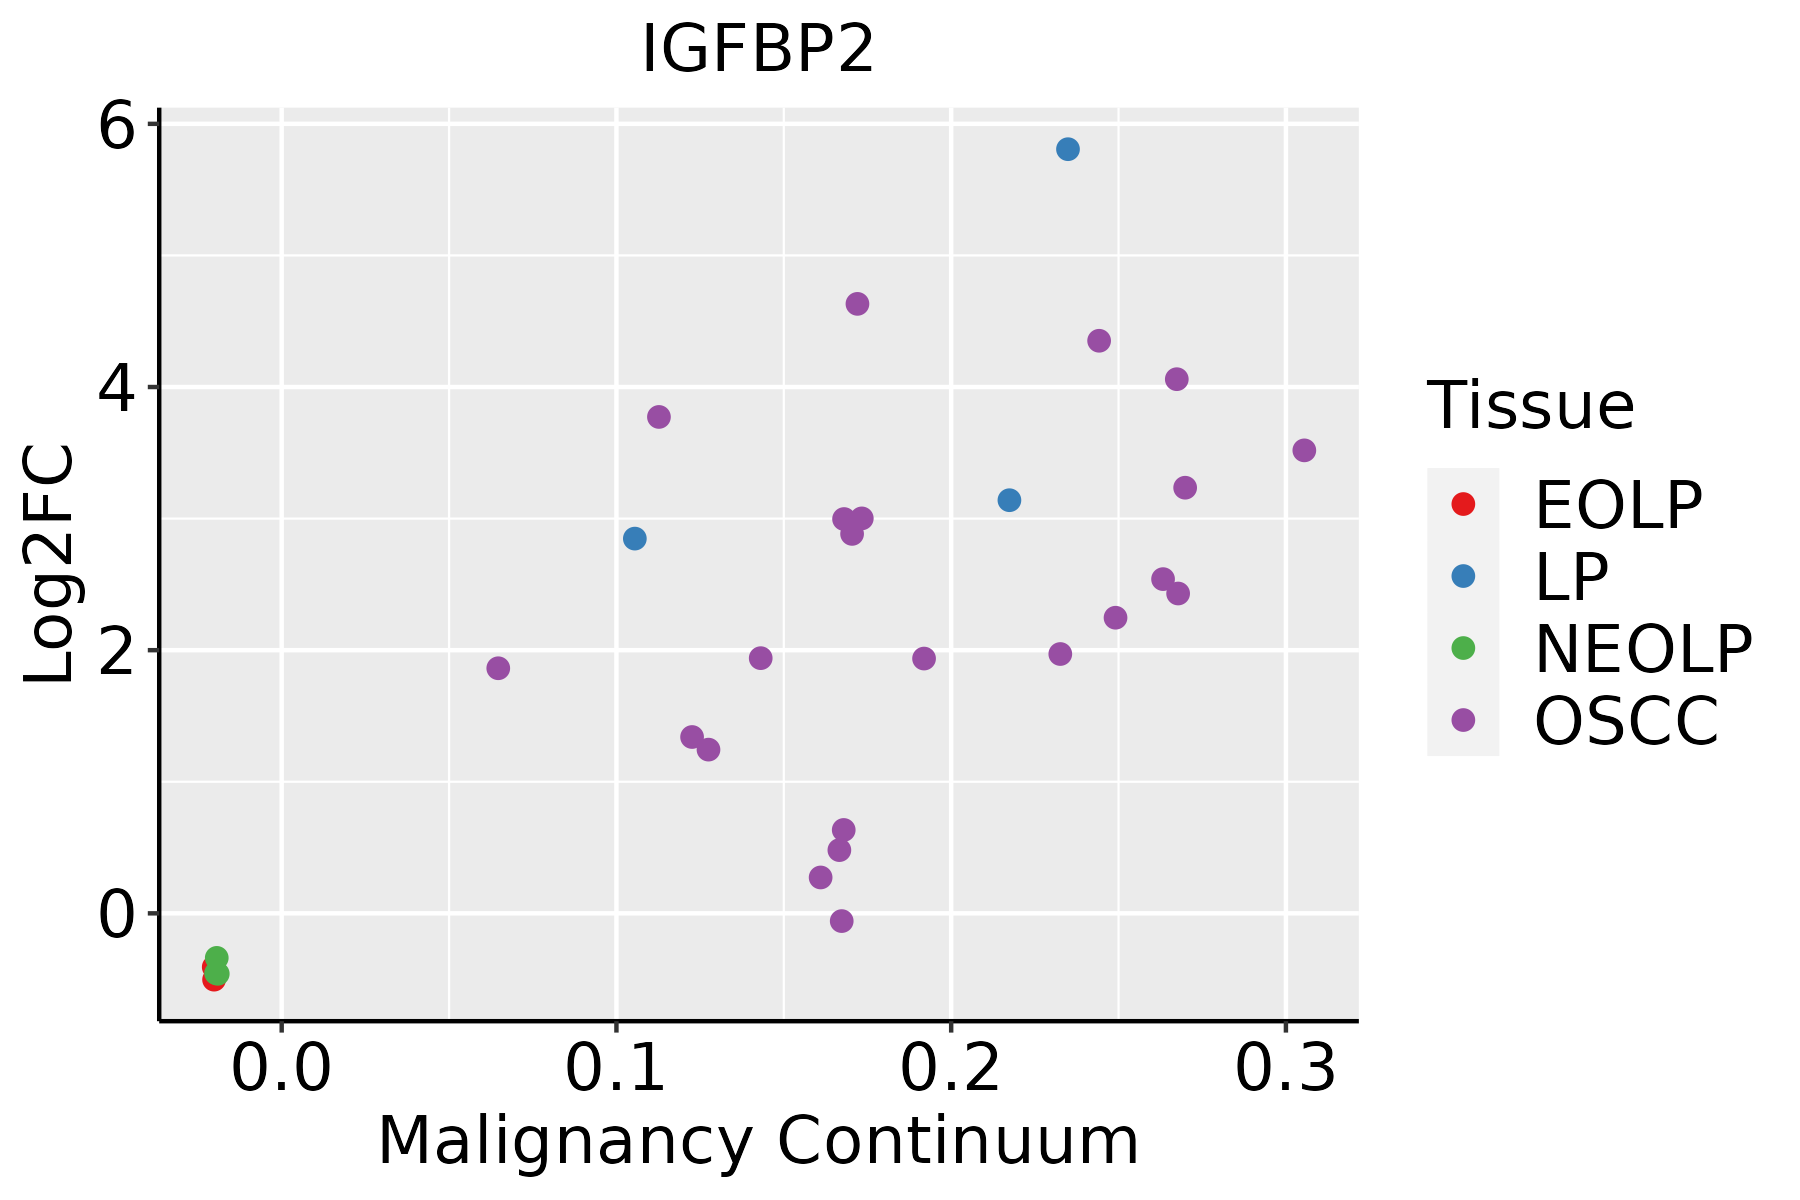 | EOLP: Erosive Oral lichen planus |
| LP: leukoplakia | ||
| NEOLP: Non-erosive oral lichen planus | ||
| OSCC: Oral squamous cell carcinoma | ||
| Prostate | 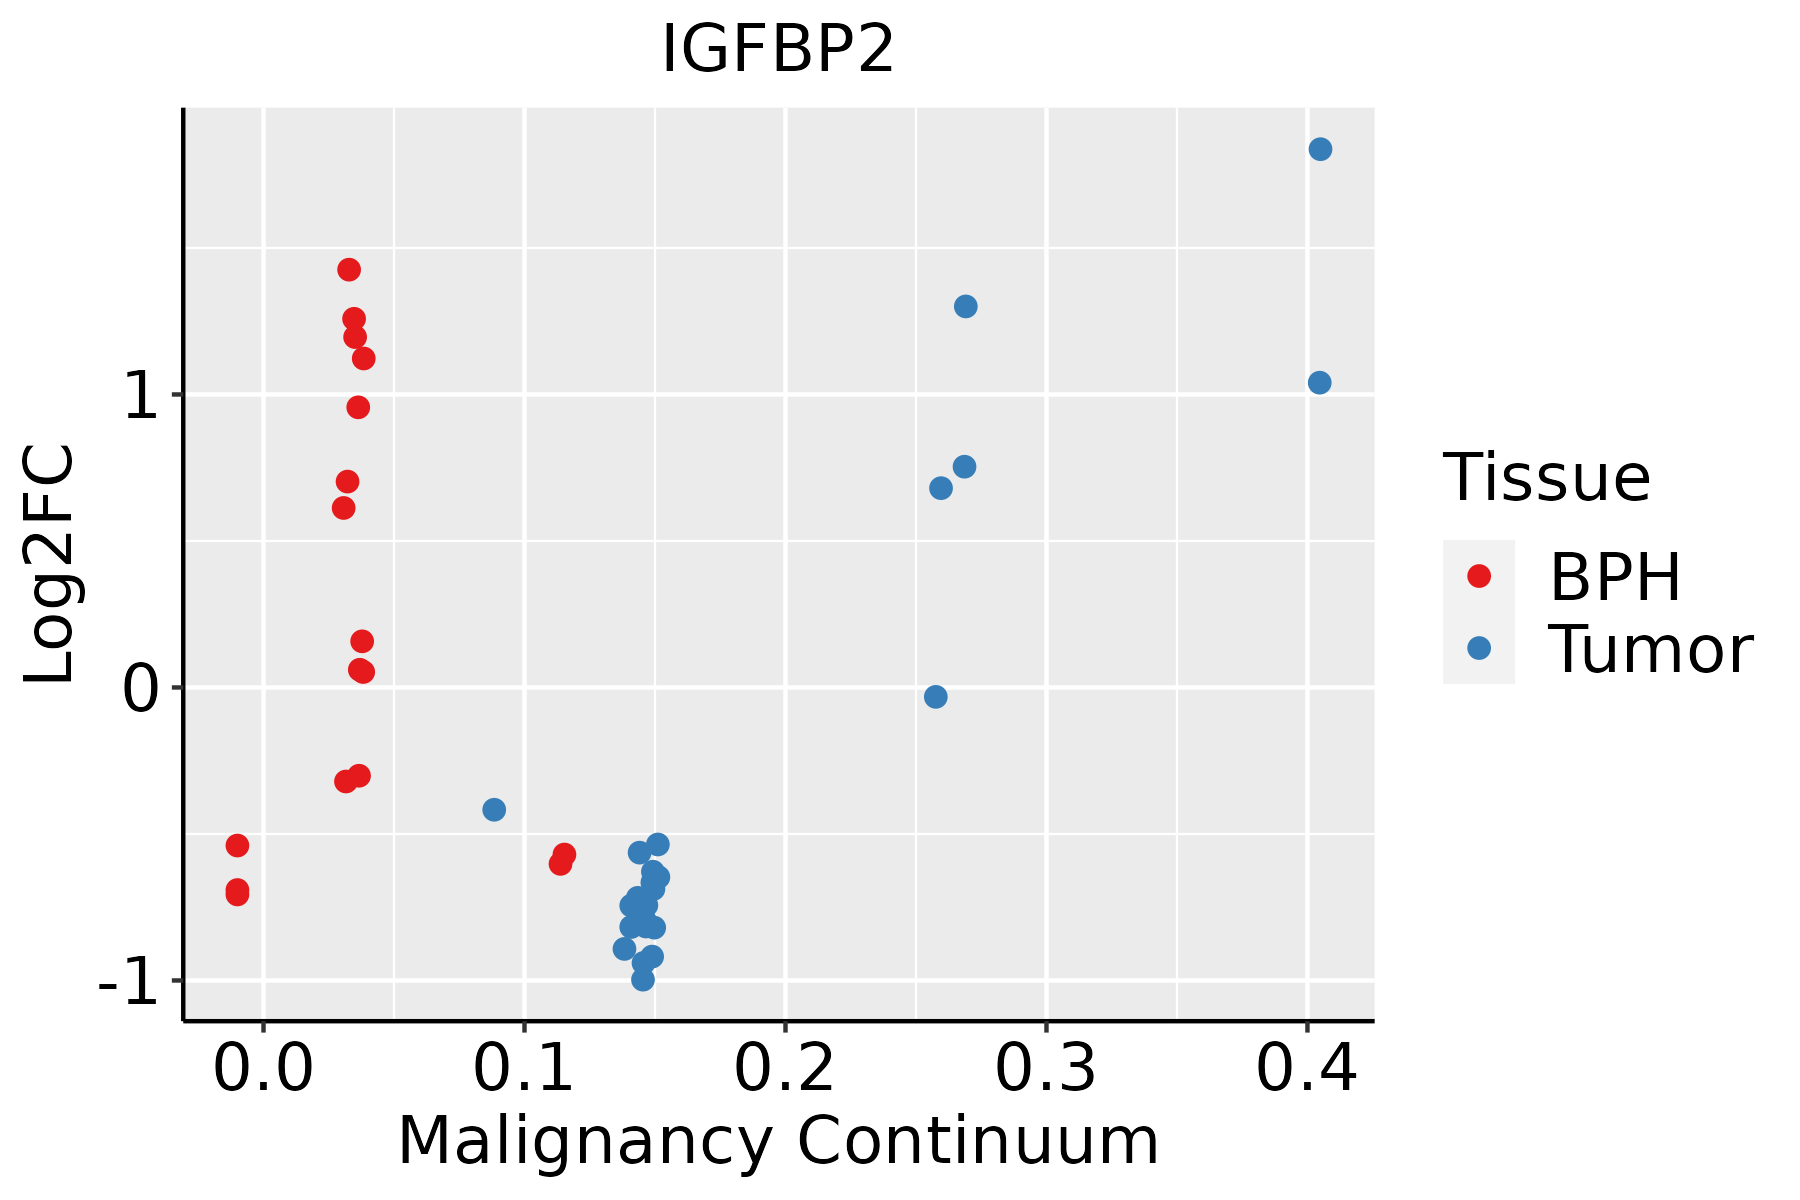 | BPH: Benign Prostatic Hyperplasia |
| Skin | 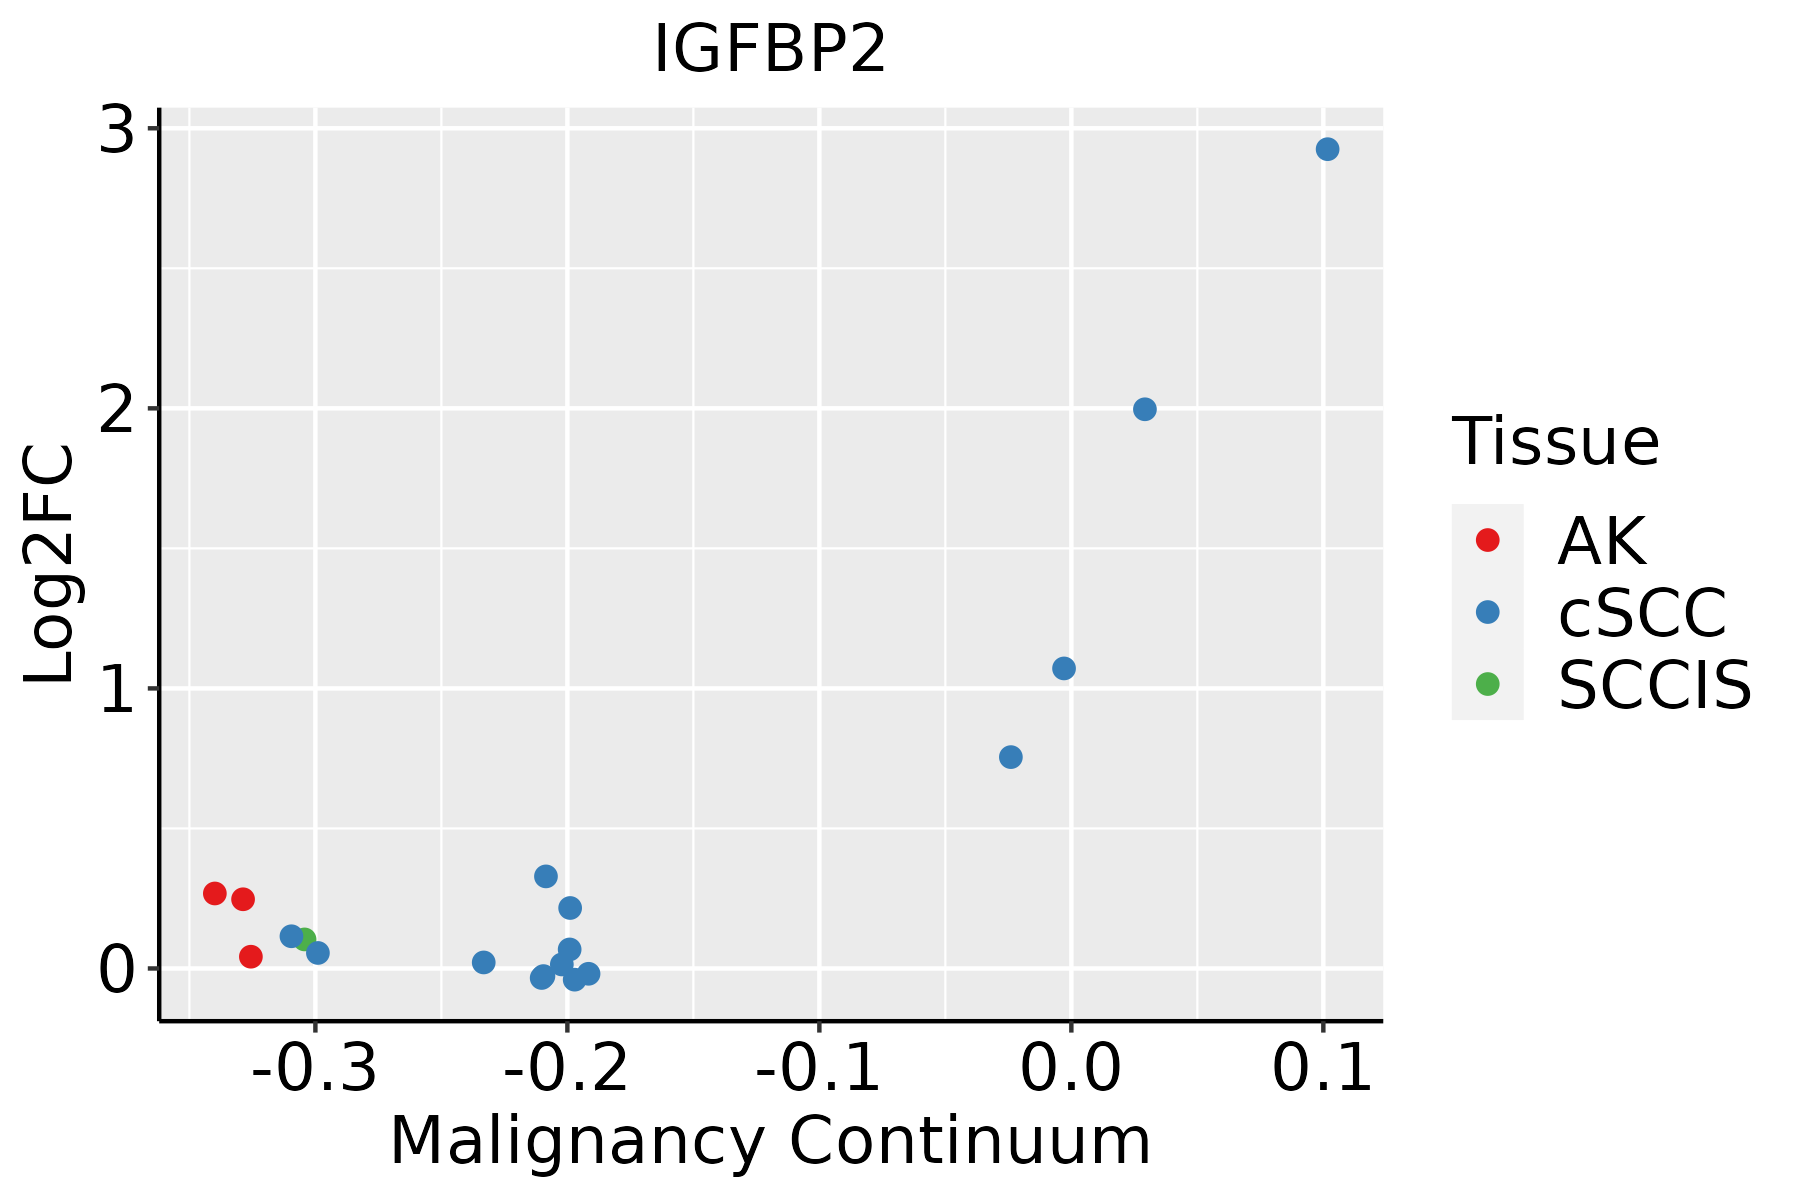 | AK: Actinic keratosis |
| cSCC: Cutaneous squamous cell carcinoma | ||
| SCCIS:squamous cell carcinoma in situ | ||
| Thyroid | 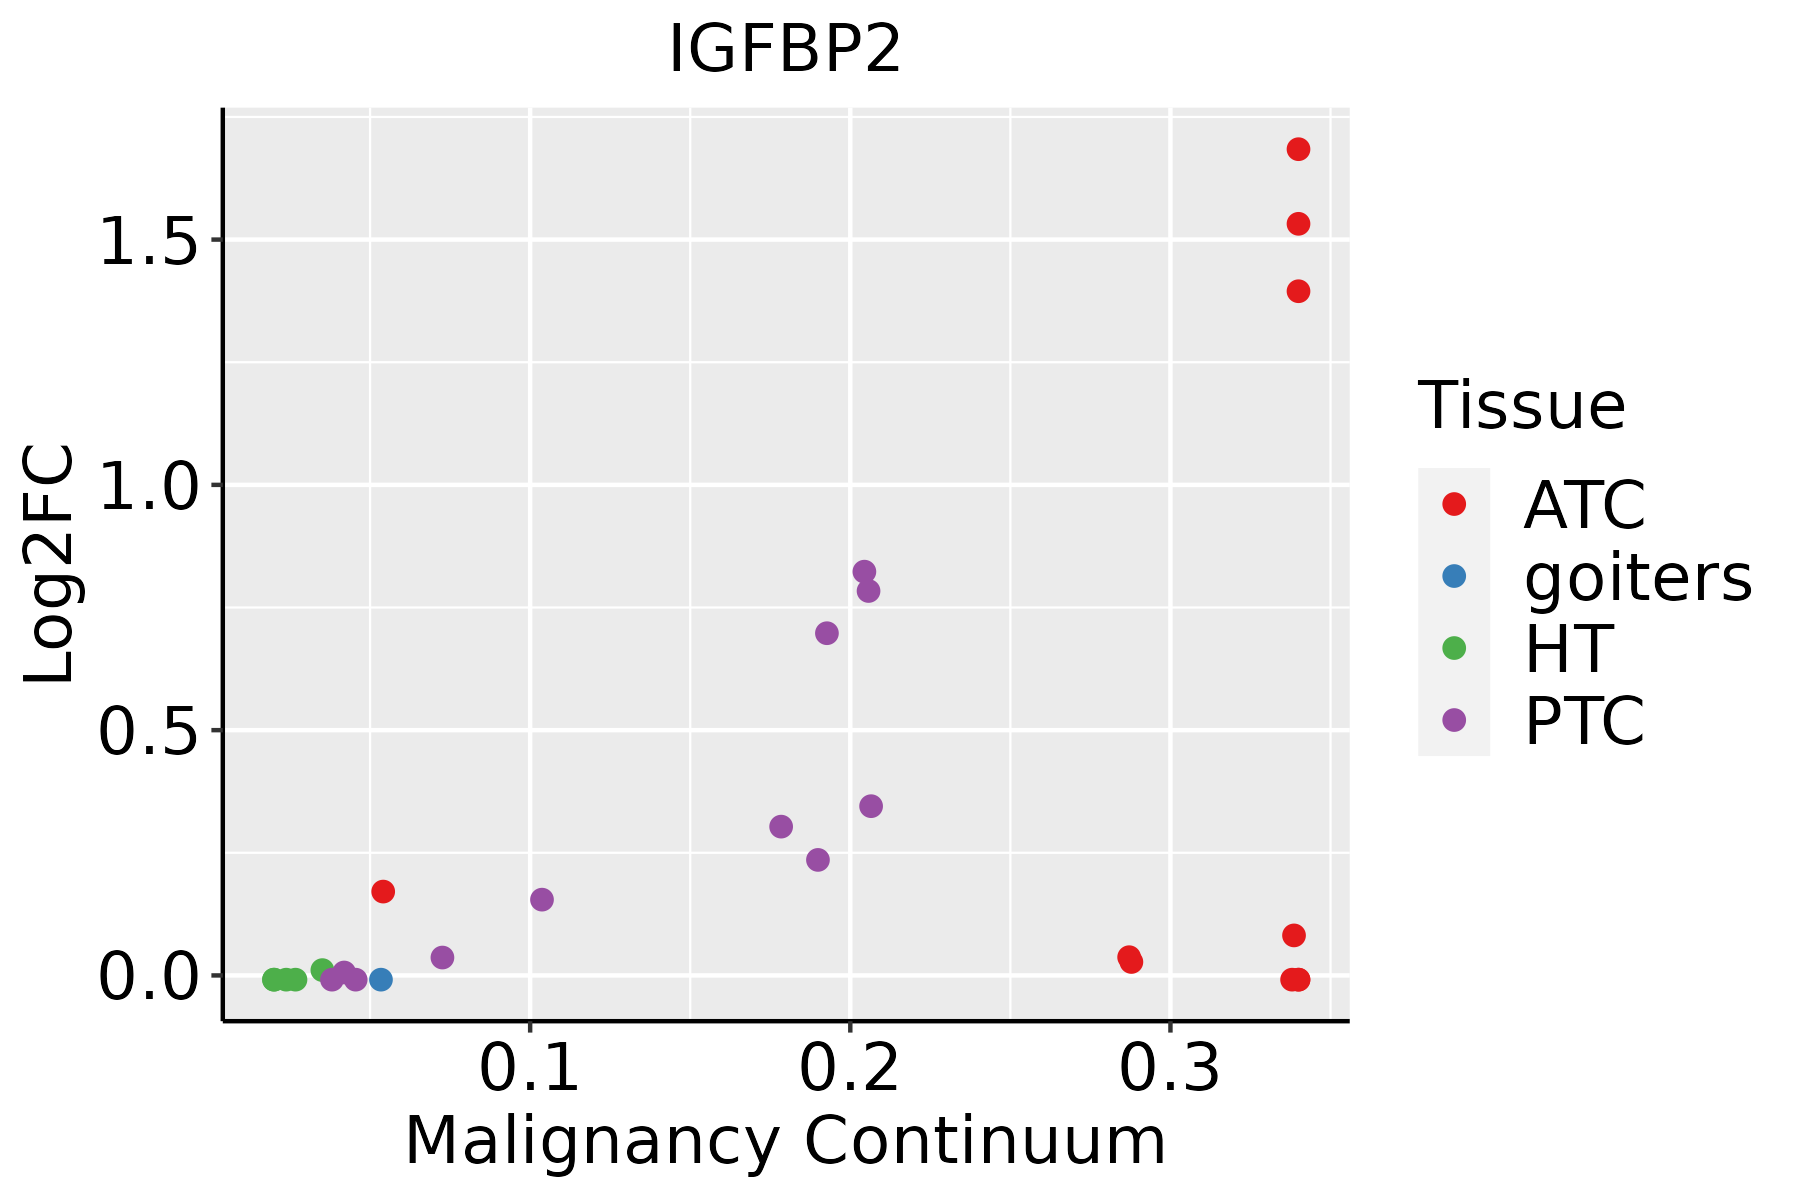 | ATC: Anaplastic thyroid cancer |
| HT: Hashimoto's thyroiditis | ||
| PTC: Papillary thyroid cancer |
| ∗log2FC in expression of this searched gene in stem-like cells from each diseased tissue sample relative to stem-like cells in normal samples in each tissue plotted against the malignancy continuum. Samples are colored based on if they are from different disease stage. |
Top |
Malignant transformation related pathway analysis |
| Find out the enriched GO biological processes and KEGG pathways involved in transition from healthy to precancer to cancer |
| Tissue | Disease Stage | Enriched GO biological Processes |
| Colorectum | AD |  |
| Colorectum | SER |  |
| Colorectum | MSS |  |
| Colorectum | MSI-H |  |
| Colorectum | FAP |  |
| ∗Top 15 enriched GO BP terms are showed in the bar plot of each disease state in each tissue. Each row represents a significant GO biological process which is colored according to the -log10(p.adjust). |
| Page: 1 2 3 4 5 6 7 8 9 |
| GO ID | Tissue | Disease Stage | Description | Gene Ratio | Bg Ratio | pvalue | p.adjust | Count |
| GO:00485459 | Breast | Precancer | response to steroid hormone | 53/1080 | 339/18723 | 3.07e-11 | 3.66e-09 | 53 |
| GO:00319608 | Breast | Precancer | response to corticosteroid | 30/1080 | 167/18723 | 2.50e-08 | 1.65e-06 | 30 |
| GO:00513848 | Breast | Precancer | response to glucocorticoid | 26/1080 | 148/18723 | 3.32e-07 | 1.57e-05 | 26 |
| GO:00100389 | Breast | Precancer | response to metal ion | 47/1080 | 373/18723 | 3.88e-07 | 1.79e-05 | 47 |
| GO:00457859 | Breast | Precancer | positive regulation of cell adhesion | 52/1080 | 437/18723 | 5.74e-07 | 2.49e-05 | 52 |
| GO:00075653 | Breast | Precancer | female pregnancy | 29/1080 | 193/18723 | 2.07e-06 | 7.31e-05 | 29 |
| GO:00447063 | Breast | Precancer | multi-multicellular organism process | 31/1080 | 220/18723 | 3.73e-06 | 1.19e-04 | 31 |
| GO:00075688 | Breast | Precancer | aging | 41/1080 | 339/18723 | 5.95e-06 | 1.71e-04 | 41 |
| GO:00421107 | Breast | Precancer | T cell activation | 52/1080 | 487/18723 | 1.37e-05 | 3.42e-04 | 52 |
| GO:00508707 | Breast | Precancer | positive regulation of T cell activation | 29/1080 | 216/18723 | 1.94e-05 | 4.58e-04 | 29 |
| GO:00436273 | Breast | Precancer | response to estrogen | 15/1080 | 75/18723 | 2.06e-05 | 4.83e-04 | 15 |
| GO:19030396 | Breast | Precancer | positive regulation of leukocyte cell-cell adhesion | 30/1080 | 239/18723 | 5.13e-05 | 1.07e-03 | 30 |
| GO:00508637 | Breast | Precancer | regulation of T cell activation | 37/1080 | 329/18723 | 8.04e-05 | 1.56e-03 | 37 |
| GO:00224098 | Breast | Precancer | positive regulation of cell-cell adhesion | 33/1080 | 284/18723 | 1.03e-04 | 1.89e-03 | 33 |
| GO:00071597 | Breast | Precancer | leukocyte cell-cell adhesion | 40/1080 | 371/18723 | 1.07e-04 | 1.94e-03 | 40 |
| GO:00316679 | Breast | Precancer | response to nutrient levels | 47/1080 | 474/18723 | 2.09e-04 | 3.27e-03 | 47 |
| GO:00224079 | Breast | Precancer | regulation of cell-cell adhesion | 45/1080 | 448/18723 | 2.12e-04 | 3.30e-03 | 45 |
| GO:19030377 | Breast | Precancer | regulation of leukocyte cell-cell adhesion | 36/1080 | 336/18723 | 2.61e-04 | 3.84e-03 | 36 |
| GO:00094108 | Breast | Precancer | response to xenobiotic stimulus | 45/1080 | 462/18723 | 4.17e-04 | 5.56e-03 | 45 |
| GO:00323555 | Breast | Precancer | response to estradiol | 19/1080 | 141/18723 | 4.81e-04 | 6.31e-03 | 19 |
| Page: 1 2 3 4 5 6 7 8 9 10 11 12 13 14 15 16 17 18 19 20 21 22 23 24 25 26 27 28 29 30 31 32 33 34 35 36 37 |
| Pathway ID | Tissue | Disease Stage | Description | Gene Ratio | Bg Ratio | pvalue | p.adjust | qvalue | Count |
| Page: 1 |
Top |
Cell-cell communication analysis |
| Identification of potential cell-cell interactions between two cell types and their ligand-receptor pairs for different disease states |
| Ligand | Receptor | LRpair | Pathway | Tissue | Disease Stage |
| Page: 1 |
Top |
Single-cell gene regulatory network inference analysis |
| Find out the significant the regulons (TFs) and the target genes of each regulon across cell types for different disease states |
| TF | Cell Type | Tissue | Disease Stage | Target Gene | RSS | Regulon Activity |
| ∗The dot plots of a searched regulon are shown for all cell subpopulations in each disease state of each tissue based on the regulon specific score inferred using pySCENIC and by calculating the average expression. |
| Page: 1 |
Top |
Somatic mutation of malignant transformation related genes |
| Annotation of somatic variants for genes involved in malignant transformation |
| Hugo Symbol | Variant Class | Variant Classification | dbSNP RS | HGVSc | HGVSp | HGVSp Short | SWISSPROT | BIOTYPE | SIFT | PolyPhen | Tumor Sample Barcode | Tissue | Histology | Sex | Age | Stage | Therapy Types | Drugs | Outcome |
| IGFBP2 | SNV | Missense_Mutation | c.871N>A | p.Gly291Arg | p.G291R | P18065 | protein_coding | deleterious(0) | probably_damaging(1) | TCGA-AA-3664-01 | Colorectum | colon adenocarcinoma | Female | >=65 | I/II | Unknown | Unknown | SD | |
| IGFBP2 | SNV | Missense_Mutation | c.751G>A | p.Glu251Lys | p.E251K | P18065 | protein_coding | deleterious(0) | possibly_damaging(0.845) | TCGA-AD-A5EJ-01 | Colorectum | colon adenocarcinoma | Female | >=65 | I/II | Unknown | Unknown | SD | |
| IGFBP2 | SNV | Missense_Mutation | c.797N>C | p.Leu266Pro | p.L266P | P18065 | protein_coding | tolerated(0.07) | probably_damaging(0.927) | TCGA-D5-6540-01 | Colorectum | colon adenocarcinoma | Male | >=65 | I/II | Unknown | Unknown | SD | |
| IGFBP2 | SNV | Missense_Mutation | c.961N>G | p.Thr321Ala | p.T321A | P18065 | protein_coding | tolerated_low_confidence(0.56) | benign(0) | TCGA-D5-6928-01 | Colorectum | colon adenocarcinoma | Male | >=65 | I/II | Unknown | Unknown | SD | |
| IGFBP2 | SNV | Missense_Mutation | novel | c.530N>A | p.Gly177Asp | p.G177D | P18065 | protein_coding | tolerated(0.33) | benign(0.07) | TCGA-AP-A1DK-01 | Endometrium | uterine corpus endometrioid carcinoma | Female | <65 | I/II | Unknown | Unknown | SD |
| IGFBP2 | SNV | Missense_Mutation | c.577N>A | p.Glu193Lys | p.E193K | P18065 | protein_coding | tolerated(0.06) | possibly_damaging(0.604) | TCGA-AX-A0J0-01 | Endometrium | uterine corpus endometrioid carcinoma | Female | <65 | I/II | Unknown | Unknown | SD | |
| IGFBP2 | SNV | Missense_Mutation | novel | c.463G>A | p.Glu155Lys | p.E155K | P18065 | protein_coding | tolerated(0.05) | benign(0.294) | TCGA-B5-A1MR-01 | Endometrium | uterine corpus endometrioid carcinoma | Female | >=65 | III/IV | Unknown | Unknown | SD |
| IGFBP2 | SNV | Missense_Mutation | novel | c.500N>C | p.Met167Thr | p.M167T | P18065 | protein_coding | tolerated(0.77) | benign(0) | TCGA-B5-A3FA-01 | Endometrium | uterine corpus endometrioid carcinoma | Female | >=65 | I/II | Unknown | Unknown | SD |
| IGFBP2 | SNV | Missense_Mutation | c.838N>T | p.Arg280Cys | p.R280C | P18065 | protein_coding | deleterious(0) | probably_damaging(1) | TCGA-BS-A0UA-01 | Endometrium | uterine corpus endometrioid carcinoma | Female | >=65 | I/II | Unknown | Unknown | PD | |
| IGFBP2 | SNV | Missense_Mutation | rs774149508 | c.725N>A | p.Arg242His | p.R242H | P18065 | protein_coding | tolerated(0.06) | benign(0.029) | TCGA-D1-A103-01 | Endometrium | uterine corpus endometrioid carcinoma | Female | >=65 | I/II | Unknown | Unknown | SD |
| Page: 1 2 3 |
Top |
Related drugs of malignant transformation related genes |
| Identification of chemicals and drugs interact with genes involved in malignant transfromation |
| (DGIdb 4.0) |
| Entrez ID | Symbol | Category | Interaction Types | Drug Claim Name | Drug Name | PMIDs |
| Page: 1 |

Copyright 2023-Present -The University of Texas Health Science Center at Houston |