
|
|||||
|
 | |
| |
| |
| |
| |
| |
|
Gene: IGF2R |
Gene summary for IGF2R |
| Gene information | Species | Human | Gene symbol | IGF2R | Gene ID | 3482 |
| Gene name | insulin like growth factor 2 receptor | |
| Gene Alias | CD222 | |
| Cytomap | 6q25.3 | |
| Gene Type | protein-coding | GO ID | GO:0000003 | UniProtAcc | P11717 |
Top |
Malignant transformation analysis |
| Identification of the aberrant gene expression in precancerous and cancerous lesions by comparing the gene expression of stem-like cells in diseased tissues with normal stem cells |
| Entrez ID | Symbol | Replicates | Species | Organ | Tissue | Adj P-value | Log2FC | Malignancy |
| 3482 | IGF2R | HTA11_2487_2000001011 | Human | Colorectum | SER | 1.53e-19 | 1.30e+00 | -0.1808 |
| 3482 | IGF2R | HTA11_2951_2000001011 | Human | Colorectum | AD | 2.55e-25 | 1.66e+00 | 0.0216 |
| 3482 | IGF2R | HTA11_1938_2000001011 | Human | Colorectum | AD | 2.73e-18 | 1.02e+00 | -0.0811 |
| 3482 | IGF2R | HTA11_78_2000001011 | Human | Colorectum | AD | 3.22e-07 | 5.96e-01 | -0.1088 |
| 3482 | IGF2R | HTA11_347_2000001011 | Human | Colorectum | AD | 1.30e-27 | 9.29e-01 | -0.1954 |
| 3482 | IGF2R | HTA11_411_2000001011 | Human | Colorectum | SER | 9.60e-07 | 1.00e+00 | -0.2602 |
| 3482 | IGF2R | HTA11_2112_2000001011 | Human | Colorectum | SER | 3.53e-04 | 8.33e-01 | -0.2196 |
| 3482 | IGF2R | HTA11_3361_2000001011 | Human | Colorectum | AD | 6.34e-50 | 2.23e+00 | -0.1207 |
| 3482 | IGF2R | HTA11_83_2000001011 | Human | Colorectum | SER | 1.33e-11 | 8.41e-01 | -0.1526 |
| 3482 | IGF2R | HTA11_696_2000001011 | Human | Colorectum | AD | 2.18e-26 | 1.08e+00 | -0.1464 |
| 3482 | IGF2R | HTA11_866_2000001011 | Human | Colorectum | AD | 1.27e-42 | 1.11e+00 | -0.1001 |
| 3482 | IGF2R | HTA11_1391_2000001011 | Human | Colorectum | AD | 3.08e-24 | 1.17e+00 | -0.059 |
| 3482 | IGF2R | HTA11_546_2000001011 | Human | Colorectum | AD | 3.55e-06 | 7.34e-01 | -0.0842 |
| 3482 | IGF2R | HTA11_8622_2000001021 | Human | Colorectum | SER | 4.41e-36 | 1.94e+00 | 0.0528 |
| 3482 | IGF2R | HTA11_7663_2000001011 | Human | Colorectum | SER | 1.46e-06 | 9.21e-01 | 0.0131 |
| 3482 | IGF2R | HTA11_6818_2000001011 | Human | Colorectum | AD | 6.20e-24 | 1.31e+00 | 0.0112 |
| 3482 | IGF2R | HTA11_6818_2000001021 | Human | Colorectum | AD | 2.32e-14 | 9.11e-01 | 0.0588 |
| 3482 | IGF2R | HTA11_99999970781_79442 | Human | Colorectum | MSS | 7.44e-03 | 5.04e-01 | 0.294 |
| 3482 | IGF2R | HTA11_99999965062_69753 | Human | Colorectum | MSI-H | 8.50e-19 | 1.93e+00 | 0.3487 |
| 3482 | IGF2R | HTA11_99999965104_69814 | Human | Colorectum | MSS | 1.23e-02 | 5.33e-01 | 0.281 |
| Page: 1 2 3 4 5 6 7 8 9 10 |
| Tissue | Expression Dynamics | Abbreviation |
| Colorectum (GSE201348) |  | FAP: Familial adenomatous polyposis |
| CRC: Colorectal cancer | ||
| Colorectum (HTA11) |  | AD: Adenomas |
| SER: Sessile serrated lesions | ||
| MSI-H: Microsatellite-high colorectal cancer | ||
| MSS: Microsatellite stable colorectal cancer | ||
| Endometrium | 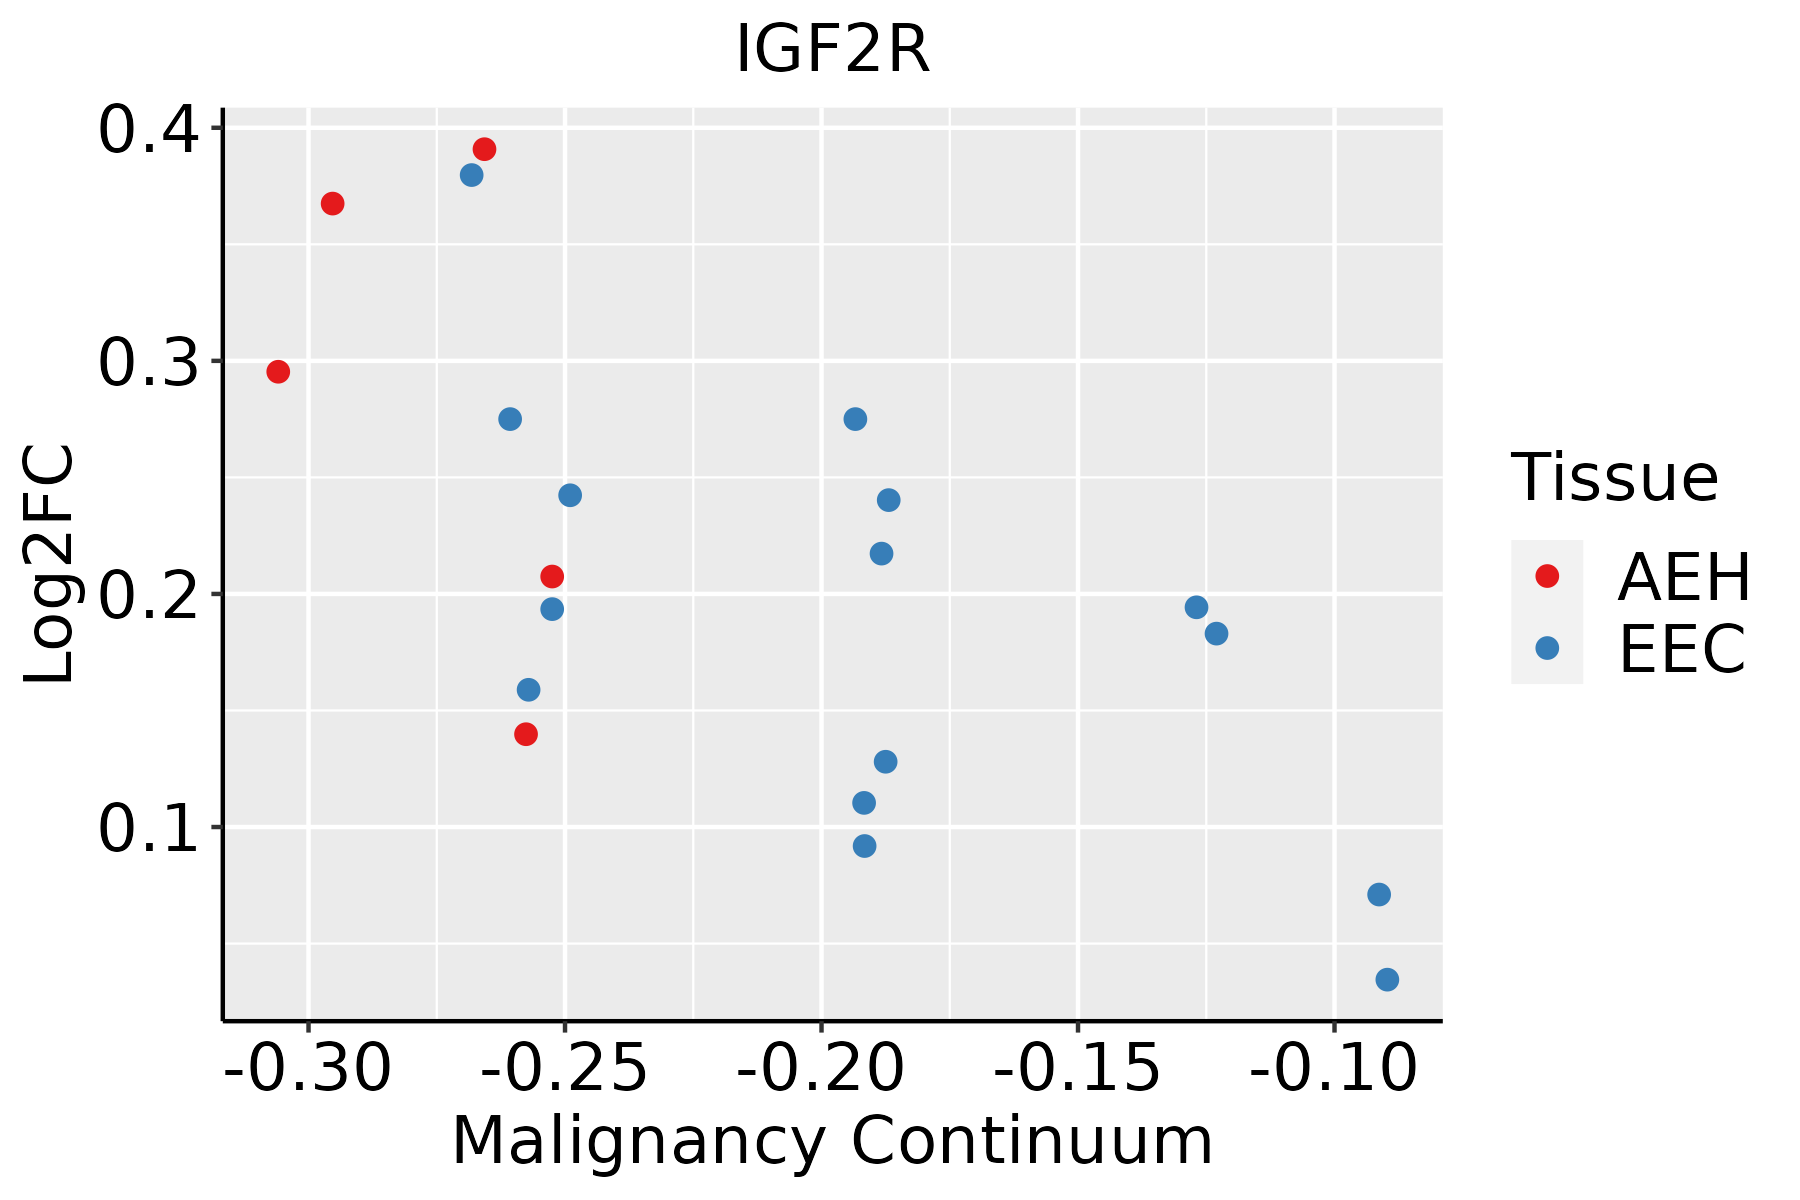 | AEH: Atypical endometrial hyperplasia |
| EEC: Endometrioid Cancer | ||
| Esophagus |  | ESCC: Esophageal squamous cell carcinoma |
| HGIN: High-grade intraepithelial neoplasias | ||
| LGIN: Low-grade intraepithelial neoplasias | ||
| Liver |  | HCC: Hepatocellular carcinoma |
| NAFLD: Non-alcoholic fatty liver disease | ||
| Oral Cavity | 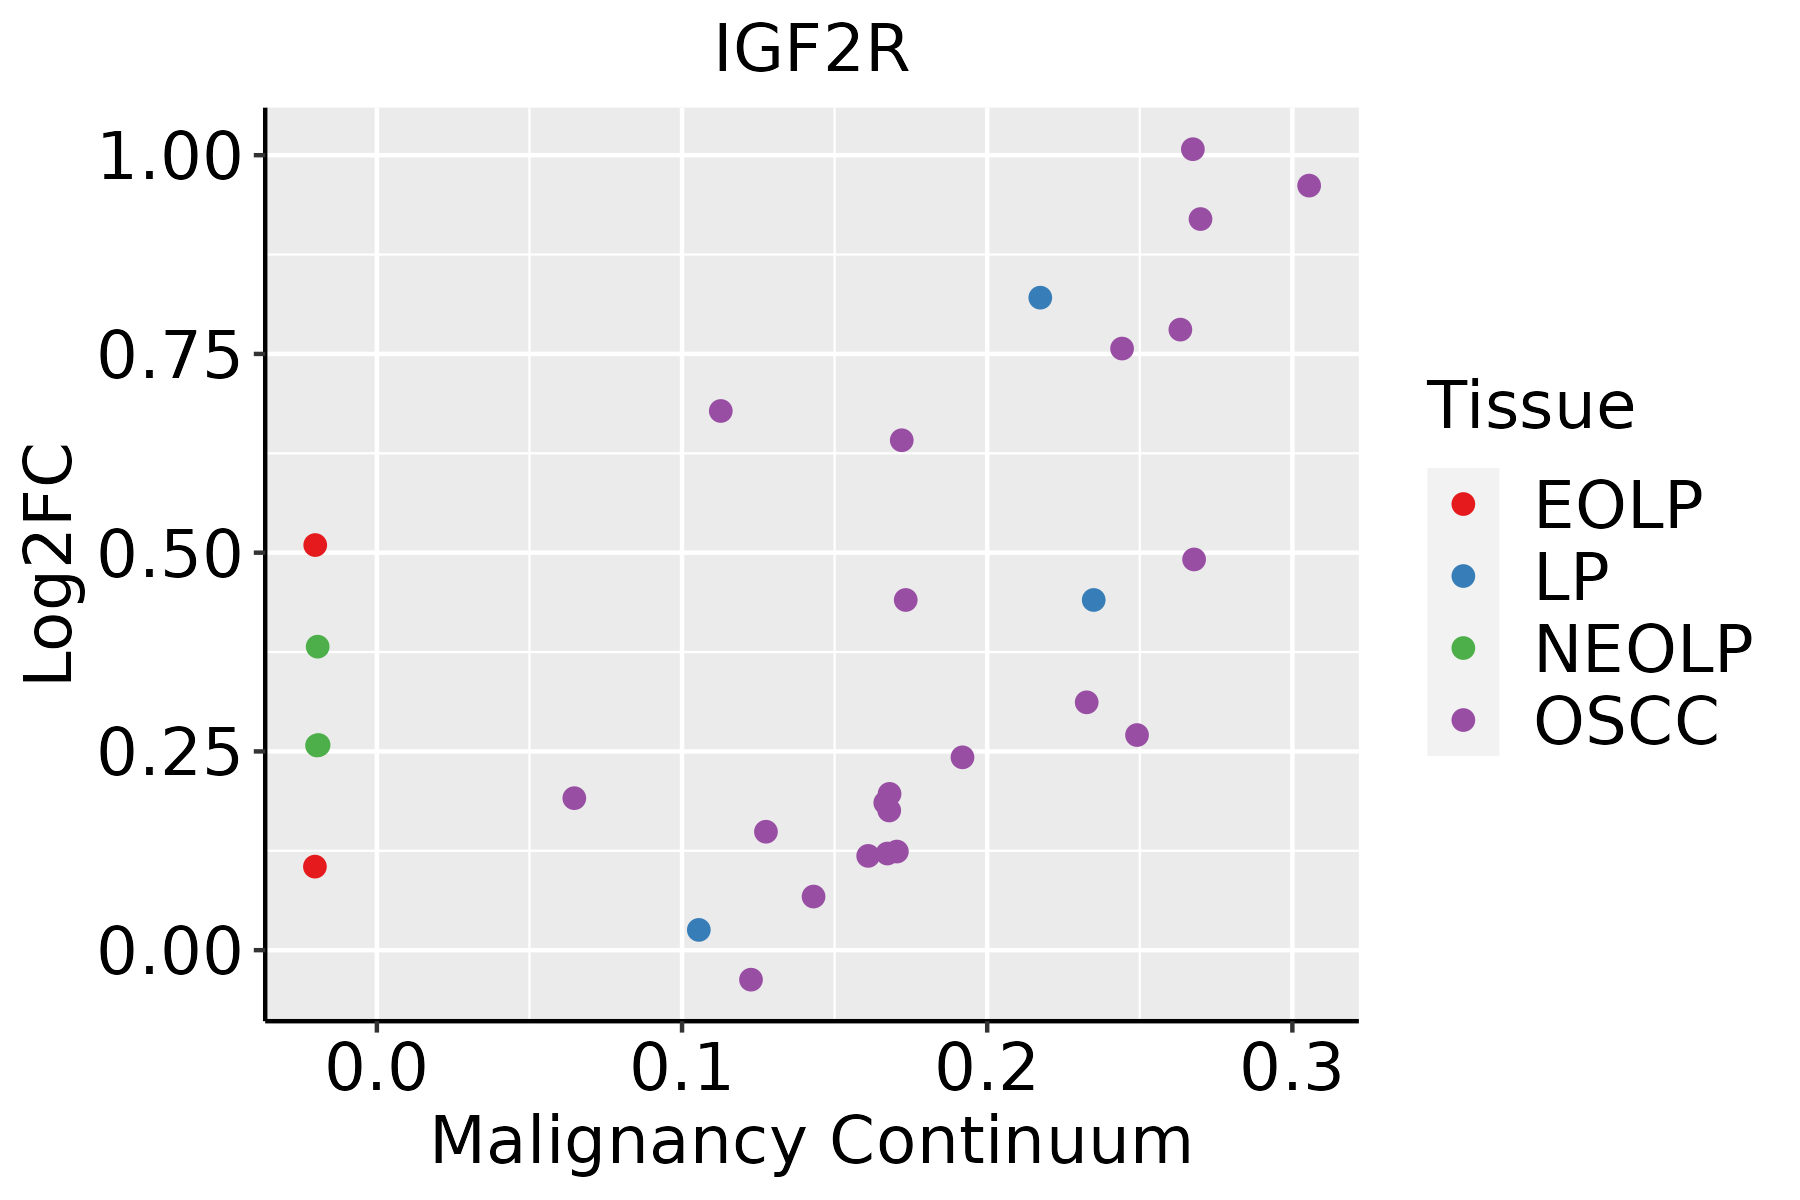 | EOLP: Erosive Oral lichen planus |
| LP: leukoplakia | ||
| NEOLP: Non-erosive oral lichen planus | ||
| OSCC: Oral squamous cell carcinoma | ||
| Prostate | 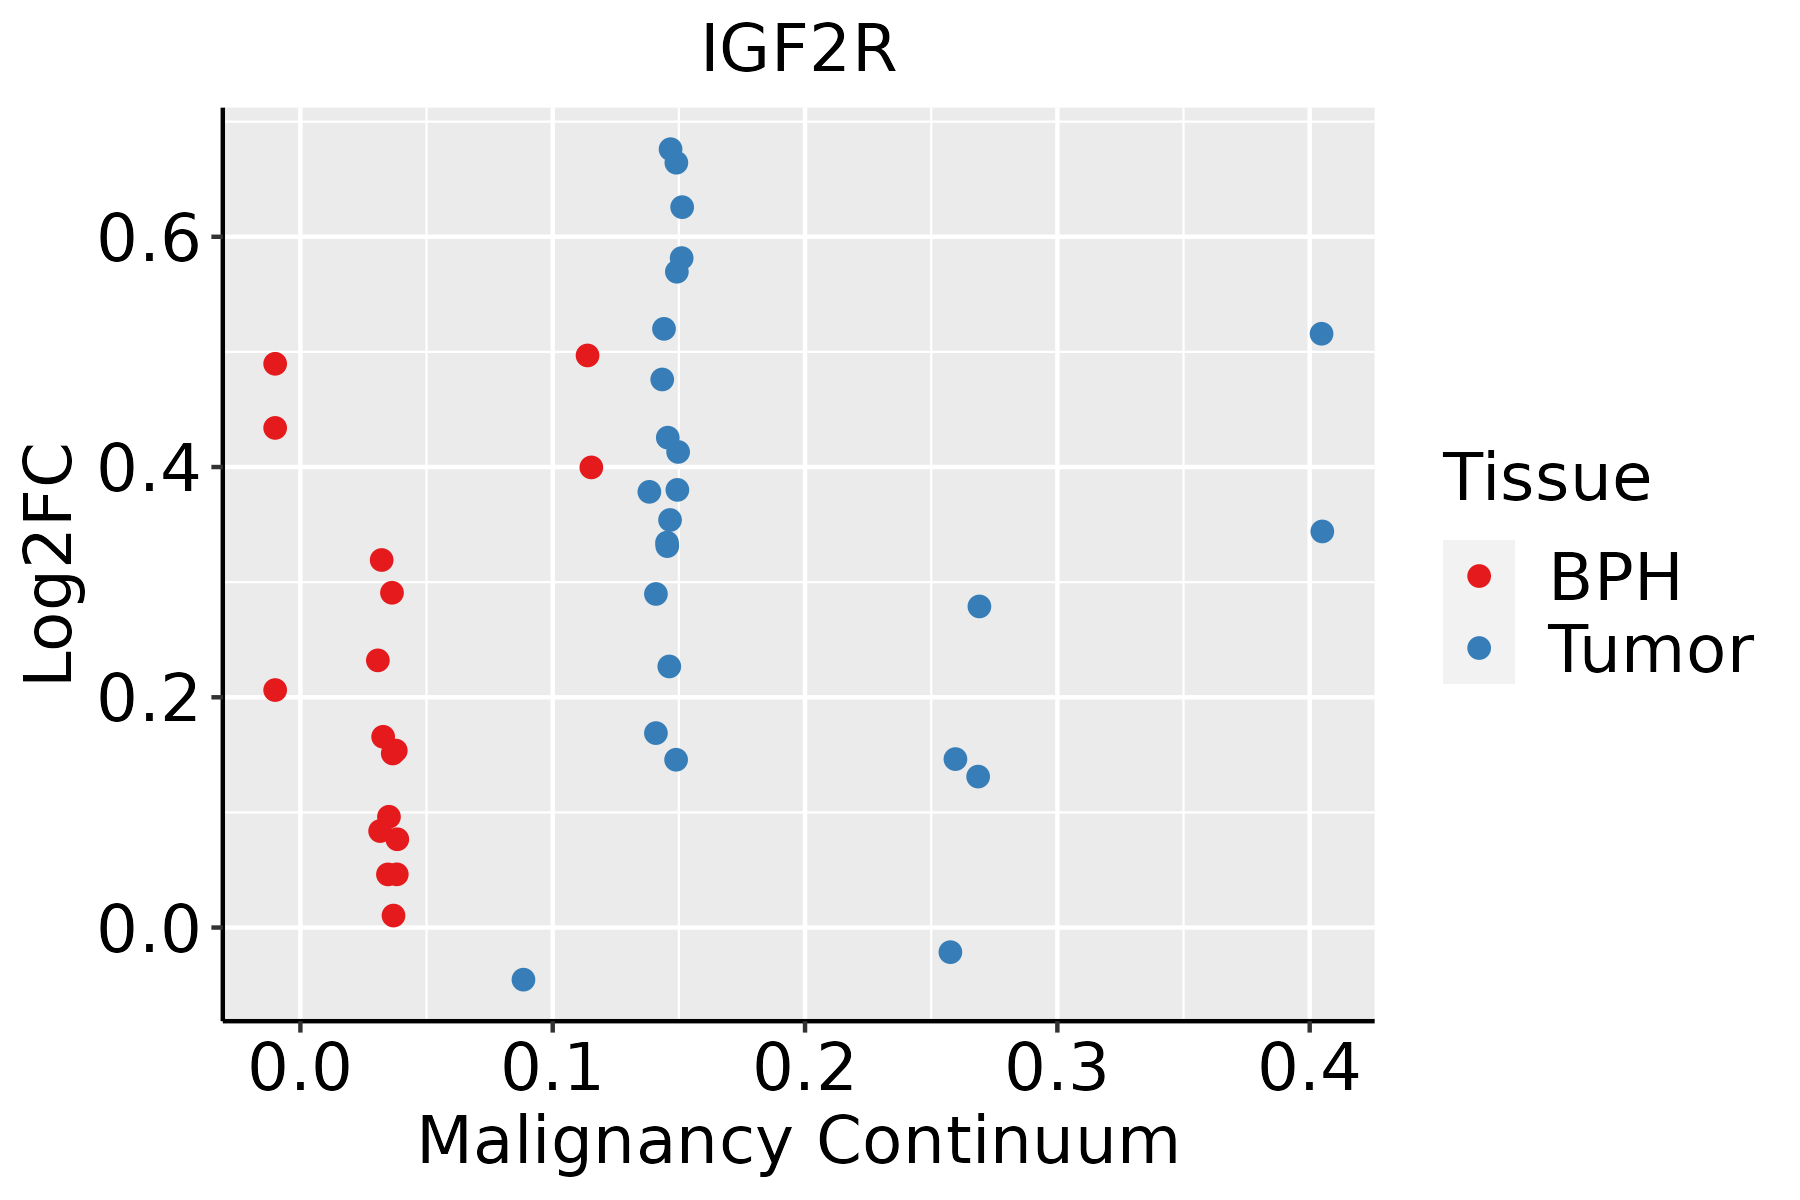 | BPH: Benign Prostatic Hyperplasia |
| Skin |  | AK: Actinic keratosis |
| cSCC: Cutaneous squamous cell carcinoma | ||
| SCCIS:squamous cell carcinoma in situ | ||
| Thyroid |  | ATC: Anaplastic thyroid cancer |
| HT: Hashimoto's thyroiditis | ||
| PTC: Papillary thyroid cancer |
| ∗log2FC in expression of this searched gene in stem-like cells from each diseased tissue sample relative to stem-like cells in normal samples in each tissue plotted against the malignancy continuum. Samples are colored based on if they are from different disease stage. |
Top |
Malignant transformation related pathway analysis |
| Find out the enriched GO biological processes and KEGG pathways involved in transition from healthy to precancer to cancer |
| Tissue | Disease Stage | Enriched GO biological Processes |
| Colorectum | AD |  |
| Colorectum | SER |  |
| Colorectum | MSS |  |
| Colorectum | MSI-H |  |
| Colorectum | FAP |  |
| ∗Top 15 enriched GO BP terms are showed in the bar plot of each disease state in each tissue. Each row represents a significant GO biological process which is colored according to the -log10(p.adjust). |
| Page: 1 2 3 4 5 6 7 8 9 |
| GO ID | Tissue | Disease Stage | Description | Gene Ratio | Bg Ratio | pvalue | p.adjust | Count |
| GO:0016032 | Colorectum | AD | viral process | 168/3918 | 415/18723 | 4.67e-20 | 3.66e-17 | 168 |
| GO:0048732 | Colorectum | AD | gland development | 149/3918 | 436/18723 | 6.07e-11 | 6.33e-09 | 149 |
| GO:0044403 | Colorectum | AD | biological process involved in symbiotic interaction | 99/3918 | 290/18723 | 1.02e-07 | 4.93e-06 | 99 |
| GO:0007034 | Colorectum | AD | vacuolar transport | 60/3918 | 157/18723 | 4.97e-07 | 1.85e-05 | 60 |
| GO:0061008 | Colorectum | AD | hepaticobiliary system development | 55/3918 | 150/18723 | 6.34e-06 | 1.59e-04 | 55 |
| GO:0001889 | Colorectum | AD | liver development | 54/3918 | 147/18723 | 7.20e-06 | 1.77e-04 | 54 |
| GO:0007041 | Colorectum | AD | lysosomal transport | 42/3918 | 114/18723 | 6.61e-05 | 1.07e-03 | 42 |
| GO:0006898 | Colorectum | AD | receptor-mediated endocytosis | 76/3918 | 244/18723 | 1.07e-04 | 1.59e-03 | 76 |
| GO:0009791 | Colorectum | AD | post-embryonic development | 29/3918 | 80/18723 | 1.13e-03 | 1.03e-02 | 29 |
| GO:0035821 | Colorectum | AD | modulation of process of other organism | 34/3918 | 106/18723 | 4.73e-03 | 3.22e-02 | 34 |
| GO:0031100 | Colorectum | AD | animal organ regeneration | 26/3918 | 76/18723 | 4.94e-03 | 3.32e-02 | 26 |
| GO:00160321 | Colorectum | SER | viral process | 118/2897 | 415/18723 | 8.36e-12 | 1.65e-09 | 118 |
| GO:00487321 | Colorectum | SER | gland development | 112/2897 | 436/18723 | 1.75e-08 | 1.28e-06 | 112 |
| GO:00610081 | Colorectum | SER | hepaticobiliary system development | 45/2897 | 150/18723 | 4.98e-06 | 1.85e-04 | 45 |
| GO:00018891 | Colorectum | SER | liver development | 44/2897 | 147/18723 | 6.73e-06 | 2.35e-04 | 44 |
| GO:00444031 | Colorectum | SER | biological process involved in symbiotic interaction | 72/2897 | 290/18723 | 2.08e-05 | 6.02e-04 | 72 |
| GO:00070341 | Colorectum | SER | vacuolar transport | 43/2897 | 157/18723 | 8.92e-05 | 1.93e-03 | 43 |
| GO:0048009 | Colorectum | SER | insulin-like growth factor receptor signaling pathway | 14/2897 | 37/18723 | 7.80e-04 | 9.87e-03 | 14 |
| GO:00097911 | Colorectum | SER | post-embryonic development | 22/2897 | 80/18723 | 4.12e-03 | 3.36e-02 | 22 |
| GO:00160322 | Colorectum | MSS | viral process | 157/3467 | 415/18723 | 7.94e-21 | 6.19e-18 | 157 |
| Page: 1 2 3 4 5 6 7 8 9 10 11 12 13 14 15 16 |
| Pathway ID | Tissue | Disease Stage | Description | Gene Ratio | Bg Ratio | pvalue | p.adjust | qvalue | Count |
| hsa04144 | Colorectum | AD | Endocytosis | 111/2092 | 251/8465 | 5.95e-12 | 1.42e-10 | 9.08e-11 | 111 |
| hsa041441 | Colorectum | AD | Endocytosis | 111/2092 | 251/8465 | 5.95e-12 | 1.42e-10 | 9.08e-11 | 111 |
| hsa041442 | Colorectum | SER | Endocytosis | 81/1580 | 251/8465 | 1.14e-07 | 2.36e-06 | 1.71e-06 | 81 |
| hsa04142 | Colorectum | SER | Lysosome | 38/1580 | 132/8465 | 2.87e-03 | 2.03e-02 | 1.47e-02 | 38 |
| hsa041443 | Colorectum | SER | Endocytosis | 81/1580 | 251/8465 | 1.14e-07 | 2.36e-06 | 1.71e-06 | 81 |
| hsa041421 | Colorectum | SER | Lysosome | 38/1580 | 132/8465 | 2.87e-03 | 2.03e-02 | 1.47e-02 | 38 |
| hsa041444 | Colorectum | MSS | Endocytosis | 102/1875 | 251/8465 | 1.85e-11 | 4.43e-10 | 2.71e-10 | 102 |
| hsa041445 | Colorectum | MSS | Endocytosis | 102/1875 | 251/8465 | 1.85e-11 | 4.43e-10 | 2.71e-10 | 102 |
| hsa041446 | Colorectum | FAP | Endocytosis | 78/1404 | 251/8465 | 6.20e-09 | 2.96e-07 | 1.80e-07 | 78 |
| hsa041447 | Colorectum | FAP | Endocytosis | 78/1404 | 251/8465 | 6.20e-09 | 2.96e-07 | 1.80e-07 | 78 |
| hsa041448 | Colorectum | CRC | Endocytosis | 65/1091 | 251/8465 | 1.27e-08 | 1.06e-06 | 7.19e-07 | 65 |
| hsa041449 | Colorectum | CRC | Endocytosis | 65/1091 | 251/8465 | 1.27e-08 | 1.06e-06 | 7.19e-07 | 65 |
| hsa0414420 | Endometrium | AEH | Endocytosis | 56/1197 | 251/8465 | 2.58e-04 | 2.15e-03 | 1.57e-03 | 56 |
| hsa04144110 | Endometrium | AEH | Endocytosis | 56/1197 | 251/8465 | 2.58e-04 | 2.15e-03 | 1.57e-03 | 56 |
| hsa0414424 | Endometrium | EEC | Endocytosis | 57/1237 | 251/8465 | 3.34e-04 | 2.82e-03 | 2.10e-03 | 57 |
| hsa0414434 | Endometrium | EEC | Endocytosis | 57/1237 | 251/8465 | 3.34e-04 | 2.82e-03 | 2.10e-03 | 57 |
| hsa04144210 | Esophagus | ESCC | Endocytosis | 186/4205 | 251/8465 | 9.74e-16 | 4.66e-14 | 2.39e-14 | 186 |
| hsa0414222 | Esophagus | ESCC | Lysosome | 102/4205 | 132/8465 | 5.11e-11 | 7.13e-10 | 3.65e-10 | 102 |
| hsa0414437 | Esophagus | ESCC | Endocytosis | 186/4205 | 251/8465 | 9.74e-16 | 4.66e-14 | 2.39e-14 | 186 |
| hsa0414232 | Esophagus | ESCC | Lysosome | 102/4205 | 132/8465 | 5.11e-11 | 7.13e-10 | 3.65e-10 | 102 |
| Page: 1 2 3 |
Top |
Cell-cell communication analysis |
| Identification of potential cell-cell interactions between two cell types and their ligand-receptor pairs for different disease states |
| Ligand | Receptor | LRpair | Pathway | Tissue | Disease Stage |
| IGF2 | IGF2R | IGF2_IGF2R | IGF | CRC | MSS |
| IGF2 | IGF2R | IGF2_IGF2R | IGF | Endometrium | Healthy |
| IGF2 | IGF2R | IGF2_IGF2R | IGF | Esophagus | ESCC |
| IGF2 | IGF2R | IGF2_IGF2R | IGF | HNSCC | ADJ |
| IGF2 | IGF2R | IGF2_IGF2R | IGF | HNSCC | OSCC |
| IGF2 | IGF2R | IGF2_IGF2R | IGF | HNSCC | Precancer |
| IGF2 | IGF2R | IGF2_IGF2R | IGF | Liver | Healthy |
| IGF2 | IGF2R | IGF2_IGF2R | IGF | Liver | Precancer |
| IGF2 | IGF2R | IGF2_IGF2R | IGF | Lung | ADJ |
| IGF2 | IGF2R | IGF2_IGF2R | IGF | Prostate | ADJ |
| IGF2 | IGF2R | IGF2_IGF2R | IGF | Prostate | Tumor |
| IGF2 | IGF2R | IGF2_IGF2R | IGF | Skin | cSCC |
| Page: 1 |
Top |
Single-cell gene regulatory network inference analysis |
| Find out the significant the regulons (TFs) and the target genes of each regulon across cell types for different disease states |
| TF | Cell Type | Tissue | Disease Stage | Target Gene | RSS | Regulon Activity |
| ∗The dot plots of a searched regulon are shown for all cell subpopulations in each disease state of each tissue based on the regulon specific score inferred using pySCENIC and by calculating the average expression. |
| Page: 1 |
Top |
Somatic mutation of malignant transformation related genes |
| Annotation of somatic variants for genes involved in malignant transformation |
| Hugo Symbol | Variant Class | Variant Classification | dbSNP RS | HGVSc | HGVSp | HGVSp Short | SWISSPROT | BIOTYPE | SIFT | PolyPhen | Tumor Sample Barcode | Tissue | Histology | Sex | Age | Stage | Therapy Types | Drugs | Outcome |
| IGF2R | SNV | Missense_Mutation | c.6655N>T | p.Asp2219Tyr | p.D2219Y | P11717 | protein_coding | deleterious(0.01) | probably_damaging(0.993) | TCGA-A2-A25A-01 | Breast | breast invasive carcinoma | Female | <65 | I/II | Unspecific | Cytoxan | SD | |
| IGF2R | SNV | Missense_Mutation | c.6210C>G | p.Asp2070Glu | p.D2070E | P11717 | protein_coding | tolerated(0.19) | benign(0.003) | TCGA-A8-A07R-01 | Breast | breast invasive carcinoma | Female | >=65 | III/IV | Ancillary | zoledronic | SD | |
| IGF2R | SNV | Missense_Mutation | c.1468N>T | p.Val490Phe | p.V490F | P11717 | protein_coding | deleterious(0.04) | possibly_damaging(0.522) | TCGA-AN-A0AK-01 | Breast | breast invasive carcinoma | Female | >=65 | I/II | Unknown | Unknown | SD | |
| IGF2R | SNV | Missense_Mutation | rs756307482 | c.4067N>A | p.Arg1356Gln | p.R1356Q | P11717 | protein_coding | tolerated(0.21) | possibly_damaging(0.51) | TCGA-AO-A128-01 | Breast | breast invasive carcinoma | Female | <65 | I/II | Chemotherapy | doxorubicin | SD |
| IGF2R | SNV | Missense_Mutation | c.4799C>T | p.Ser1600Phe | p.S1600F | P11717 | protein_coding | deleterious(0) | possibly_damaging(0.697) | TCGA-BH-A0B0-01 | Breast | breast invasive carcinoma | Female | <65 | I/II | Chemotherapy | adriamycin | CR | |
| IGF2R | SNV | Missense_Mutation | c.4868N>A | p.Arg1623Lys | p.R1623K | P11717 | protein_coding | tolerated(0.47) | benign(0.006) | TCGA-BH-A0HF-01 | Breast | breast invasive carcinoma | Female | >=65 | I/II | Hormone Therapy | arimidex | SD | |
| IGF2R | SNV | Missense_Mutation | novel | c.619N>G | p.Leu207Val | p.L207V | P11717 | protein_coding | deleterious(0.01) | probably_damaging(0.92) | TCGA-BH-A2L8-01 | Breast | breast invasive carcinoma | Female | <65 | I/II | Chemotherapy | cytoxan | CR |
| IGF2R | SNV | Missense_Mutation | c.3778C>T | p.Arg1260Trp | p.R1260W | P11717 | protein_coding | deleterious(0) | probably_damaging(0.995) | TCGA-E2-A574-01 | Breast | breast invasive carcinoma | Female | <65 | I/II | Chemotherapy | adriamycin | SD | |
| IGF2R | SNV | Missense_Mutation | c.6049C>G | p.Leu2017Val | p.L2017V | P11717 | protein_coding | tolerated(0.08) | benign(0.007) | TCGA-E9-A1N5-01 | Breast | breast invasive carcinoma | Female | <65 | I/II | Chemotherapy | doxorubicin | SD | |
| IGF2R | SNV | Missense_Mutation | c.2171N>G | p.Ala724Gly | p.A724G | P11717 | protein_coding | deleterious(0.01) | benign(0.162) | TCGA-E9-A1RE-01 | Breast | breast invasive carcinoma | Female | >=65 | III/IV | Hormone Therapy | tamoxiphen | SD |
| Page: 1 2 3 4 5 6 7 8 9 10 11 12 13 14 15 16 17 18 19 20 21 22 23 24 25 26 27 28 29 30 31 32 33 |
Top |
Related drugs of malignant transformation related genes |
| Identification of chemicals and drugs interact with genes involved in malignant transfromation |
| (DGIdb 4.0) |
| Entrez ID | Symbol | Category | Interaction Types | Drug Claim Name | Drug Name | PMIDs |
| 3482 | IGF2R | ENZYME, DRUGGABLE GENOME, CELL SURFACE | EP-128504 | |||
| 3482 | IGF2R | ENZYME, DRUGGABLE GENOME, CELL SURFACE | Juvidex | MANNOSE 6-PHOSPHATE | 20927486 | |
| 3482 | IGF2R | ENZYME, DRUGGABLE GENOME, CELL SURFACE | PXS-25 |
| Page: 1 |

Copyright 2023-Present -The University of Texas Health Science Center at Houston |