
|
|||||
|
 | |
| |
| |
| |
| |
| |
|
Gene: IGF2BP3 |
Gene summary for IGF2BP3 |
| Gene information | Species | Human | Gene symbol | IGF2BP3 | Gene ID | 10643 |
| Gene name | insulin like growth factor 2 mRNA binding protein 3 | |
| Gene Alias | CT98 | |
| Cytomap | 7p15.3 | |
| Gene Type | protein-coding | GO ID | GO:0001816 | UniProtAcc | O00425 |
Top |
Malignant transformation analysis |
| Identification of the aberrant gene expression in precancerous and cancerous lesions by comparing the gene expression of stem-like cells in diseased tissues with normal stem cells |
| Entrez ID | Symbol | Replicates | Species | Organ | Tissue | Adj P-value | Log2FC | Malignancy |
| 10643 | IGF2BP3 | AEH-subject4 | Human | Endometrium | AEH | 2.07e-06 | 2.73e-01 | -0.2657 |
| 10643 | IGF2BP3 | LZE2T | Human | Esophagus | ESCC | 5.44e-10 | 6.08e-01 | 0.082 |
| 10643 | IGF2BP3 | LZE4T | Human | Esophagus | ESCC | 1.70e-03 | 1.42e-01 | 0.0811 |
| 10643 | IGF2BP3 | LZE5T | Human | Esophagus | ESCC | 1.54e-04 | 4.90e-01 | 0.0514 |
| 10643 | IGF2BP3 | LZE22T | Human | Esophagus | ESCC | 1.57e-03 | 2.80e-01 | 0.068 |
| 10643 | IGF2BP3 | LZE24T | Human | Esophagus | ESCC | 2.42e-13 | 3.36e-01 | 0.0596 |
| 10643 | IGF2BP3 | P1T-E | Human | Esophagus | ESCC | 1.98e-11 | 4.79e-01 | 0.0875 |
| 10643 | IGF2BP3 | P2T-E | Human | Esophagus | ESCC | 9.53e-09 | 1.88e-01 | 0.1177 |
| 10643 | IGF2BP3 | P4T-E | Human | Esophagus | ESCC | 4.48e-22 | 5.24e-01 | 0.1323 |
| 10643 | IGF2BP3 | P5T-E | Human | Esophagus | ESCC | 7.98e-13 | 3.00e-01 | 0.1327 |
| 10643 | IGF2BP3 | P8T-E | Human | Esophagus | ESCC | 1.35e-23 | 4.30e-01 | 0.0889 |
| 10643 | IGF2BP3 | P9T-E | Human | Esophagus | ESCC | 5.45e-19 | 4.57e-01 | 0.1131 |
| 10643 | IGF2BP3 | P10T-E | Human | Esophagus | ESCC | 3.95e-30 | 6.01e-01 | 0.116 |
| 10643 | IGF2BP3 | P12T-E | Human | Esophagus | ESCC | 1.06e-41 | 7.67e-01 | 0.1122 |
| 10643 | IGF2BP3 | P17T-E | Human | Esophagus | ESCC | 8.50e-05 | 2.38e-01 | 0.1278 |
| 10643 | IGF2BP3 | P19T-E | Human | Esophagus | ESCC | 6.53e-04 | 3.14e-01 | 0.1662 |
| 10643 | IGF2BP3 | P20T-E | Human | Esophagus | ESCC | 8.21e-21 | 4.17e-01 | 0.1124 |
| 10643 | IGF2BP3 | P22T-E | Human | Esophagus | ESCC | 5.00e-17 | 3.17e-01 | 0.1236 |
| 10643 | IGF2BP3 | P23T-E | Human | Esophagus | ESCC | 4.19e-44 | 9.37e-01 | 0.108 |
| 10643 | IGF2BP3 | P26T-E | Human | Esophagus | ESCC | 3.02e-26 | 4.52e-01 | 0.1276 |
| Page: 1 2 3 4 |
| Tissue | Expression Dynamics | Abbreviation |
| Endometrium | 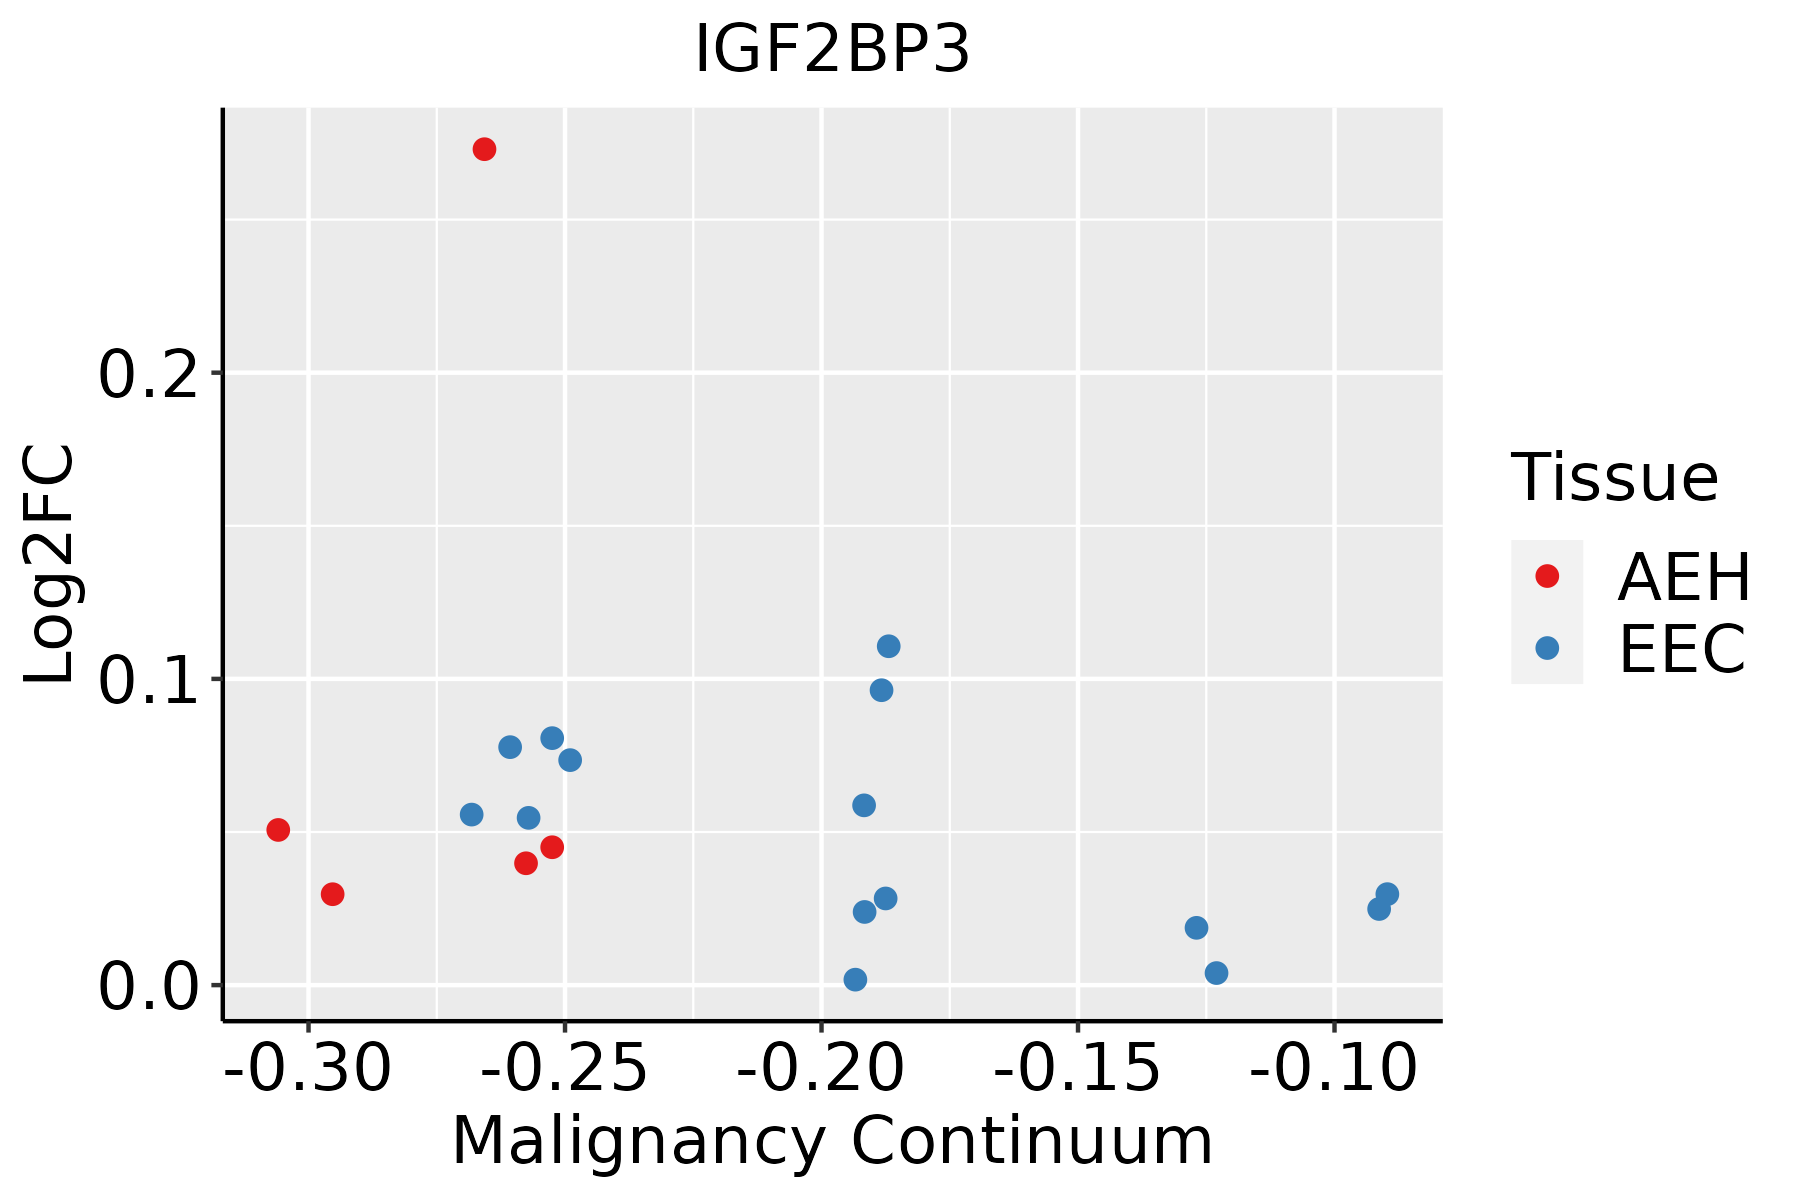 | AEH: Atypical endometrial hyperplasia |
| EEC: Endometrioid Cancer | ||
| Esophagus | 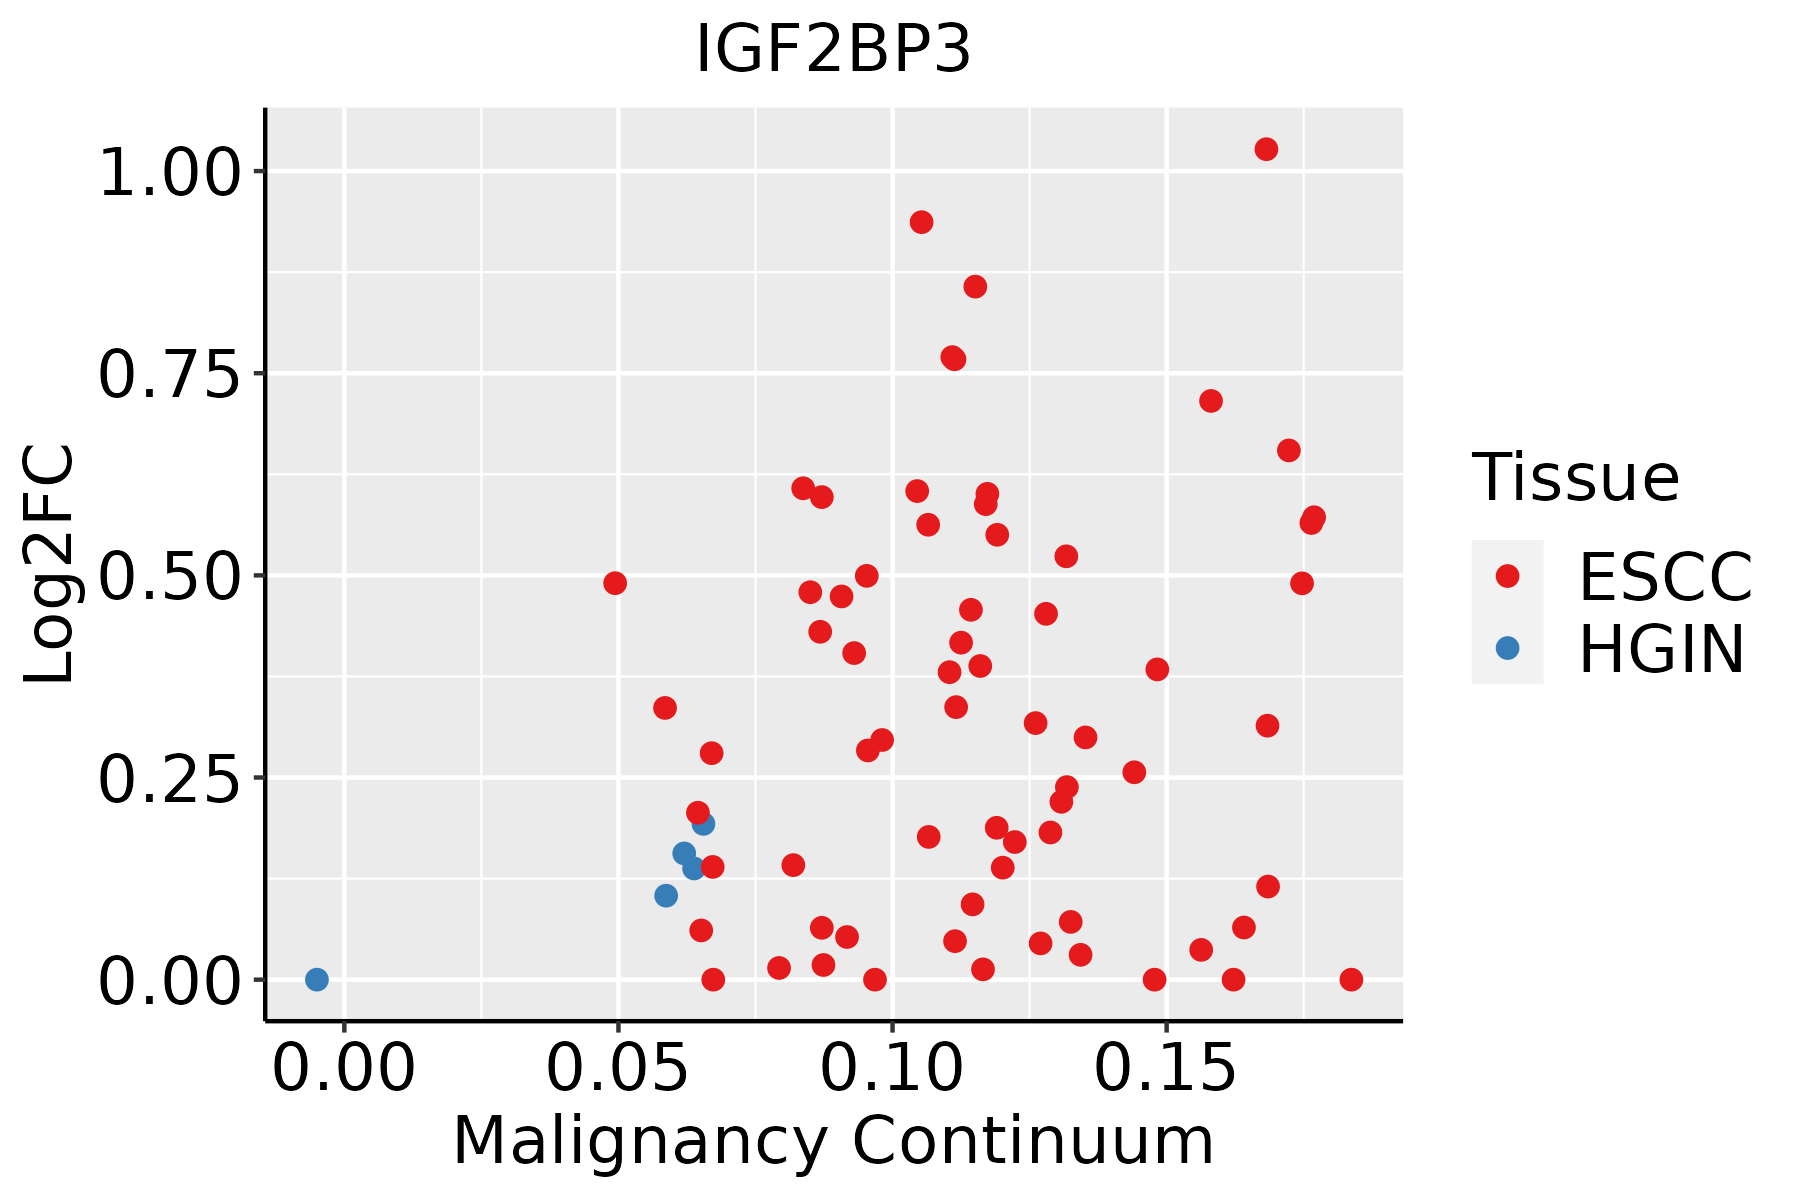 | ESCC: Esophageal squamous cell carcinoma |
| HGIN: High-grade intraepithelial neoplasias | ||
| LGIN: Low-grade intraepithelial neoplasias | ||
| Liver |  | HCC: Hepatocellular carcinoma |
| NAFLD: Non-alcoholic fatty liver disease | ||
| Oral Cavity | 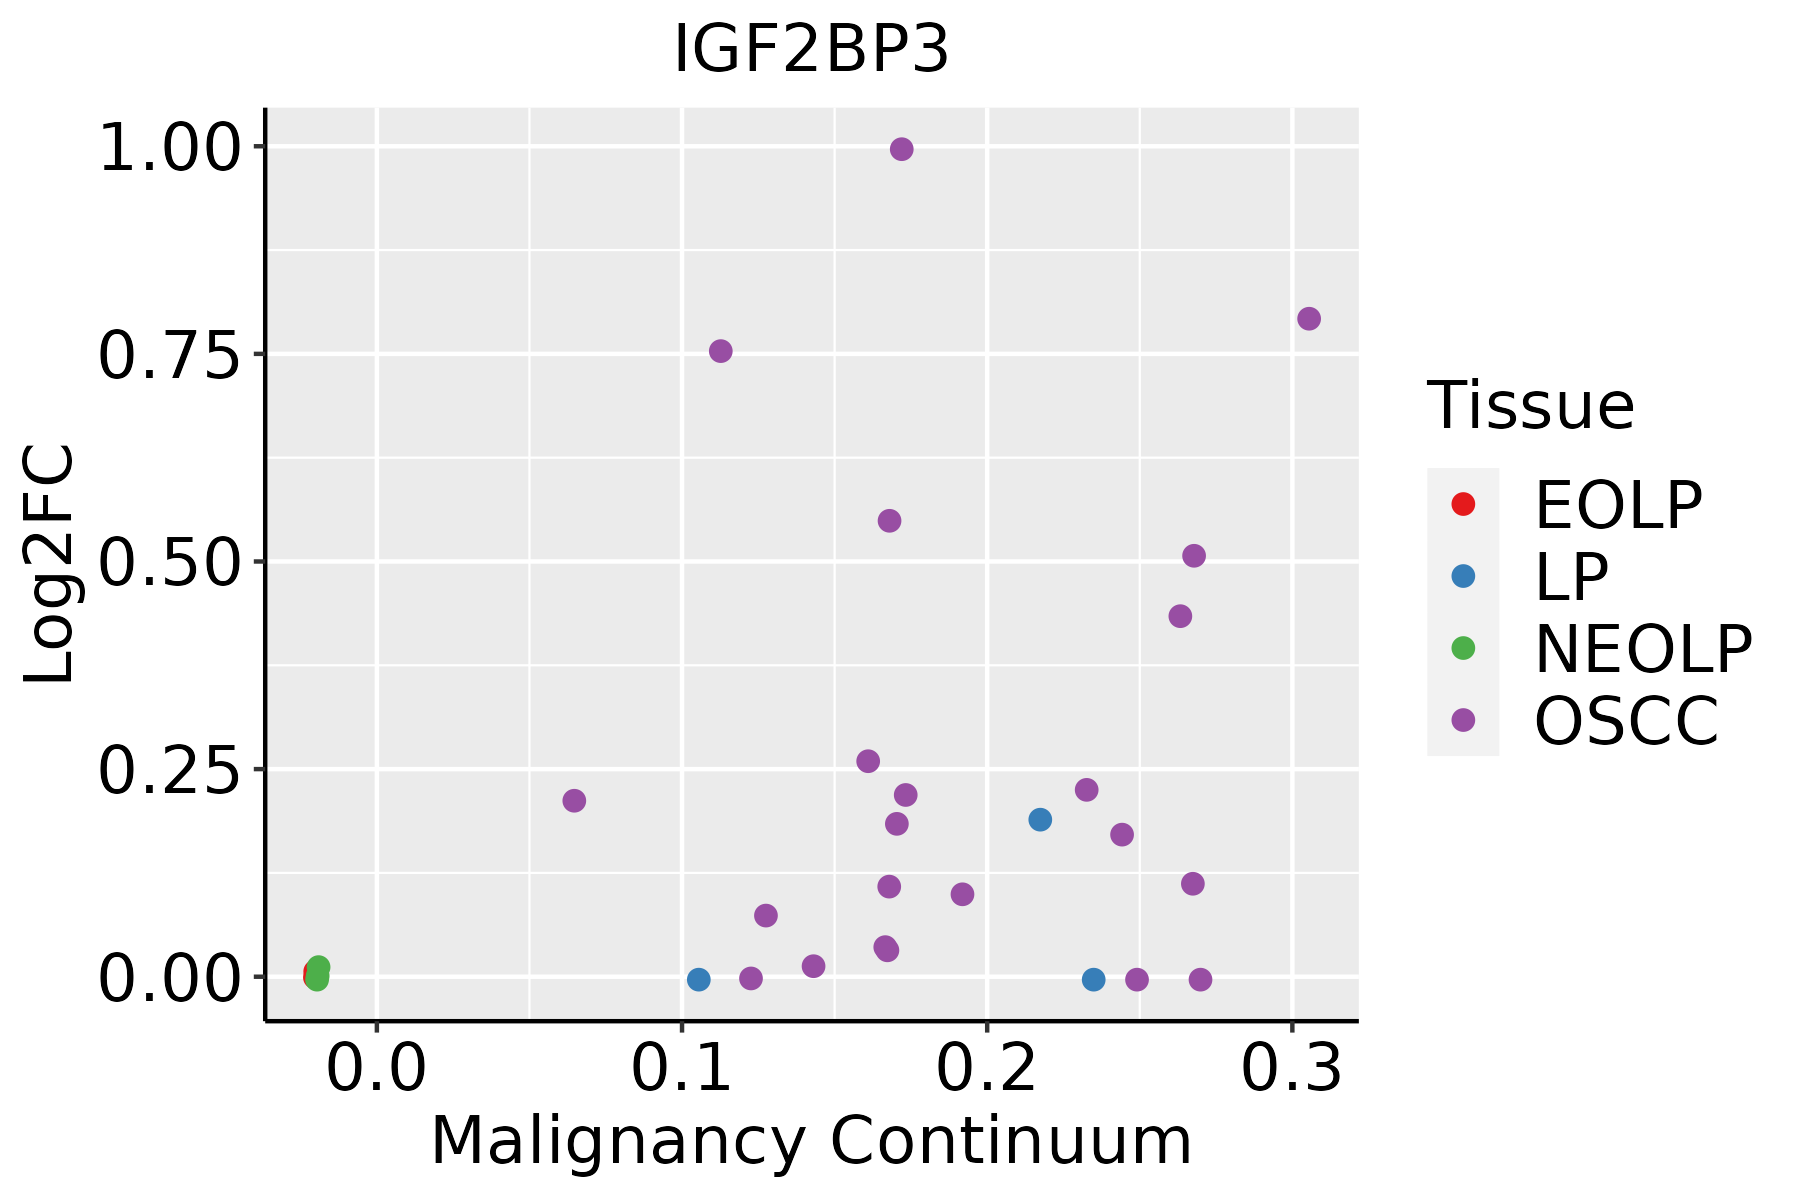 | EOLP: Erosive Oral lichen planus |
| LP: leukoplakia | ||
| NEOLP: Non-erosive oral lichen planus | ||
| OSCC: Oral squamous cell carcinoma | ||
| Thyroid | 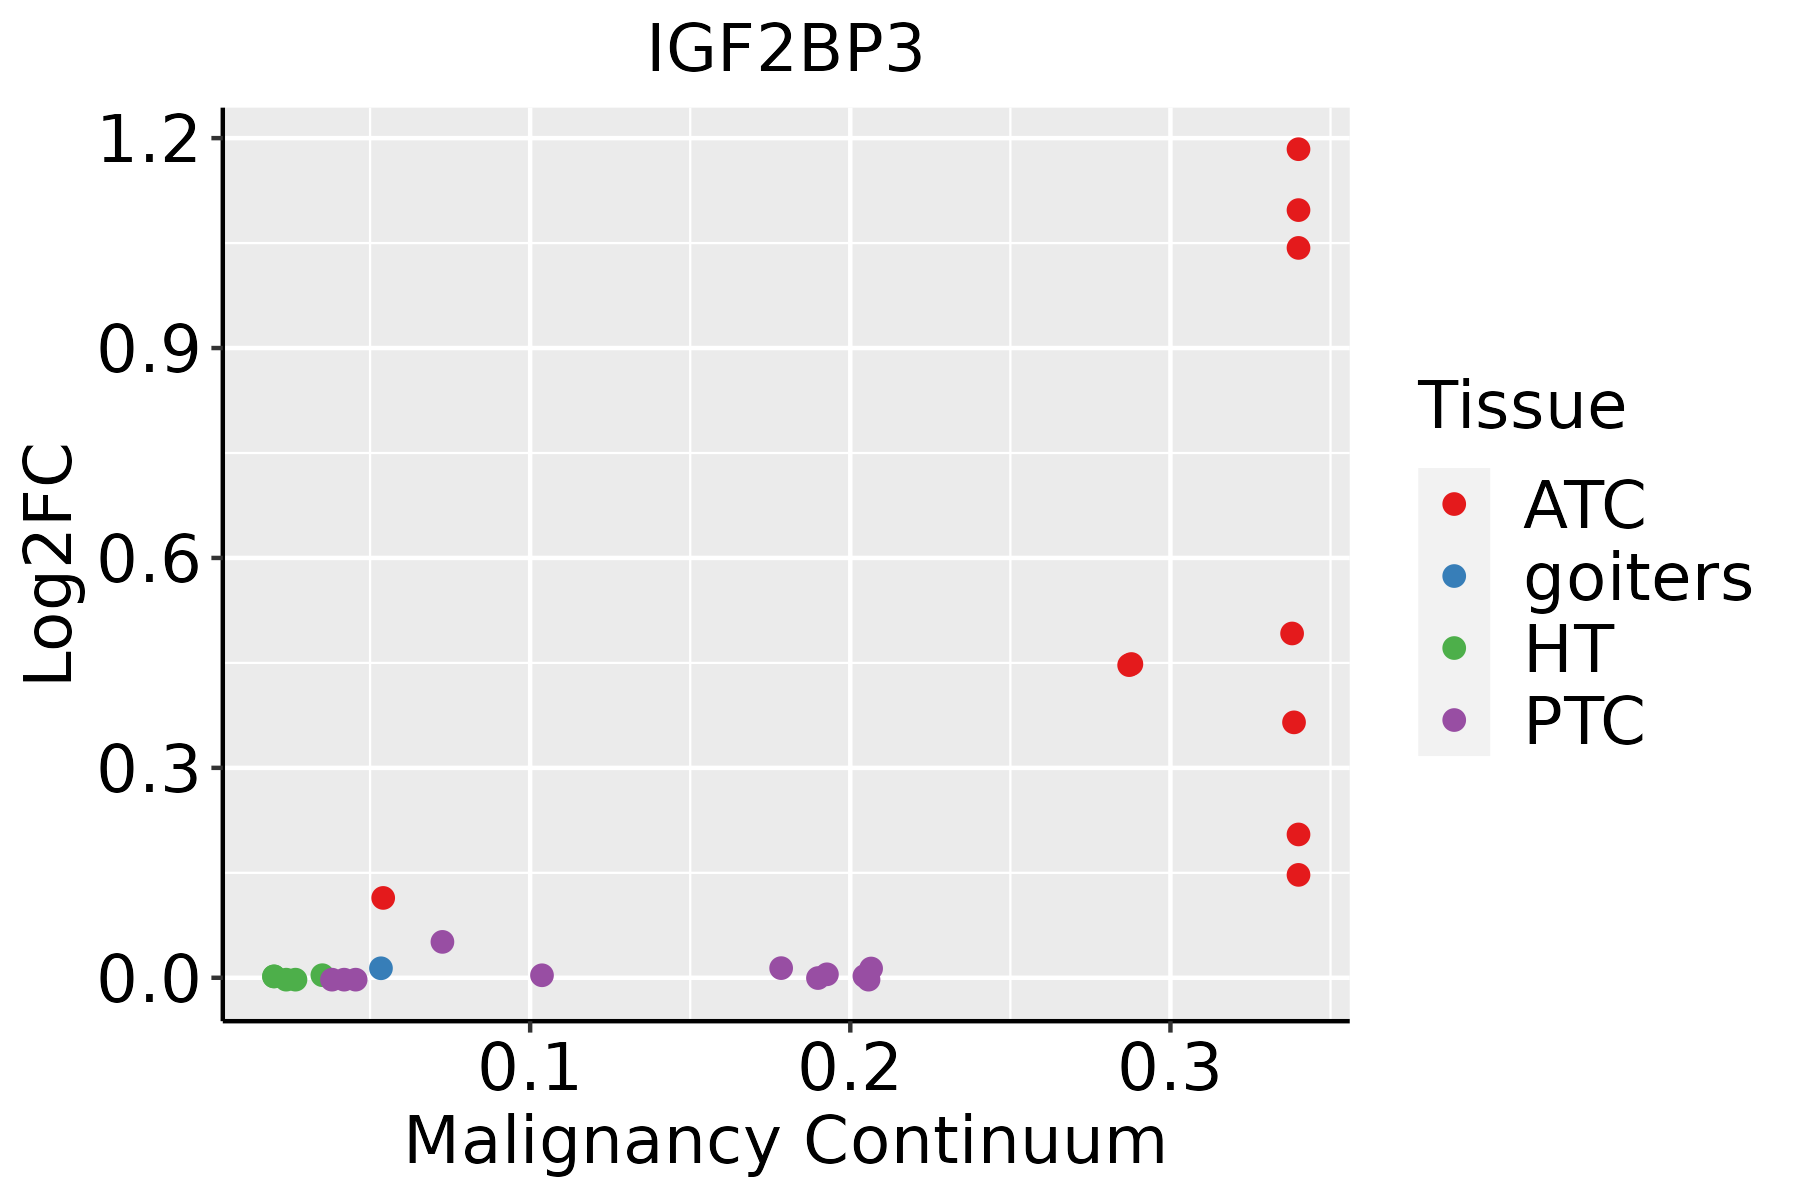 | ATC: Anaplastic thyroid cancer |
| HT: Hashimoto's thyroiditis | ||
| PTC: Papillary thyroid cancer |
| ∗log2FC in expression of this searched gene in stem-like cells from each diseased tissue sample relative to stem-like cells in normal samples in each tissue plotted against the malignancy continuum. Samples are colored based on if they are from different disease stage. |
Top |
Malignant transformation related pathway analysis |
| Find out the enriched GO biological processes and KEGG pathways involved in transition from healthy to precancer to cancer |
| Tissue | Disease Stage | Enriched GO biological Processes |
| Colorectum | AD |  |
| Colorectum | SER |  |
| Colorectum | MSS |  |
| Colorectum | MSI-H |  |
| Colorectum | FAP |  |
| ∗Top 15 enriched GO BP terms are showed in the bar plot of each disease state in each tissue. Each row represents a significant GO biological process which is colored according to the -log10(p.adjust). |
| Page: 1 2 3 4 5 6 7 8 9 |
| GO ID | Tissue | Disease Stage | Description | Gene Ratio | Bg Ratio | pvalue | p.adjust | Count |
| GO:000641716 | Endometrium | AEH | regulation of translation | 94/2100 | 468/18723 | 1.14e-08 | 7.62e-07 | 94 |
| GO:000640314 | Endometrium | AEH | RNA localization | 51/2100 | 201/18723 | 1.39e-08 | 8.98e-07 | 51 |
| GO:00506579 | Endometrium | AEH | nucleic acid transport | 37/2100 | 163/18723 | 2.04e-05 | 4.09e-04 | 37 |
| GO:00506589 | Endometrium | AEH | RNA transport | 37/2100 | 163/18723 | 2.04e-05 | 4.09e-04 | 37 |
| GO:00512369 | Endometrium | AEH | establishment of RNA localization | 37/2100 | 166/18723 | 3.13e-05 | 5.66e-04 | 37 |
| GO:00159319 | Endometrium | AEH | nucleobase-containing compound transport | 44/2100 | 222/18723 | 1.19e-04 | 1.66e-03 | 44 |
| GO:00510285 | Endometrium | AEH | mRNA transport | 28/2100 | 130/18723 | 4.94e-04 | 5.06e-03 | 28 |
| GO:0006403110 | Esophagus | ESCC | RNA localization | 166/8552 | 201/18723 | 1.95e-27 | 6.18e-25 | 166 |
| GO:005123617 | Esophagus | ESCC | establishment of RNA localization | 134/8552 | 166/18723 | 1.23e-20 | 1.81e-18 | 134 |
| GO:005102815 | Esophagus | ESCC | mRNA transport | 110/8552 | 130/18723 | 2.76e-20 | 3.80e-18 | 110 |
| GO:005065717 | Esophagus | ESCC | nucleic acid transport | 131/8552 | 163/18723 | 6.94e-20 | 8.46e-18 | 131 |
| GO:005065817 | Esophagus | ESCC | RNA transport | 131/8552 | 163/18723 | 6.94e-20 | 8.46e-18 | 131 |
| GO:0006417111 | Esophagus | ESCC | regulation of translation | 304/8552 | 468/18723 | 1.53e-17 | 1.33e-15 | 304 |
| GO:001593117 | Esophagus | ESCC | nucleobase-containing compound transport | 162/8552 | 222/18723 | 9.87e-17 | 7.93e-15 | 162 |
| GO:003424914 | Esophagus | ESCC | negative regulation of cellular amide metabolic process | 144/8552 | 273/18723 | 1.08e-02 | 3.67e-02 | 144 |
| GO:000640321 | Liver | HCC | RNA localization | 151/7958 | 201/18723 | 3.72e-21 | 5.89e-19 | 151 |
| GO:000641722 | Liver | HCC | regulation of translation | 287/7958 | 468/18723 | 8.79e-17 | 8.08e-15 | 287 |
| GO:005123621 | Liver | HCC | establishment of RNA localization | 121/7958 | 166/18723 | 1.61e-15 | 1.19e-13 | 121 |
| GO:005065711 | Liver | HCC | nucleic acid transport | 118/7958 | 163/18723 | 8.30e-15 | 5.60e-13 | 118 |
| GO:005065811 | Liver | HCC | RNA transport | 118/7958 | 163/18723 | 8.30e-15 | 5.60e-13 | 118 |
| Page: 1 2 3 |
| Pathway ID | Tissue | Disease Stage | Description | Gene Ratio | Bg Ratio | pvalue | p.adjust | qvalue | Count |
| Page: 1 |
Top |
Cell-cell communication analysis |
| Identification of potential cell-cell interactions between two cell types and their ligand-receptor pairs for different disease states |
| Ligand | Receptor | LRpair | Pathway | Tissue | Disease Stage |
| Page: 1 |
Top |
Single-cell gene regulatory network inference analysis |
| Find out the significant the regulons (TFs) and the target genes of each regulon across cell types for different disease states |
| TF | Cell Type | Tissue | Disease Stage | Target Gene | RSS | Regulon Activity |
| ∗The dot plots of a searched regulon are shown for all cell subpopulations in each disease state of each tissue based on the regulon specific score inferred using pySCENIC and by calculating the average expression. |
| Page: 1 |
Top |
Somatic mutation of malignant transformation related genes |
| Annotation of somatic variants for genes involved in malignant transformation |
| Hugo Symbol | Variant Class | Variant Classification | dbSNP RS | HGVSc | HGVSp | HGVSp Short | SWISSPROT | BIOTYPE | SIFT | PolyPhen | Tumor Sample Barcode | Tissue | Histology | Sex | Age | Stage | Therapy Types | Drugs | Outcome |
| IGF2BP3 | SNV | Missense_Mutation | rs141308145 | c.1732N>T | p.Arg578Trp | p.R578W | O00425 | protein_coding | deleterious_low_confidence(0) | benign(0.001) | TCGA-A8-A09A-01 | Breast | breast invasive carcinoma | Female | <65 | I/II | Hormone Therapy | tamoxiphen | SD |
| IGF2BP3 | SNV | Missense_Mutation | novel | c.1325C>T | p.Ala442Val | p.A442V | O00425 | protein_coding | deleterious(0.05) | probably_damaging(0.915) | TCGA-2W-A8YY-01 | Cervix | cervical & endocervical cancer | Female | <65 | I/II | Chemotherapy | cisplatin | CR |
| IGF2BP3 | SNV | Missense_Mutation | c.1487C>G | p.Ser496Cys | p.S496C | O00425 | protein_coding | deleterious(0) | probably_damaging(0.964) | TCGA-C5-A1MH-01 | Cervix | cervical & endocervical cancer | Female | >=65 | III/IV | Chemotherapy | cisplatin | PD | |
| IGF2BP3 | SNV | Missense_Mutation | novel | c.161N>C | p.Ile54Thr | p.I54T | O00425 | protein_coding | deleterious(0) | benign(0.124) | TCGA-C5-A8YQ-01 | Cervix | cervical & endocervical cancer | Female | >=65 | I/II | Chemotherapy | cisplatin | PD |
| IGF2BP3 | SNV | Missense_Mutation | c.868C>T | p.Arg290Cys | p.R290C | O00425 | protein_coding | deleterious(0) | possibly_damaging(0.665) | TCGA-EA-A3HS-01 | Cervix | cervical & endocervical cancer | Female | <65 | I/II | Unknown | Unknown | SD | |
| IGF2BP3 | SNV | Missense_Mutation | c.1406G>T | p.Arg469Ile | p.R469I | O00425 | protein_coding | deleterious(0.02) | possibly_damaging(0.881) | TCGA-FU-A3HZ-01 | Cervix | cervical & endocervical cancer | Female | <65 | I/II | Chemotherapy | cisplatin | CR | |
| IGF2BP3 | SNV | Missense_Mutation | novel | c.1381G>A | p.Glu461Lys | p.E461K | O00425 | protein_coding | deleterious(0) | probably_damaging(0.996) | TCGA-MA-AA43-01 | Cervix | cervical & endocervical cancer | Female | <65 | III/IV | Unknown | Unknown | SD |
| IGF2BP3 | SNV | Missense_Mutation | c.184N>A | p.Glu62Lys | p.E62K | O00425 | protein_coding | tolerated(0.06) | benign(0.377) | TCGA-AA-3684-01 | Colorectum | colon adenocarcinoma | Female | >=65 | III/IV | Unknown | Unknown | SD | |
| IGF2BP3 | SNV | Missense_Mutation | c.719N>A | p.Ala240Asp | p.A240D | O00425 | protein_coding | deleterious(0.01) | benign(0.292) | TCGA-AA-A010-01 | Colorectum | colon adenocarcinoma | Female | <65 | I/II | Chemotherapy | folinic | CR | |
| IGF2BP3 | SNV | Missense_Mutation | c.672N>T | p.Gln224His | p.Q224H | O00425 | protein_coding | deleterious(0.02) | probably_damaging(0.99) | TCGA-AA-A024-01 | Colorectum | colon adenocarcinoma | Male | >=65 | I/II | Unknown | Unknown | SD |
| Page: 1 2 3 4 5 6 7 |
Top |
Related drugs of malignant transformation related genes |
| Identification of chemicals and drugs interact with genes involved in malignant transfromation |
| (DGIdb 4.0) |
| Entrez ID | Symbol | Category | Interaction Types | Drug Claim Name | Drug Name | PMIDs |
| Page: 1 |

Copyright 2023-Present -The University of Texas Health Science Center at Houston |