
|
|||||
|
 | |
| |
| |
| |
| |
| |
|
Gene: IGF1R |
Gene summary for IGF1R |
| Gene information | Species | Human | Gene symbol | IGF1R | Gene ID | 3480 |
| Gene name | insulin like growth factor 1 receptor | |
| Gene Alias | CD221 | |
| Cytomap | 15q26.3 | |
| Gene Type | protein-coding | GO ID | GO:0000165 | UniProtAcc | P08069 |
Top |
Malignant transformation analysis |
| Identification of the aberrant gene expression in precancerous and cancerous lesions by comparing the gene expression of stem-like cells in diseased tissues with normal stem cells |
| Entrez ID | Symbol | Replicates | Species | Organ | Tissue | Adj P-value | Log2FC | Malignancy |
| 3480 | IGF1R | CA_HPV_1 | Human | Cervix | CC | 5.57e-08 | -2.60e-01 | 0.0264 |
| 3480 | IGF1R | CCI_1 | Human | Cervix | CC | 2.71e-06 | 1.60e+00 | 0.528 |
| 3480 | IGF1R | CCI_2 | Human | Cervix | CC | 1.66e-13 | 2.10e+00 | 0.5249 |
| 3480 | IGF1R | CCI_3 | Human | Cervix | CC | 1.34e-09 | 1.27e+00 | 0.516 |
| 3480 | IGF1R | H2 | Human | Cervix | HSIL_HPV | 1.31e-02 | 2.27e-01 | 0.0632 |
| 3480 | IGF1R | HTA11_3410_2000001011 | Human | Colorectum | AD | 1.85e-31 | -7.30e-01 | 0.0155 |
| 3480 | IGF1R | HTA11_2487_2000001011 | Human | Colorectum | SER | 7.09e-07 | -5.76e-01 | -0.1808 |
| 3480 | IGF1R | HTA11_2951_2000001011 | Human | Colorectum | AD | 1.99e-03 | -5.93e-01 | 0.0216 |
| 3480 | IGF1R | HTA11_78_2000001011 | Human | Colorectum | AD | 1.80e-02 | -4.13e-01 | -0.1088 |
| 3480 | IGF1R | HTA11_3361_2000001011 | Human | Colorectum | AD | 1.42e-09 | -5.80e-01 | -0.1207 |
| 3480 | IGF1R | HTA11_83_2000001011 | Human | Colorectum | SER | 2.39e-03 | -5.42e-01 | -0.1526 |
| 3480 | IGF1R | HTA11_696_2000001011 | Human | Colorectum | AD | 1.11e-11 | -4.71e-01 | -0.1464 |
| 3480 | IGF1R | HTA11_866_2000001011 | Human | Colorectum | AD | 3.15e-04 | -3.85e-01 | -0.1001 |
| 3480 | IGF1R | HTA11_1391_2000001011 | Human | Colorectum | AD | 2.86e-06 | -4.63e-01 | -0.059 |
| 3480 | IGF1R | HTA11_2992_2000001011 | Human | Colorectum | SER | 6.10e-04 | -5.55e-01 | -0.1706 |
| 3480 | IGF1R | HTA11_5212_2000001011 | Human | Colorectum | AD | 5.63e-05 | -7.19e-01 | -0.2061 |
| 3480 | IGF1R | HTA11_5216_2000001011 | Human | Colorectum | SER | 1.79e-03 | -6.16e-01 | -0.1462 |
| 3480 | IGF1R | HTA11_866_3004761011 | Human | Colorectum | AD | 1.26e-12 | -5.17e-01 | 0.096 |
| 3480 | IGF1R | HTA11_10711_2000001011 | Human | Colorectum | AD | 1.48e-05 | -5.40e-01 | 0.0338 |
| 3480 | IGF1R | HTA11_7696_3000711011 | Human | Colorectum | AD | 2.29e-08 | -4.90e-01 | 0.0674 |
| Page: 1 2 3 4 5 6 7 8 9 10 11 12 |
| Tissue | Expression Dynamics | Abbreviation |
| Cervix | 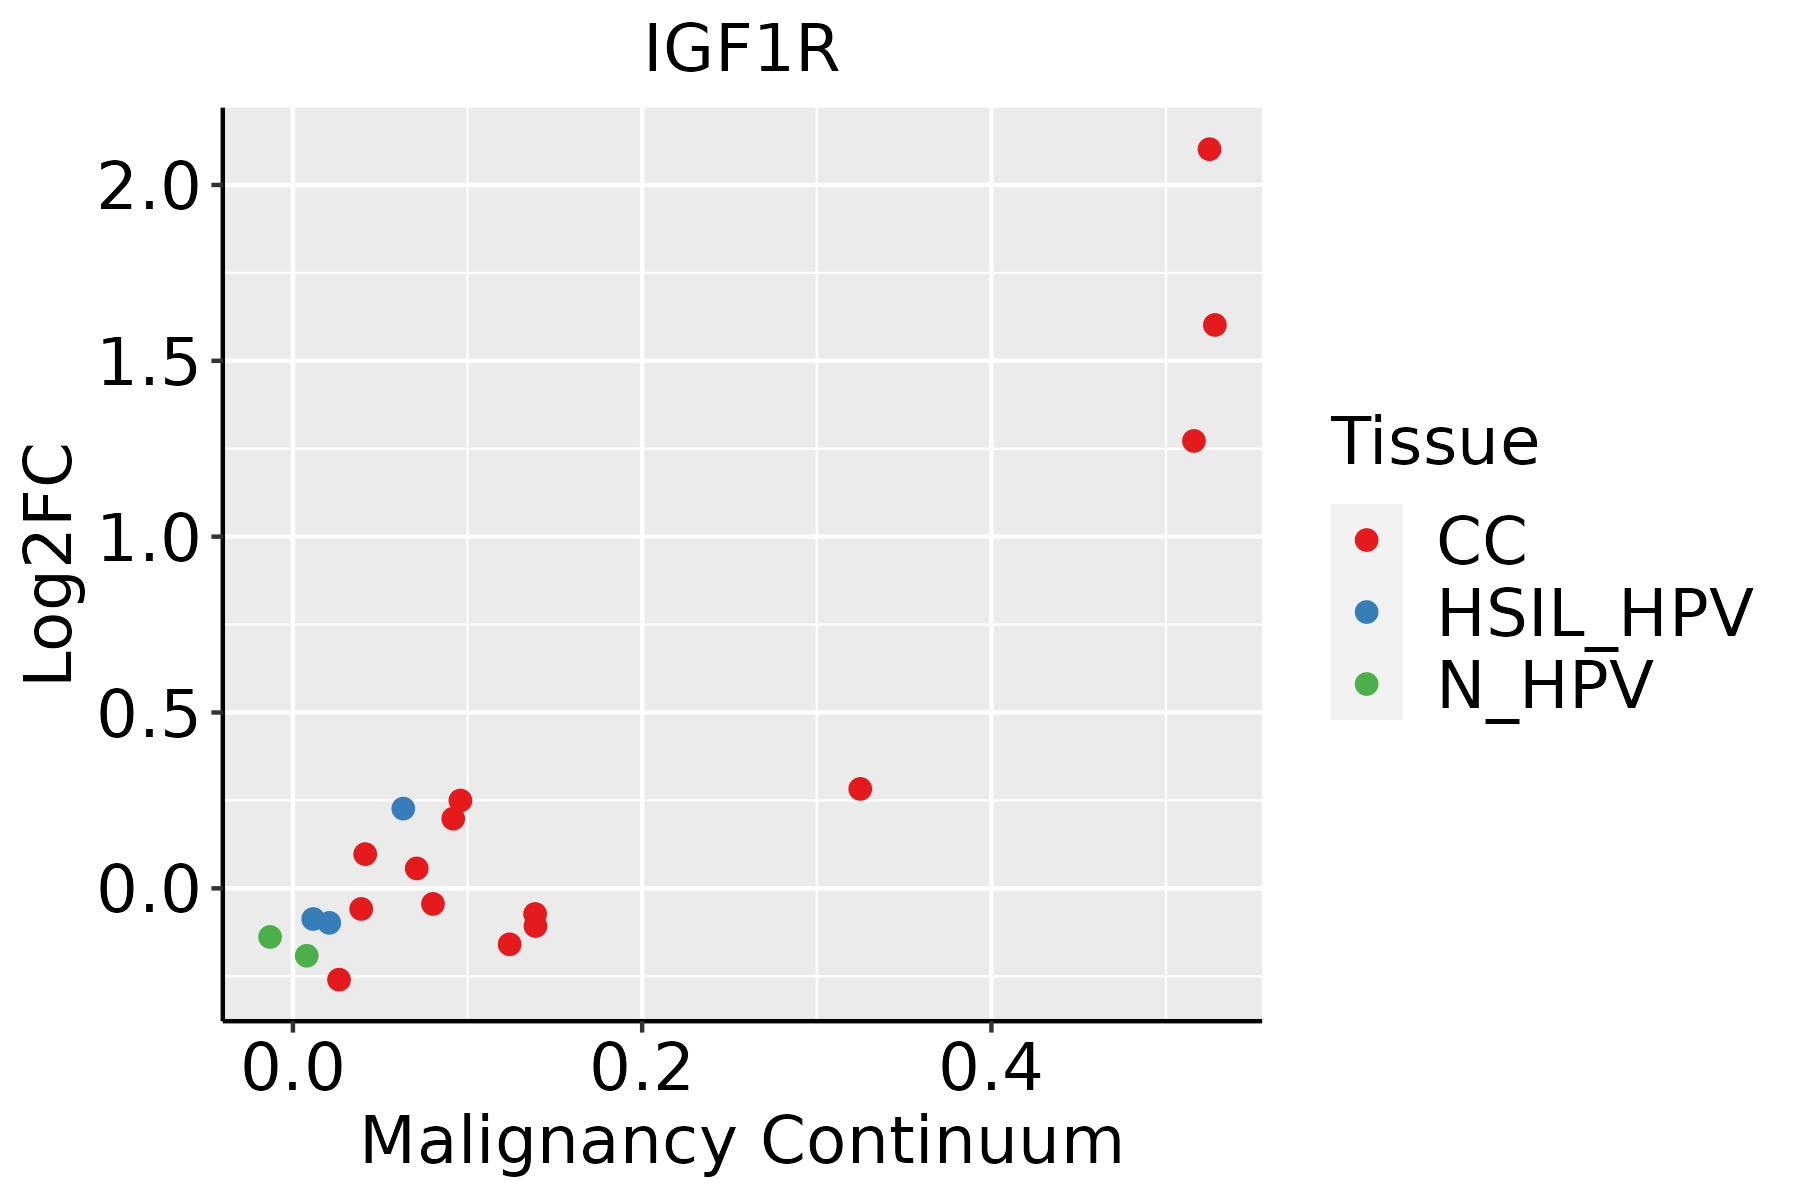 | CC: Cervix cancer |
| HSIL_HPV: HPV-infected high-grade squamous intraepithelial lesions | ||
| N_HPV: HPV-infected normal cervix | ||
| Colorectum (GSE201348) |  | FAP: Familial adenomatous polyposis |
| CRC: Colorectal cancer | ||
| Colorectum (HTA11) |  | AD: Adenomas |
| SER: Sessile serrated lesions | ||
| MSI-H: Microsatellite-high colorectal cancer | ||
| MSS: Microsatellite stable colorectal cancer | ||
| Endometrium |  | AEH: Atypical endometrial hyperplasia |
| EEC: Endometrioid Cancer | ||
| Esophagus |  | ESCC: Esophageal squamous cell carcinoma |
| HGIN: High-grade intraepithelial neoplasias | ||
| LGIN: Low-grade intraepithelial neoplasias | ||
| Lung | 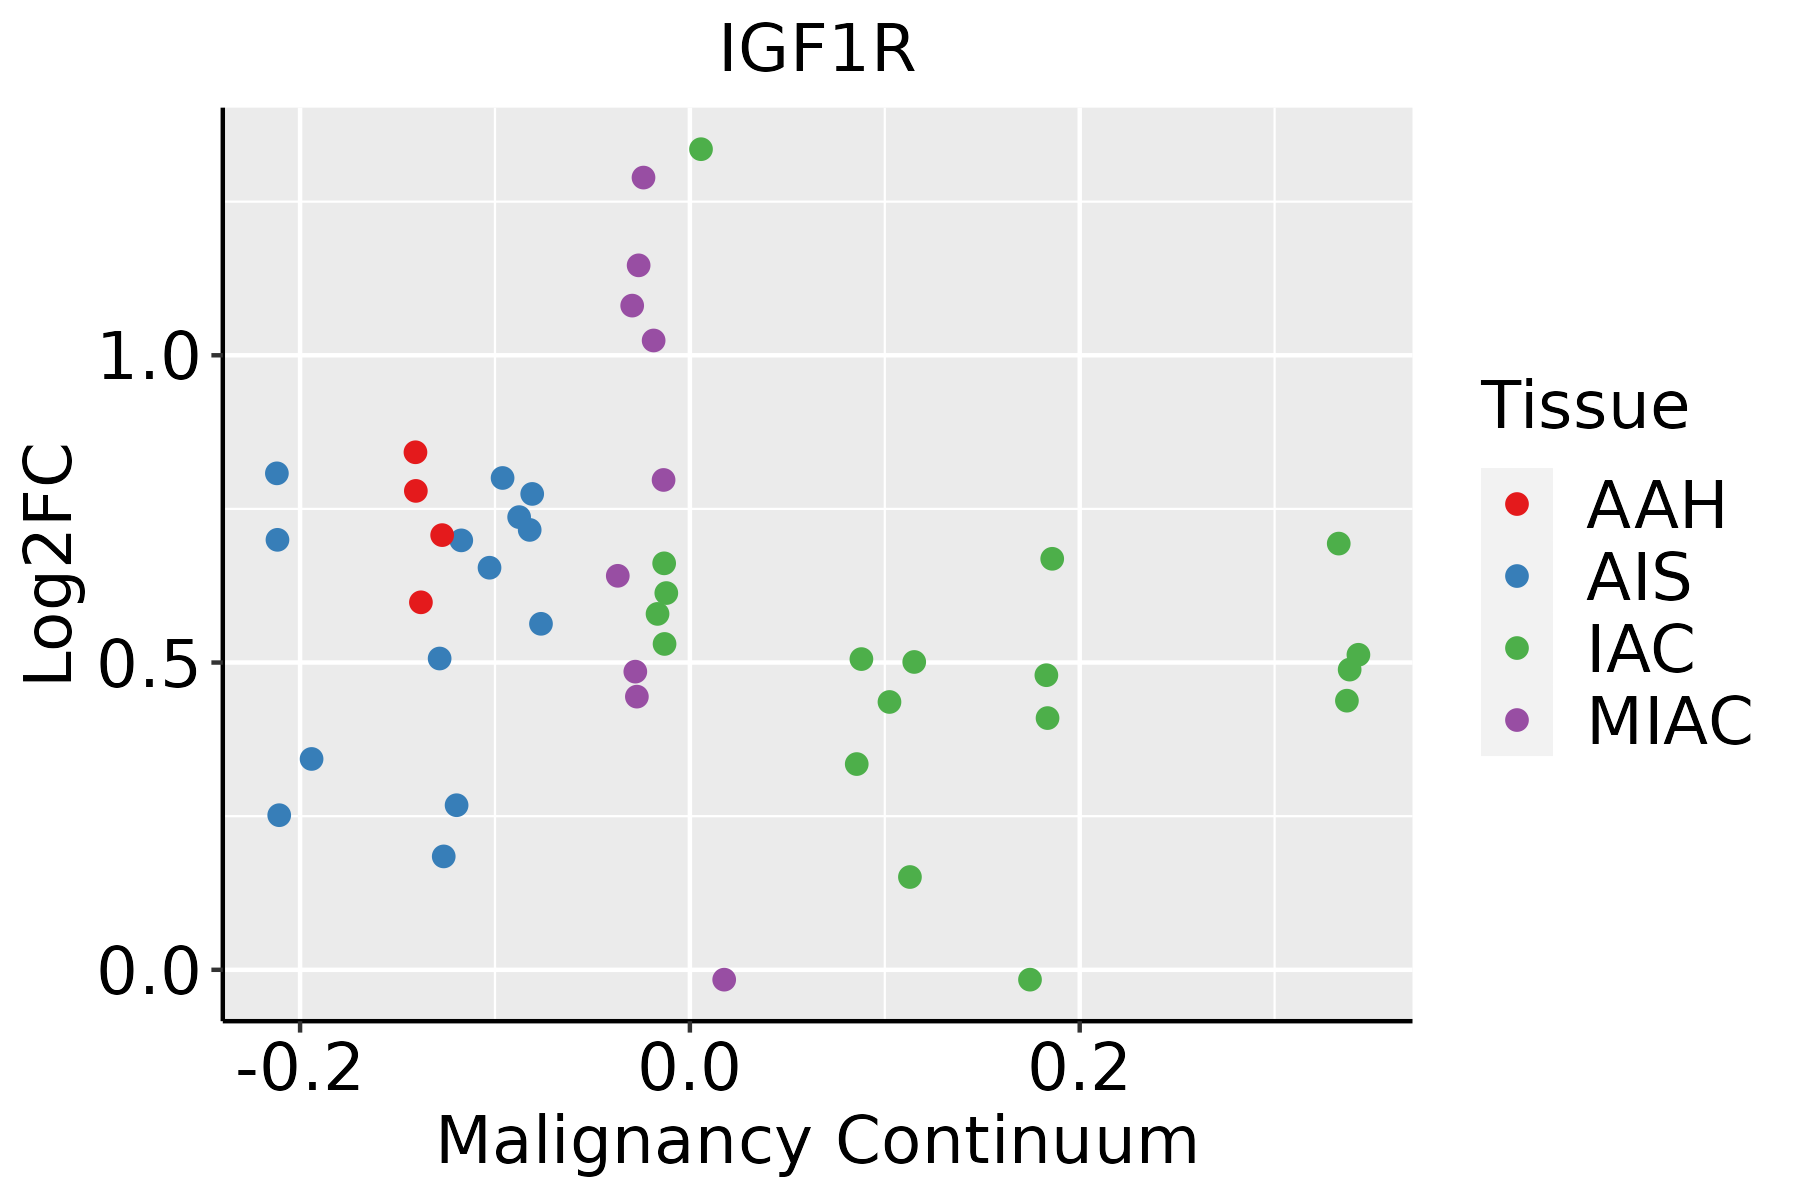 | AAH: Atypical adenomatous hyperplasia |
| AIS: Adenocarcinoma in situ | ||
| IAC: Invasive lung adenocarcinoma | ||
| MIA: Minimally invasive adenocarcinoma | ||
| Oral Cavity |  | EOLP: Erosive Oral lichen planus |
| LP: leukoplakia | ||
| NEOLP: Non-erosive oral lichen planus | ||
| OSCC: Oral squamous cell carcinoma | ||
| Prostate |  | BPH: Benign Prostatic Hyperplasia |
| Skin | 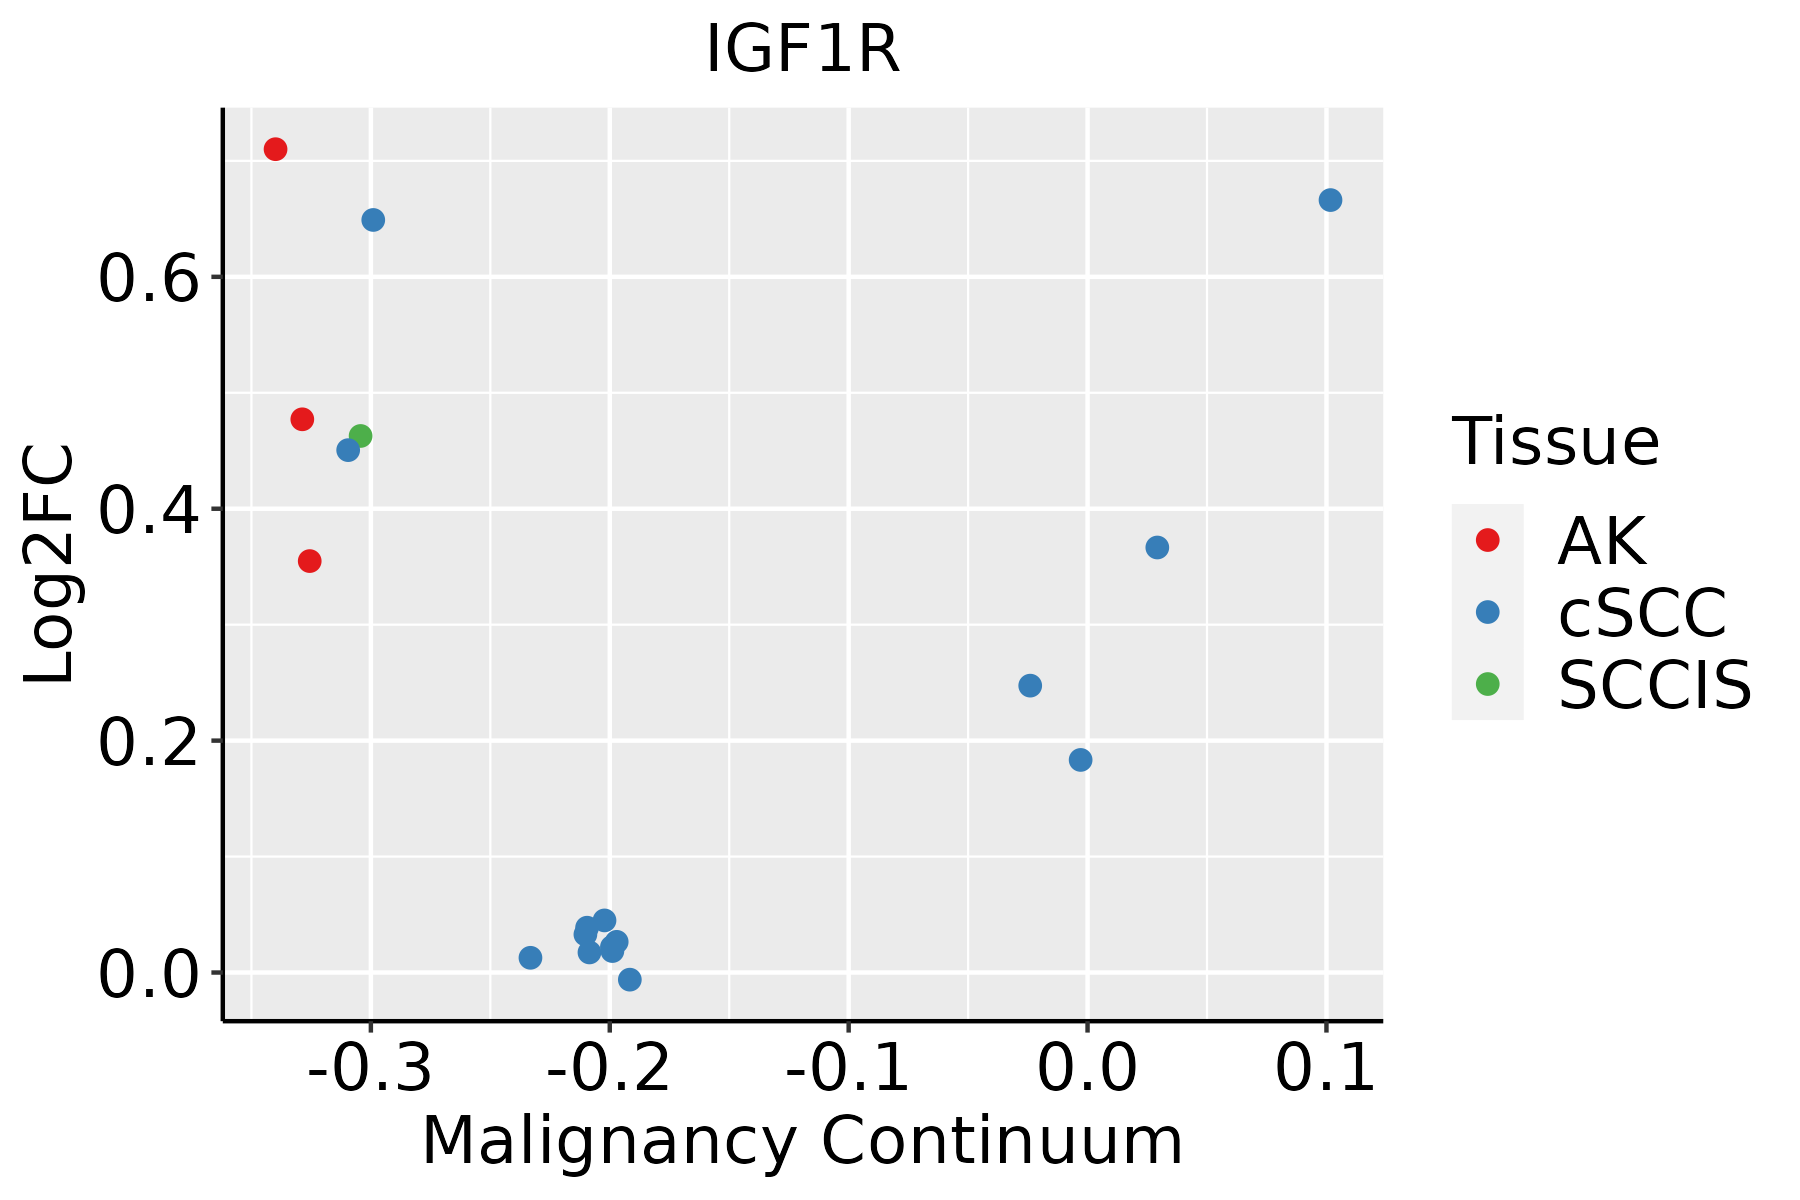 | AK: Actinic keratosis |
| cSCC: Cutaneous squamous cell carcinoma | ||
| SCCIS:squamous cell carcinoma in situ | ||
| Thyroid | 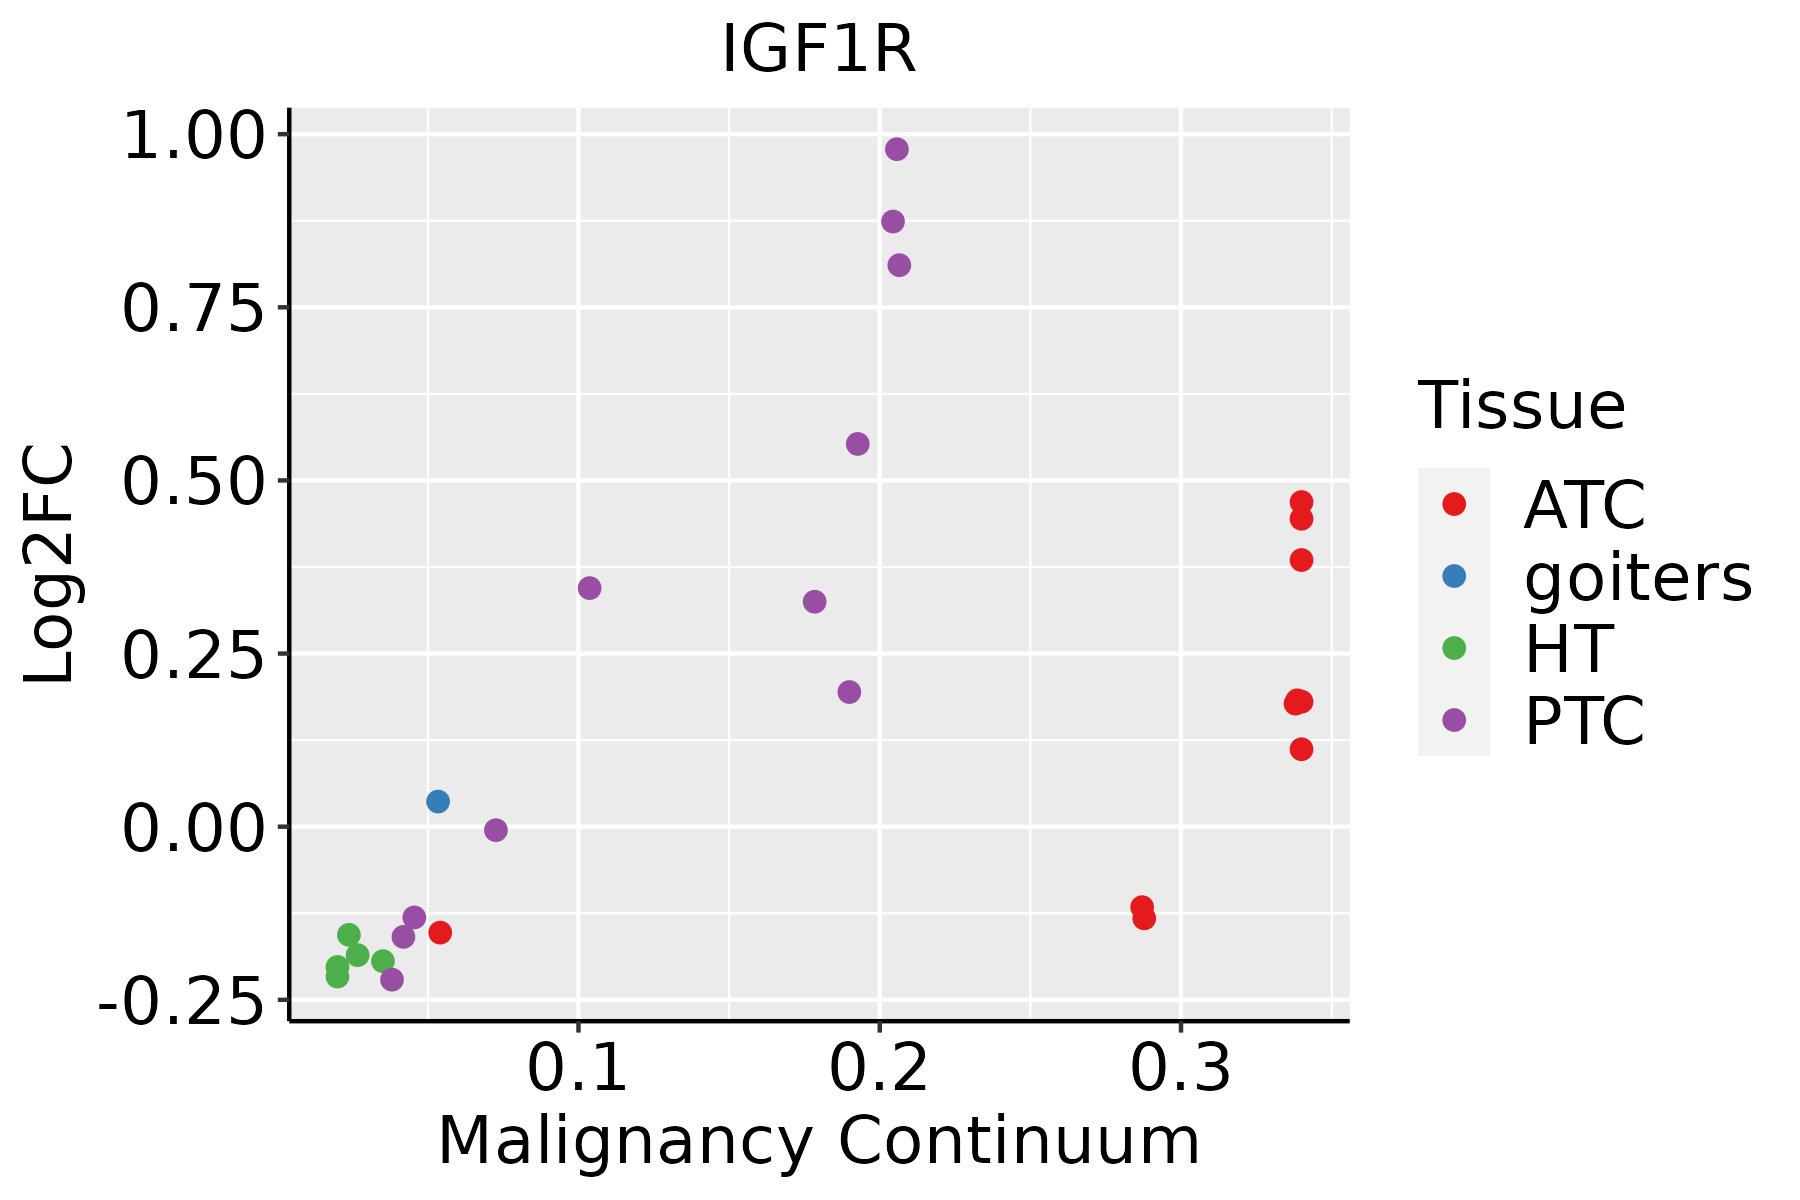 | ATC: Anaplastic thyroid cancer |
| HT: Hashimoto's thyroiditis | ||
| PTC: Papillary thyroid cancer |
| ∗log2FC in expression of this searched gene in stem-like cells from each diseased tissue sample relative to stem-like cells in normal samples in each tissue plotted against the malignancy continuum. Samples are colored based on if they are from different disease stage. |
Top |
Malignant transformation related pathway analysis |
| Find out the enriched GO biological processes and KEGG pathways involved in transition from healthy to precancer to cancer |
| Tissue | Disease Stage | Enriched GO biological Processes |
| Colorectum | AD |  |
| Colorectum | SER |  |
| Colorectum | MSS |  |
| Colorectum | MSI-H |  |
| Colorectum | FAP |  |
| ∗Top 15 enriched GO BP terms are showed in the bar plot of each disease state in each tissue. Each row represents a significant GO biological process which is colored according to the -log10(p.adjust). |
| Page: 1 2 3 4 5 6 7 8 9 |
| GO ID | Tissue | Disease Stage | Description | Gene Ratio | Bg Ratio | pvalue | p.adjust | Count |
| GO:003367410 | Cervix | CC | positive regulation of kinase activity | 101/2311 | 467/18723 | 8.66e-09 | 7.22e-07 | 101 |
| GO:00310988 | Cervix | CC | stress-activated protein kinase signaling cascade | 58/2311 | 247/18723 | 8.02e-07 | 2.89e-05 | 58 |
| GO:00514038 | Cervix | CC | stress-activated MAPK cascade | 55/2311 | 239/18723 | 2.96e-06 | 8.31e-05 | 55 |
| GO:00703027 | Cervix | CC | regulation of stress-activated protein kinase signaling cascade | 46/2311 | 195/18723 | 9.35e-06 | 2.11e-04 | 46 |
| GO:19016538 | Cervix | CC | cellular response to peptide | 72/2311 | 359/18723 | 1.89e-05 | 3.48e-04 | 72 |
| GO:00434104 | Cervix | CC | positive regulation of MAPK cascade | 90/2311 | 480/18723 | 2.92e-05 | 4.83e-04 | 90 |
| GO:00328727 | Cervix | CC | regulation of stress-activated MAPK cascade | 44/2311 | 192/18723 | 3.09e-05 | 5.10e-04 | 44 |
| GO:002241110 | Cervix | CC | cellular component disassembly | 83/2311 | 443/18723 | 6.04e-05 | 8.68e-04 | 83 |
| GO:000974310 | Cervix | CC | response to carbohydrate | 53/2311 | 253/18723 | 7.02e-05 | 9.85e-04 | 53 |
| GO:003428410 | Cervix | CC | response to monosaccharide | 48/2311 | 225/18723 | 9.48e-05 | 1.25e-03 | 48 |
| GO:00434349 | Cervix | CC | response to peptide hormone | 77/2311 | 414/18723 | 1.40e-04 | 1.70e-03 | 77 |
| GO:00713757 | Cervix | CC | cellular response to peptide hormone stimulus | 57/2311 | 290/18723 | 2.32e-04 | 2.59e-03 | 57 |
| GO:000974610 | Cervix | CC | response to hexose | 45/2311 | 219/18723 | 3.73e-04 | 3.86e-03 | 45 |
| GO:00328698 | Cervix | CC | cellular response to insulin stimulus | 42/2311 | 203/18723 | 4.95e-04 | 4.83e-03 | 42 |
| GO:00518964 | Cervix | CC | regulation of protein kinase B signaling | 39/2311 | 185/18723 | 5.25e-04 | 5.10e-03 | 39 |
| GO:00518973 | Cervix | CC | positive regulation of protein kinase B signaling | 28/2311 | 120/18723 | 5.90e-04 | 5.59e-03 | 28 |
| GO:00434913 | Cervix | CC | protein kinase B signaling | 43/2311 | 211/18723 | 5.95e-04 | 5.60e-03 | 43 |
| GO:00425939 | Cervix | CC | glucose homeostasis | 50/2311 | 258/18723 | 7.57e-04 | 6.76e-03 | 50 |
| GO:00335009 | Cervix | CC | carbohydrate homeostasis | 50/2311 | 259/18723 | 8.28e-04 | 7.22e-03 | 50 |
| GO:00016788 | Cervix | CC | cellular glucose homeostasis | 36/2311 | 172/18723 | 9.65e-04 | 8.09e-03 | 36 |
| Page: 1 2 3 4 5 6 7 8 9 10 11 12 13 14 15 16 17 18 19 20 21 22 23 24 25 26 27 28 29 30 31 32 33 34 35 36 37 38 39 40 41 |
| Pathway ID | Tissue | Disease Stage | Description | Gene Ratio | Bg Ratio | pvalue | p.adjust | qvalue | Count |
| hsa0520516 | Cervix | CC | Proteoglycans in cancer | 60/1267 | 205/8465 | 9.13e-08 | 1.18e-06 | 7.00e-07 | 60 |
| hsa0451010 | Cervix | CC | Focal adhesion | 59/1267 | 203/8465 | 1.53e-07 | 1.84e-06 | 1.09e-06 | 59 |
| hsa0452020 | Cervix | CC | Adherens junction | 33/1267 | 93/8465 | 6.99e-07 | 7.31e-06 | 4.32e-06 | 33 |
| hsa0401512 | Cervix | CC | Rap1 signaling pathway | 56/1267 | 210/8465 | 6.23e-06 | 5.61e-05 | 3.32e-05 | 56 |
| hsa0414418 | Cervix | CC | Endocytosis | 64/1267 | 251/8465 | 6.97e-06 | 6.10e-05 | 3.61e-05 | 64 |
| hsa052148 | Cervix | CC | Glioma | 24/1267 | 75/8465 | 1.51e-04 | 9.20e-04 | 5.44e-04 | 24 |
| hsa015223 | Cervix | CC | Endocrine resistance | 28/1267 | 98/8465 | 3.82e-04 | 1.87e-03 | 1.11e-03 | 28 |
| hsa052157 | Cervix | CC | Prostate cancer | 27/1267 | 97/8465 | 7.54e-04 | 3.39e-03 | 2.01e-03 | 27 |
| hsa0522510 | Cervix | CC | Hepatocellular carcinoma | 40/1267 | 168/8465 | 1.52e-03 | 6.39e-03 | 3.78e-03 | 40 |
| hsa040142 | Cervix | CC | Ras signaling pathway | 51/1267 | 236/8465 | 3.55e-03 | 1.34e-02 | 7.91e-03 | 51 |
| hsa0406618 | Cervix | CC | HIF-1 signaling pathway | 27/1267 | 109/8465 | 4.72e-03 | 1.64e-02 | 9.72e-03 | 27 |
| hsa040109 | Cervix | CC | MAPK signaling pathway | 62/1267 | 302/8465 | 4.89e-03 | 1.67e-02 | 9.86e-03 | 62 |
| hsa05224 | Cervix | CC | Breast cancer | 32/1267 | 147/8465 | 1.66e-02 | 4.88e-02 | 2.88e-02 | 32 |
| hsa0520517 | Cervix | CC | Proteoglycans in cancer | 60/1267 | 205/8465 | 9.13e-08 | 1.18e-06 | 7.00e-07 | 60 |
| hsa0451014 | Cervix | CC | Focal adhesion | 59/1267 | 203/8465 | 1.53e-07 | 1.84e-06 | 1.09e-06 | 59 |
| hsa04520110 | Cervix | CC | Adherens junction | 33/1267 | 93/8465 | 6.99e-07 | 7.31e-06 | 4.32e-06 | 33 |
| hsa0401513 | Cervix | CC | Rap1 signaling pathway | 56/1267 | 210/8465 | 6.23e-06 | 5.61e-05 | 3.32e-05 | 56 |
| hsa0414419 | Cervix | CC | Endocytosis | 64/1267 | 251/8465 | 6.97e-06 | 6.10e-05 | 3.61e-05 | 64 |
| hsa0521414 | Cervix | CC | Glioma | 24/1267 | 75/8465 | 1.51e-04 | 9.20e-04 | 5.44e-04 | 24 |
| hsa0152212 | Cervix | CC | Endocrine resistance | 28/1267 | 98/8465 | 3.82e-04 | 1.87e-03 | 1.11e-03 | 28 |
| Page: 1 2 3 4 5 6 7 8 9 10 11 12 13 14 15 16 17 18 19 20 21 22 23 24 |
Top |
Cell-cell communication analysis |
| Identification of potential cell-cell interactions between two cell types and their ligand-receptor pairs for different disease states |
| Ligand | Receptor | LRpair | Pathway | Tissue | Disease Stage |
| IGF1 | IGF1R | IGF1_IGF1R | IGF | Breast | ADJ |
| IGF1 | IGF1R | IGF1_IGF1R | IGF | Breast | DCIS |
| IGF1 | IGF1R | IGF1_IGF1R | IGF | Cervix | ADJ |
| IGF1 | IGF1R | IGF1_IGF1R | IGF | Cervix | CC |
| IGF1 | IGF1R | IGF1_IGF1R | IGF | Cervix | Healthy |
| IGF1 | IGF1R | IGF1_IGF1R | IGF | Cervix | Precancer |
| IGF1 | IGF1R | IGF1_IGF1R | IGF | CRC | ADJ |
| IGF1 | IGF1R | IGF1_IGF1R | IGF | CRC | CRC |
| IGF1 | IGF1R | IGF1_IGF1R | IGF | CRC | FAP |
| IGF2 | IGF1R | IGF2_IGF1R | IGF | CRC | MSS |
| IGF1 | IGF1R | IGF1_IGF1R | IGF | Endometrium | ADJ |
| IGF1 | IGF1R | IGF1_IGF1R | IGF | Endometrium | AEH |
| IGF1 | IGF1R | IGF1_IGF1R | IGF | Endometrium | EEC |
| IGF1 | IGF1R | IGF1_IGF1R | IGF | Endometrium | Healthy |
| IGF2 | IGF1R | IGF2_IGF1R | IGF | Endometrium | Healthy |
| IGF1 | IGF1R | IGF1_IGF1R | IGF | Esophagus | ESCC |
| IGF2 | IGF1R | IGF2_IGF1R | IGF | Esophagus | ESCC |
| IGF1 | IGF1R | IGF1_IGF1R | IGF | GC | ADJ |
| IGF1 | IGF1R | IGF1_IGF1R | IGF | HNSCC | OSCC |
| IGF2 | IGF1R | IGF2_IGF1R | IGF | HNSCC | OSCC |
| Page: 1 |
Top |
Single-cell gene regulatory network inference analysis |
| Find out the significant the regulons (TFs) and the target genes of each regulon across cell types for different disease states |
| TF | Cell Type | Tissue | Disease Stage | Target Gene | RSS | Regulon Activity |
| ∗The dot plots of a searched regulon are shown for all cell subpopulations in each disease state of each tissue based on the regulon specific score inferred using pySCENIC and by calculating the average expression. |
| Page: 1 |
Top |
Somatic mutation of malignant transformation related genes |
| Annotation of somatic variants for genes involved in malignant transformation |
| Hugo Symbol | Variant Class | Variant Classification | dbSNP RS | HGVSc | HGVSp | HGVSp Short | SWISSPROT | BIOTYPE | SIFT | PolyPhen | Tumor Sample Barcode | Tissue | Histology | Sex | Age | Stage | Therapy Types | Drugs | Outcome |
| IGF1R | SNV | Missense_Mutation | novel | c.899A>G | p.Asp300Gly | p.D300G | P08069 | protein_coding | tolerated(0.34) | benign(0.001) | TCGA-3C-AALI-01 | Breast | breast invasive carcinoma | Female | <65 | I/II | Unspecific | Poly E | Complete Response |
| IGF1R | SNV | Missense_Mutation | c.199N>T | p.Ala67Ser | p.A67S | P08069 | protein_coding | tolerated(0.14) | benign(0.011) | TCGA-A2-A25C-01 | Breast | breast invasive carcinoma | Female | <65 | I/II | Chemotherapy | taxotere | SD | |
| IGF1R | SNV | Missense_Mutation | c.55C>G | p.Leu19Val | p.L19V | P08069 | protein_coding | tolerated(0.29) | benign(0.001) | TCGA-AC-A23H-01 | Breast | breast invasive carcinoma | Female | >=65 | I/II | Unknown | Unknown | PD | |
| IGF1R | SNV | Missense_Mutation | c.2431G>C | p.Glu811Gln | p.E811Q | P08069 | protein_coding | tolerated(0.7) | benign(0.001) | TCGA-AC-A23H-01 | Breast | breast invasive carcinoma | Female | >=65 | I/II | Unknown | Unknown | PD | |
| IGF1R | SNV | Missense_Mutation | novel | c.3131G>T | p.Arg1044Met | p.R1044M | P08069 | protein_coding | deleterious(0) | probably_damaging(0.999) | TCGA-AN-A0AK-01 | Breast | breast invasive carcinoma | Female | >=65 | I/II | Unknown | Unknown | SD |
| IGF1R | SNV | Missense_Mutation | c.1099N>T | p.Gly367Trp | p.G367W | P08069 | protein_coding | deleterious(0) | probably_damaging(1) | TCGA-AN-A0AM-01 | Breast | breast invasive carcinoma | Female | <65 | I/II | Unknown | Unknown | SD | |
| IGF1R | SNV | Missense_Mutation | c.3003N>A | p.Met1001Ile | p.M1001I | P08069 | protein_coding | tolerated(0.44) | benign(0.007) | TCGA-AN-A0XW-01 | Breast | breast invasive carcinoma | Female | <65 | III/IV | Unknown | Unknown | SD | |
| IGF1R | SNV | Missense_Mutation | novel | c.2026N>T | p.Gly676Cys | p.G676C | P08069 | protein_coding | tolerated(0.08) | benign(0.01) | TCGA-AR-A0U2-01 | Breast | breast invasive carcinoma | Female | <65 | III/IV | Hormone Therapy | tamoxiphen | PD |
| IGF1R | SNV | Missense_Mutation | c.1828G>A | p.Val610Ile | p.V610I | P08069 | protein_coding | tolerated(0.09) | benign(0.009) | TCGA-BH-A0C3-01 | Breast | breast invasive carcinoma | Female | <65 | I/II | Chemotherapy | adriamycin | PD | |
| IGF1R | SNV | Missense_Mutation | novel | c.3938C>T | p.Ser1313Phe | p.S1313F | P08069 | protein_coding | tolerated(0.06) | possibly_damaging(0.474) | TCGA-BH-A0HF-01 | Breast | breast invasive carcinoma | Female | >=65 | I/II | Hormone Therapy | arimidex | SD |
| Page: 1 2 3 4 5 6 7 8 9 10 11 12 13 14 |
Top |
Related drugs of malignant transformation related genes |
| Identification of chemicals and drugs interact with genes involved in malignant transfromation |
| (DGIdb 4.0) |
| Entrez ID | Symbol | Category | Interaction Types | Drug Claim Name | Drug Name | PMIDs |
| 3480 | IGF1R | DRUGGABLE GENOME, KINASE, CLINICALLY ACTIONABLE, TYROSINE KINASE | OSI-906 | LINSITINIB | ||
| 3480 | IGF1R | DRUGGABLE GENOME, KINASE, CLINICALLY ACTIONABLE, TYROSINE KINASE | antibody | AMG-479 | GANITUMAB | |
| 3480 | IGF1R | DRUGGABLE GENOME, KINASE, CLINICALLY ACTIONABLE, TYROSINE KINASE | VPI-2690B | |||
| 3480 | IGF1R | DRUGGABLE GENOME, KINASE, CLINICALLY ACTIONABLE, TYROSINE KINASE | Somatomedin-1 | |||
| 3480 | IGF1R | DRUGGABLE GENOME, KINASE, CLINICALLY ACTIONABLE, TYROSINE KINASE | SB-202190 | SB-202190 | ||
| 3480 | IGF1R | DRUGGABLE GENOME, KINASE, CLINICALLY ACTIONABLE, TYROSINE KINASE | antibody | GANITUMAB | GANITUMAB | |
| 3480 | IGF1R | DRUGGABLE GENOME, KINASE, CLINICALLY ACTIONABLE, TYROSINE KINASE | antibody | FIGITUMUMAB | FIGITUMUMAB | |
| 3480 | IGF1R | DRUGGABLE GENOME, KINASE, CLINICALLY ACTIONABLE, TYROSINE KINASE | antibody | 310264711 | ISTIRATUMAB | |
| 3480 | IGF1R | DRUGGABLE GENOME, KINASE, CLINICALLY ACTIONABLE, TYROSINE KINASE | TT-100 | |||
| 3480 | IGF1R | DRUGGABLE GENOME, KINASE, CLINICALLY ACTIONABLE, TYROSINE KINASE | agonist | CHEMBL1201716 | MECASERMIN |
| Page: 1 2 3 4 5 6 7 8 9 10 11 |

Copyright 2023-Present -The University of Texas Health Science Center at Houston |