
|
|||||
|
 | |
| |
| |
| |
| |
| |
|
Gene: IGF1 |
Gene summary for IGF1 |
| Gene information | Species | Human | Gene symbol | IGF1 | Gene ID | 3479 |
| Gene name | insulin like growth factor 1 | |
| Gene Alias | IGF | |
| Cytomap | 12q23.2 | |
| Gene Type | protein-coding | GO ID | GO:0000003 | UniProtAcc | P05019 |
Top |
Malignant transformation analysis |
| Identification of the aberrant gene expression in precancerous and cancerous lesions by comparing the gene expression of stem-like cells in diseased tissues with normal stem cells |
| Entrez ID | Symbol | Replicates | Species | Organ | Tissue | Adj P-value | Log2FC | Malignancy |
| 3479 | IGF1 | AEH-subject1 | Human | Endometrium | AEH | 1.18e-60 | -1.23e+00 | -0.3059 |
| 3479 | IGF1 | AEH-subject2 | Human | Endometrium | AEH | 9.46e-51 | -1.18e+00 | -0.2525 |
| 3479 | IGF1 | AEH-subject3 | Human | Endometrium | AEH | 3.68e-41 | -1.06e+00 | -0.2576 |
| 3479 | IGF1 | AEH-subject4 | Human | Endometrium | AEH | 3.33e-12 | -6.66e-01 | -0.2657 |
| 3479 | IGF1 | AEH-subject5 | Human | Endometrium | AEH | 1.62e-50 | -1.16e+00 | -0.2953 |
| 3479 | IGF1 | EEC-subject1 | Human | Endometrium | EEC | 2.77e-55 | -1.19e+00 | -0.2682 |
| 3479 | IGF1 | EEC-subject2 | Human | Endometrium | EEC | 6.74e-64 | -1.24e+00 | -0.2607 |
| 3479 | IGF1 | EEC-subject3 | Human | Endometrium | EEC | 1.51e-53 | -1.18e+00 | -0.2525 |
| 3479 | IGF1 | EEC-subject4 | Human | Endometrium | EEC | 4.25e-58 | -1.18e+00 | -0.2571 |
| 3479 | IGF1 | EEC-subject5 | Human | Endometrium | EEC | 1.50e-34 | -9.40e-01 | -0.249 |
| 3479 | IGF1 | GSM5276934 | Human | Endometrium | EEC | 1.47e-27 | -8.51e-01 | -0.0913 |
| 3479 | IGF1 | GSM5276935 | Human | Endometrium | EEC | 3.28e-58 | -1.18e+00 | -0.123 |
| 3479 | IGF1 | GSM5276937 | Human | Endometrium | EEC | 2.94e-20 | -6.54e-01 | -0.0897 |
| 3479 | IGF1 | GSM6177620_NYU_UCEC1_lib1_lib1 | Human | Endometrium | EEC | 2.29e-27 | -8.63e-01 | -0.1869 |
| 3479 | IGF1 | GSM6177620_NYU_UCEC1_lib2_lib2 | Human | Endometrium | EEC | 6.41e-26 | -8.49e-01 | -0.1875 |
| 3479 | IGF1 | GSM6177620_NYU_UCEC1_lib3_lib3 | Human | Endometrium | EEC | 8.29e-34 | -9.11e-01 | -0.1883 |
| 3479 | IGF1 | GSM6177621_NYU_UCEC2_lib1_lib1 | Human | Endometrium | EEC | 3.00e-45 | -1.08e+00 | -0.1934 |
| 3479 | IGF1 | GSM6177622_NYU_UCEC3_lib1_lib1 | Human | Endometrium | EEC | 3.66e-67 | -1.24e+00 | -0.1917 |
| 3479 | IGF1 | GSM6177622_NYU_UCEC3_lib2_lib2 | Human | Endometrium | EEC | 6.20e-63 | -1.24e+00 | -0.1916 |
| 3479 | IGF1 | GSM6177623_NYU_UCEC3_Vis | Human | Endometrium | EEC | 5.35e-48 | -1.15e+00 | -0.1269 |
| Page: 1 2 |
| Tissue | Expression Dynamics | Abbreviation |
| Endometrium | 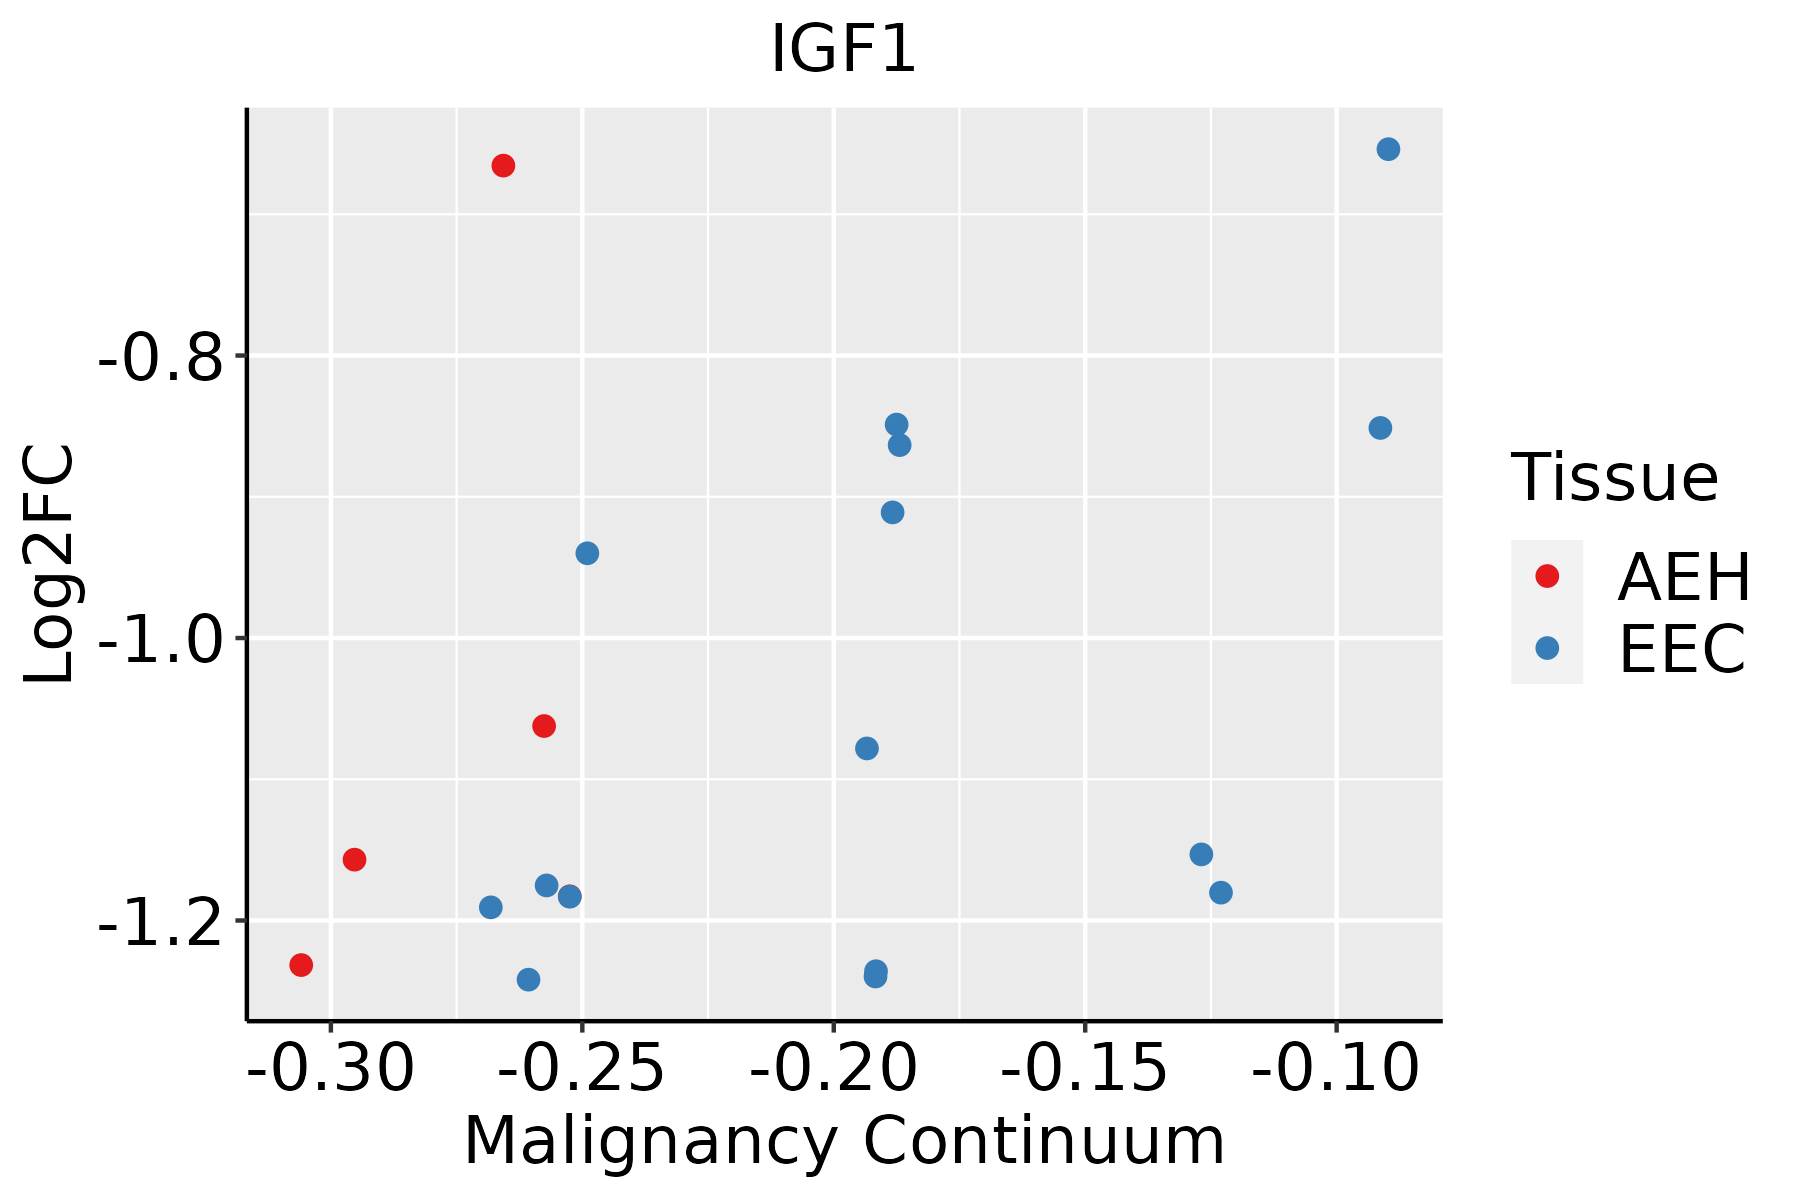 | AEH: Atypical endometrial hyperplasia |
| EEC: Endometrioid Cancer | ||
| Esophagus | 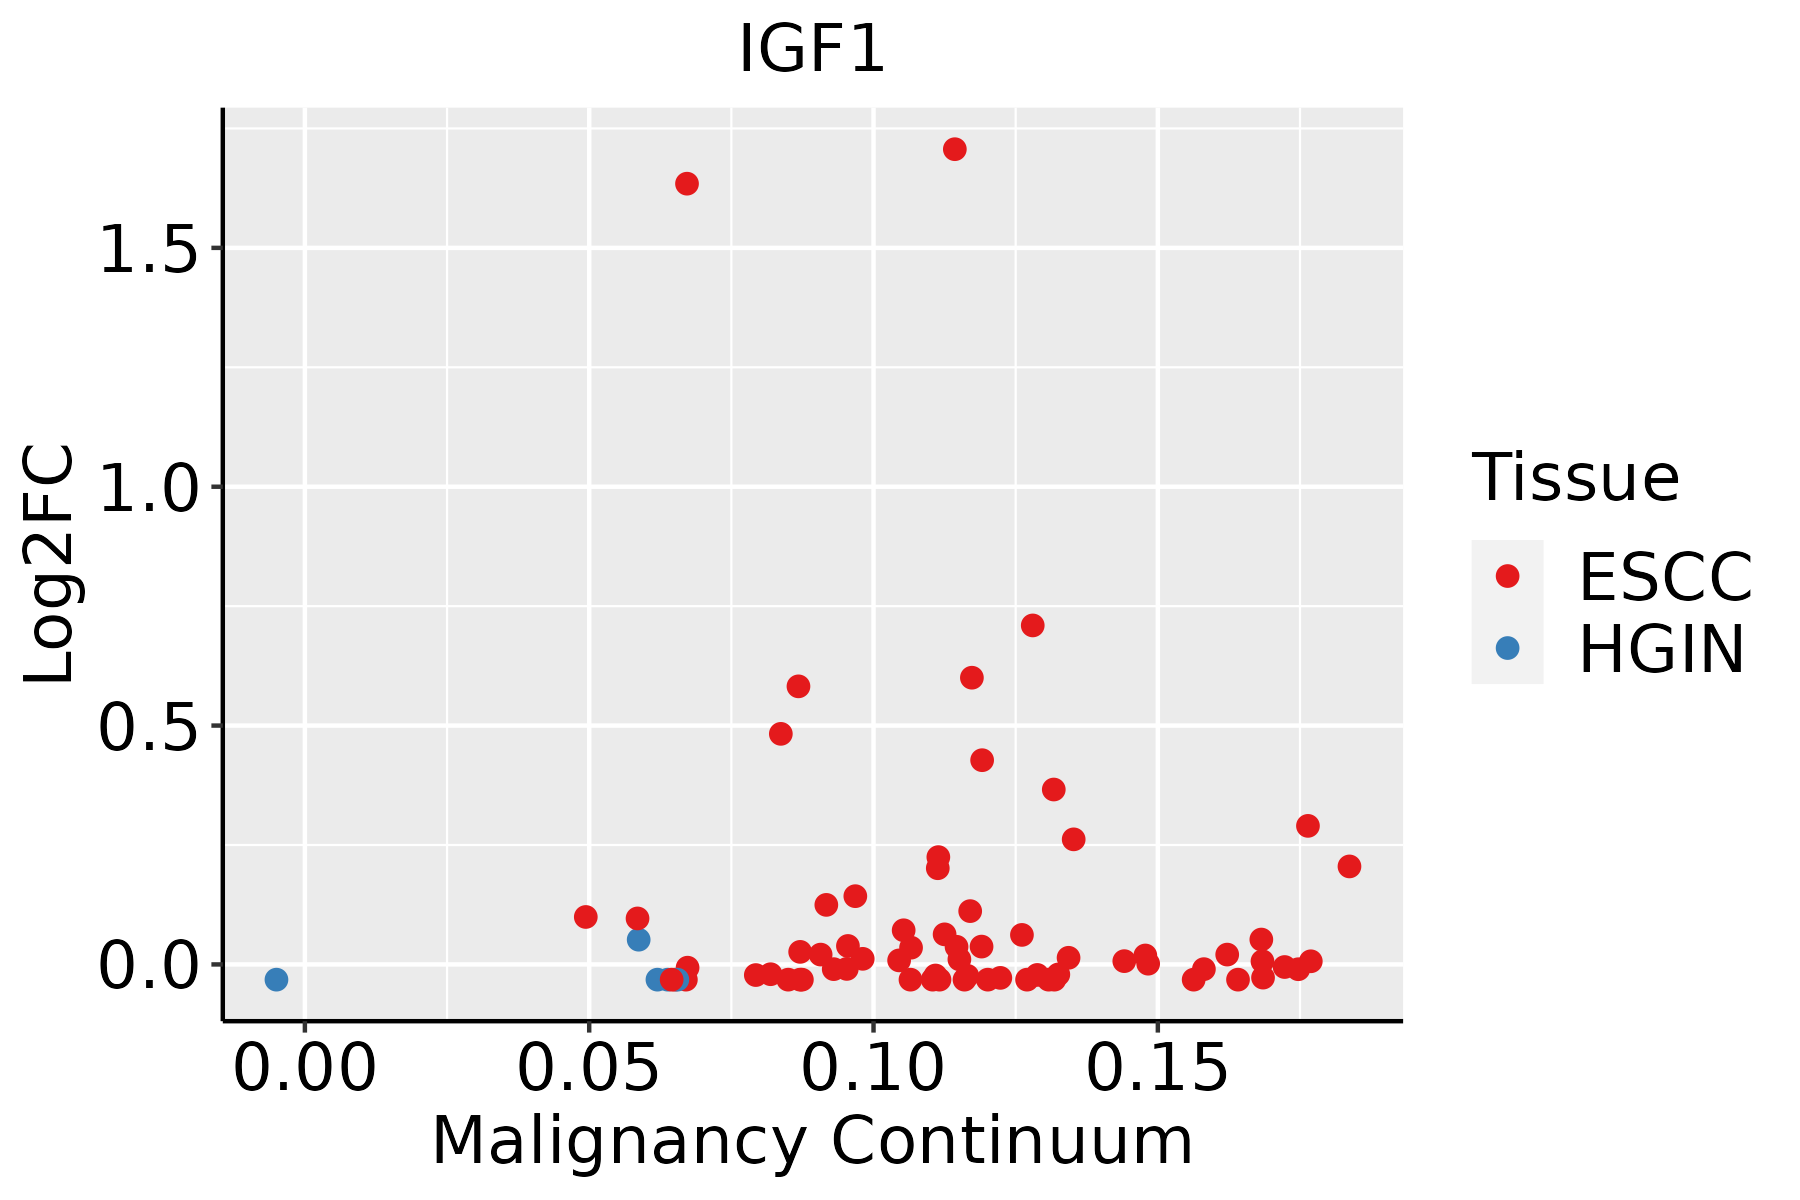 | ESCC: Esophageal squamous cell carcinoma |
| HGIN: High-grade intraepithelial neoplasias | ||
| LGIN: Low-grade intraepithelial neoplasias | ||
| Oral Cavity |  | EOLP: Erosive Oral lichen planus |
| LP: leukoplakia | ||
| NEOLP: Non-erosive oral lichen planus | ||
| OSCC: Oral squamous cell carcinoma | ||
| Prostate | 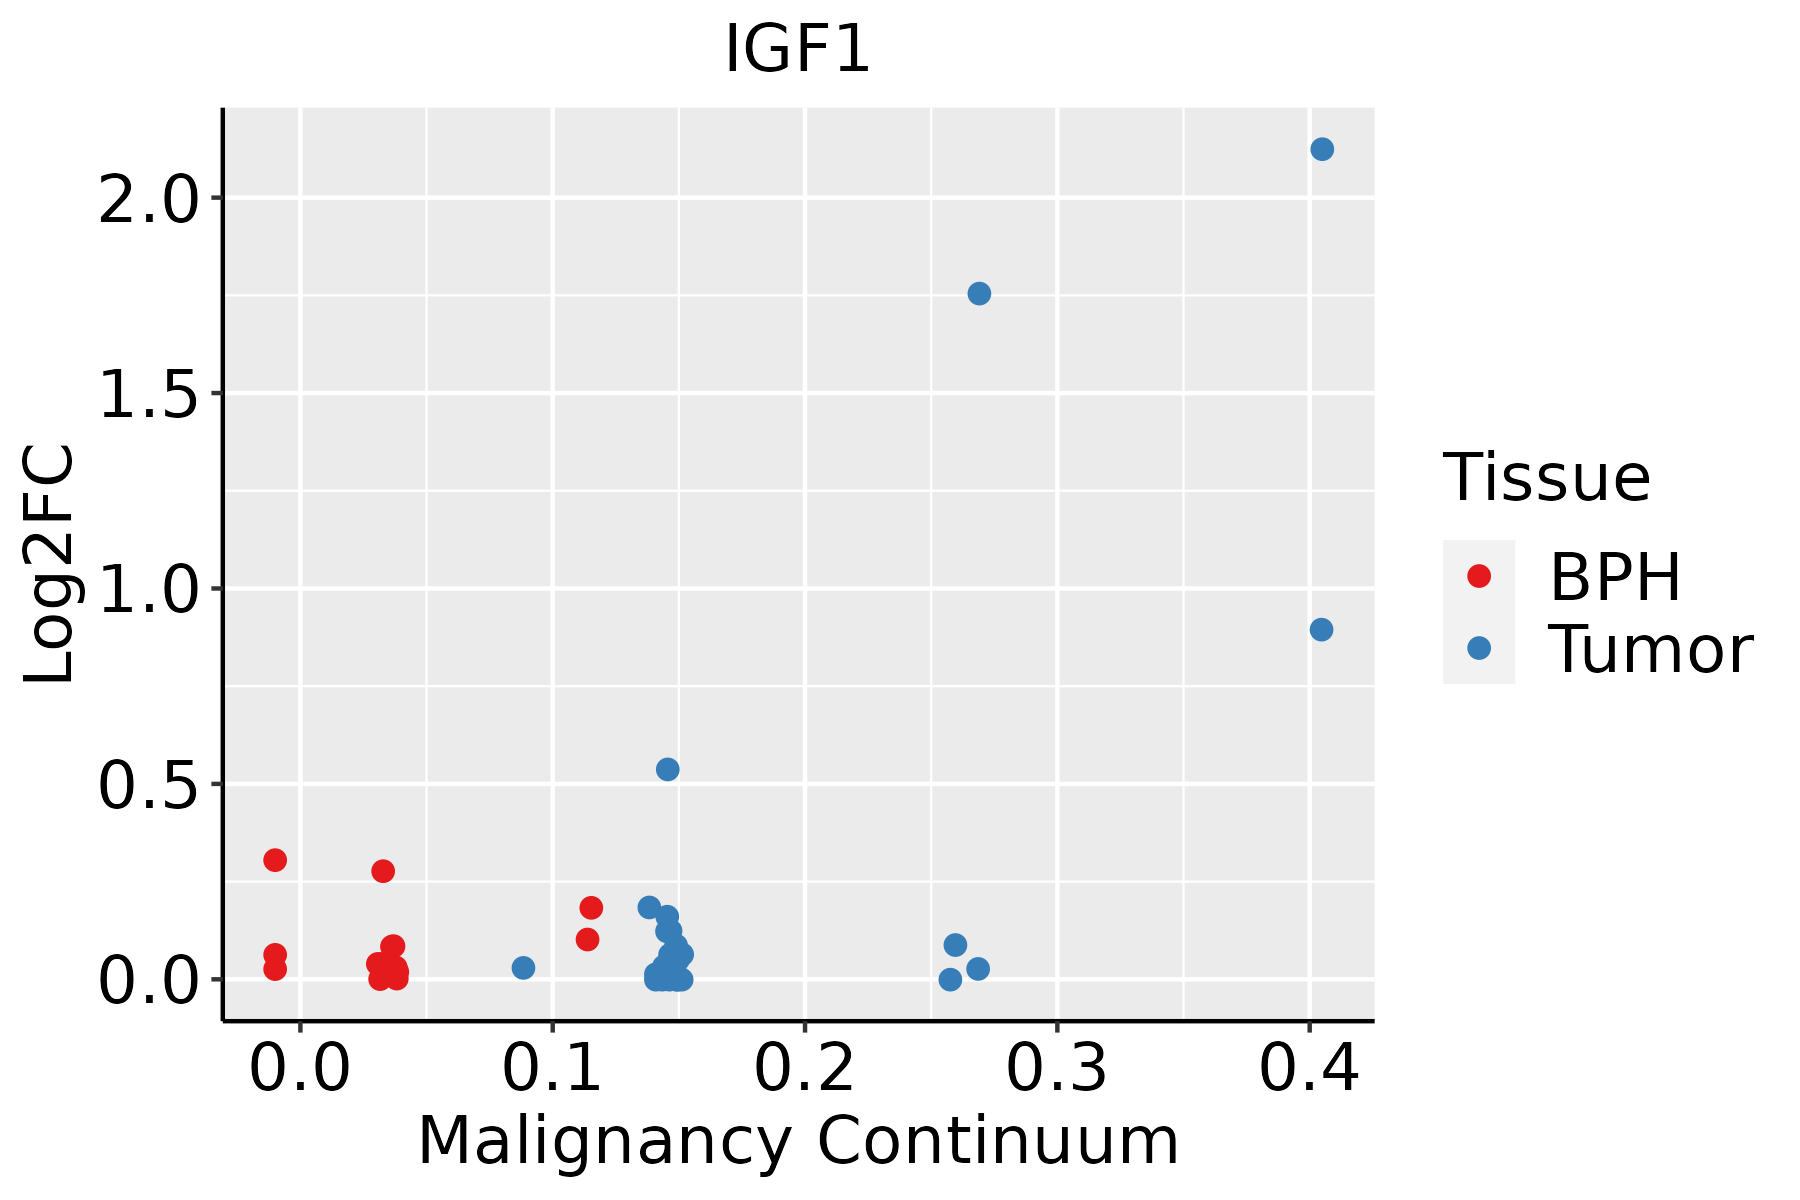 | BPH: Benign Prostatic Hyperplasia |
| Thyroid | 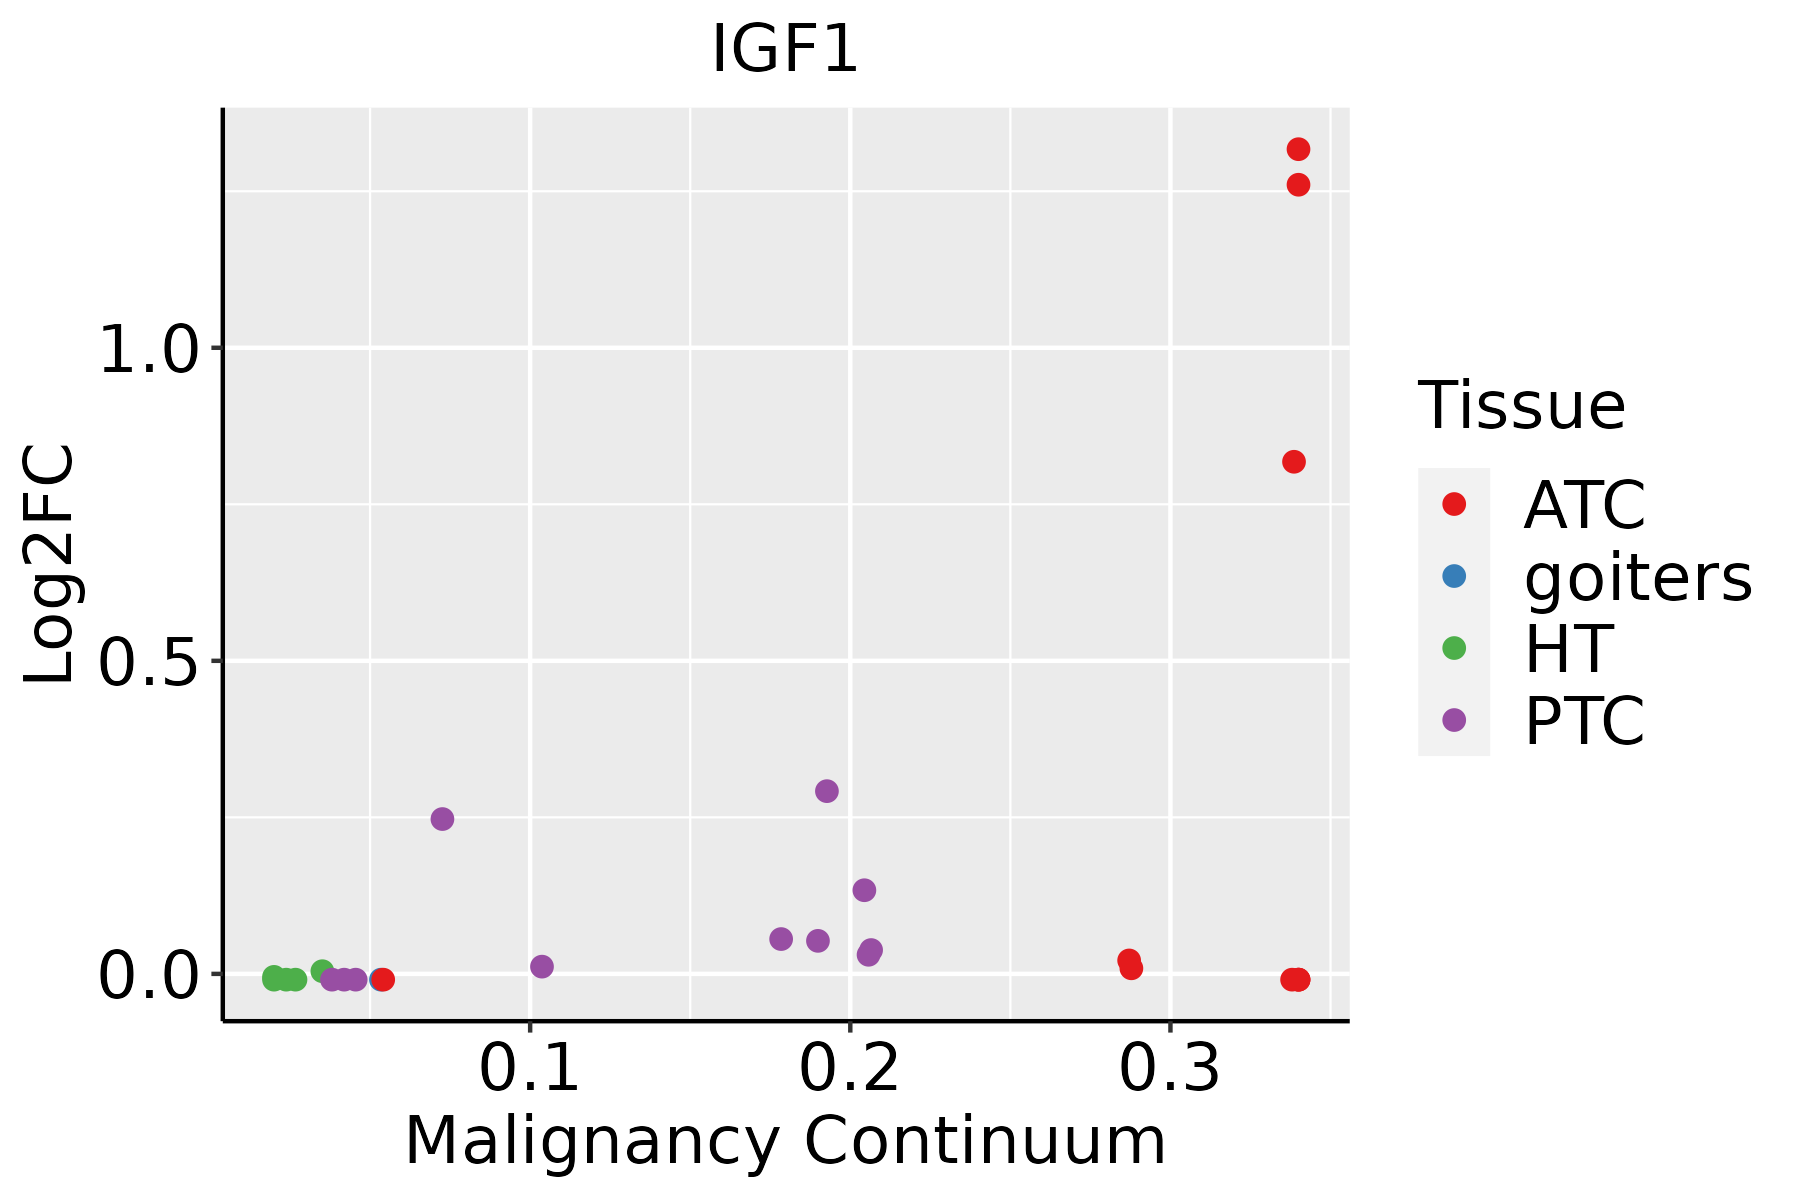 | ATC: Anaplastic thyroid cancer |
| HT: Hashimoto's thyroiditis | ||
| PTC: Papillary thyroid cancer |
| ∗log2FC in expression of this searched gene in stem-like cells from each diseased tissue sample relative to stem-like cells in normal samples in each tissue plotted against the malignancy continuum. Samples are colored based on if they are from different disease stage. |
Top |
Malignant transformation related pathway analysis |
| Find out the enriched GO biological processes and KEGG pathways involved in transition from healthy to precancer to cancer |
| Tissue | Disease Stage | Enriched GO biological Processes |
| Colorectum | AD |  |
| Colorectum | SER |  |
| Colorectum | MSS |  |
| Colorectum | MSI-H |  |
| Colorectum | FAP |  |
| ∗Top 15 enriched GO BP terms are showed in the bar plot of each disease state in each tissue. Each row represents a significant GO biological process which is colored according to the -log10(p.adjust). |
| Page: 1 2 3 4 5 6 7 8 9 |
| GO ID | Tissue | Disease Stage | Description | Gene Ratio | Bg Ratio | pvalue | p.adjust | Count |
| GO:003367410 | Cervix | CC | positive regulation of kinase activity | 101/2311 | 467/18723 | 8.66e-09 | 7.22e-07 | 101 |
| GO:00310988 | Cervix | CC | stress-activated protein kinase signaling cascade | 58/2311 | 247/18723 | 8.02e-07 | 2.89e-05 | 58 |
| GO:00514038 | Cervix | CC | stress-activated MAPK cascade | 55/2311 | 239/18723 | 2.96e-06 | 8.31e-05 | 55 |
| GO:00703027 | Cervix | CC | regulation of stress-activated protein kinase signaling cascade | 46/2311 | 195/18723 | 9.35e-06 | 2.11e-04 | 46 |
| GO:19016538 | Cervix | CC | cellular response to peptide | 72/2311 | 359/18723 | 1.89e-05 | 3.48e-04 | 72 |
| GO:00434104 | Cervix | CC | positive regulation of MAPK cascade | 90/2311 | 480/18723 | 2.92e-05 | 4.83e-04 | 90 |
| GO:00328727 | Cervix | CC | regulation of stress-activated MAPK cascade | 44/2311 | 192/18723 | 3.09e-05 | 5.10e-04 | 44 |
| GO:002241110 | Cervix | CC | cellular component disassembly | 83/2311 | 443/18723 | 6.04e-05 | 8.68e-04 | 83 |
| GO:000974310 | Cervix | CC | response to carbohydrate | 53/2311 | 253/18723 | 7.02e-05 | 9.85e-04 | 53 |
| GO:003428410 | Cervix | CC | response to monosaccharide | 48/2311 | 225/18723 | 9.48e-05 | 1.25e-03 | 48 |
| GO:00434349 | Cervix | CC | response to peptide hormone | 77/2311 | 414/18723 | 1.40e-04 | 1.70e-03 | 77 |
| GO:00713757 | Cervix | CC | cellular response to peptide hormone stimulus | 57/2311 | 290/18723 | 2.32e-04 | 2.59e-03 | 57 |
| GO:000974610 | Cervix | CC | response to hexose | 45/2311 | 219/18723 | 3.73e-04 | 3.86e-03 | 45 |
| GO:00328698 | Cervix | CC | cellular response to insulin stimulus | 42/2311 | 203/18723 | 4.95e-04 | 4.83e-03 | 42 |
| GO:00518964 | Cervix | CC | regulation of protein kinase B signaling | 39/2311 | 185/18723 | 5.25e-04 | 5.10e-03 | 39 |
| GO:00518973 | Cervix | CC | positive regulation of protein kinase B signaling | 28/2311 | 120/18723 | 5.90e-04 | 5.59e-03 | 28 |
| GO:00434913 | Cervix | CC | protein kinase B signaling | 43/2311 | 211/18723 | 5.95e-04 | 5.60e-03 | 43 |
| GO:00425939 | Cervix | CC | glucose homeostasis | 50/2311 | 258/18723 | 7.57e-04 | 6.76e-03 | 50 |
| GO:00335009 | Cervix | CC | carbohydrate homeostasis | 50/2311 | 259/18723 | 8.28e-04 | 7.22e-03 | 50 |
| GO:00016788 | Cervix | CC | cellular glucose homeostasis | 36/2311 | 172/18723 | 9.65e-04 | 8.09e-03 | 36 |
| Page: 1 2 3 4 5 6 7 8 9 10 11 12 13 14 15 16 17 18 19 20 21 22 23 24 25 26 27 28 29 30 31 32 33 34 35 36 37 38 39 40 41 42 43 44 45 46 47 48 49 50 51 52 53 54 55 56 57 58 59 60 61 62 63 64 65 66 67 68 69 70 71 72 73 74 75 76 77 78 79 80 81 82 83 84 85 86 87 88 89 |
| Pathway ID | Tissue | Disease Stage | Description | Gene Ratio | Bg Ratio | pvalue | p.adjust | qvalue | Count |
| hsa0451015 | Endometrium | AEH | Focal adhesion | 58/1197 | 203/8465 | 4.99e-08 | 7.37e-07 | 5.39e-07 | 58 |
| hsa0520518 | Endometrium | AEH | Proteoglycans in cancer | 53/1197 | 205/8465 | 5.43e-06 | 6.53e-05 | 4.78e-05 | 53 |
| hsa0401514 | Endometrium | AEH | Rap1 signaling pathway | 49/1197 | 210/8465 | 2.03e-04 | 1.78e-03 | 1.30e-03 | 49 |
| hsa0406620 | Endometrium | AEH | HIF-1 signaling pathway | 29/1197 | 109/8465 | 4.23e-04 | 3.11e-03 | 2.27e-03 | 29 |
| hsa052158 | Endometrium | AEH | Prostate cancer | 25/1197 | 97/8465 | 1.68e-03 | 1.01e-02 | 7.39e-03 | 25 |
| hsa0451016 | Endometrium | AEH | Focal adhesion | 58/1197 | 203/8465 | 4.99e-08 | 7.37e-07 | 5.39e-07 | 58 |
| hsa0520519 | Endometrium | AEH | Proteoglycans in cancer | 53/1197 | 205/8465 | 5.43e-06 | 6.53e-05 | 4.78e-05 | 53 |
| hsa0401515 | Endometrium | AEH | Rap1 signaling pathway | 49/1197 | 210/8465 | 2.03e-04 | 1.78e-03 | 1.30e-03 | 49 |
| hsa04066110 | Endometrium | AEH | HIF-1 signaling pathway | 29/1197 | 109/8465 | 4.23e-04 | 3.11e-03 | 2.27e-03 | 29 |
| hsa0521513 | Endometrium | AEH | Prostate cancer | 25/1197 | 97/8465 | 1.68e-03 | 1.01e-02 | 7.39e-03 | 25 |
| hsa0451024 | Endometrium | EEC | Focal adhesion | 58/1237 | 203/8465 | 1.61e-07 | 2.30e-06 | 1.71e-06 | 58 |
| hsa0520524 | Endometrium | EEC | Proteoglycans in cancer | 52/1237 | 205/8465 | 3.01e-05 | 3.19e-04 | 2.38e-04 | 52 |
| hsa0401522 | Endometrium | EEC | Rap1 signaling pathway | 49/1237 | 210/8465 | 4.45e-04 | 3.47e-03 | 2.59e-03 | 49 |
| hsa0406624 | Endometrium | EEC | HIF-1 signaling pathway | 29/1237 | 109/8465 | 7.33e-04 | 5.13e-03 | 3.82e-03 | 29 |
| hsa0521522 | Endometrium | EEC | Prostate cancer | 25/1237 | 97/8465 | 2.66e-03 | 1.56e-02 | 1.16e-02 | 25 |
| hsa0451034 | Endometrium | EEC | Focal adhesion | 58/1237 | 203/8465 | 1.61e-07 | 2.30e-06 | 1.71e-06 | 58 |
| hsa0520534 | Endometrium | EEC | Proteoglycans in cancer | 52/1237 | 205/8465 | 3.01e-05 | 3.19e-04 | 2.38e-04 | 52 |
| hsa0401532 | Endometrium | EEC | Rap1 signaling pathway | 49/1237 | 210/8465 | 4.45e-04 | 3.47e-03 | 2.59e-03 | 49 |
| hsa0406634 | Endometrium | EEC | HIF-1 signaling pathway | 29/1237 | 109/8465 | 7.33e-04 | 5.13e-03 | 3.82e-03 | 29 |
| hsa0521532 | Endometrium | EEC | Prostate cancer | 25/1237 | 97/8465 | 2.66e-03 | 1.56e-02 | 1.16e-02 | 25 |
| Page: 1 2 3 4 5 6 7 |
Top |
Cell-cell communication analysis |
| Identification of potential cell-cell interactions between two cell types and their ligand-receptor pairs for different disease states |
| Ligand | Receptor | LRpair | Pathway | Tissue | Disease Stage |
| IGF1 | IGF1R | IGF1_IGF1R | IGF | Breast | ADJ |
| IGF1 | IGF1R | IGF1_IGF1R | IGF | Breast | DCIS |
| IGF1 | ITGA6_ITGB4 | IGF1_ITGA6_ITGB4 | IGF | Breast | DCIS |
| IGF1 | IGF1R | IGF1_IGF1R | IGF | Cervix | ADJ |
| IGF1 | ITGA6_ITGB4 | IGF1_ITGA6_ITGB4 | IGF | Cervix | ADJ |
| IGF1 | IGF1R | IGF1_IGF1R | IGF | Cervix | CC |
| IGF1 | ITGA6_ITGB4 | IGF1_ITGA6_ITGB4 | IGF | Cervix | CC |
| IGF1 | IGF1R | IGF1_IGF1R | IGF | Cervix | Healthy |
| IGF1 | ITGA6_ITGB4 | IGF1_ITGA6_ITGB4 | IGF | Cervix | Healthy |
| IGF1 | IGF1R | IGF1_IGF1R | IGF | Cervix | Precancer |
| IGF1 | ITGA6_ITGB4 | IGF1_ITGA6_ITGB4 | IGF | Cervix | Precancer |
| IGF1 | IGF1R | IGF1_IGF1R | IGF | CRC | ADJ |
| IGF1 | ITGA6_ITGB4 | IGF1_ITGA6_ITGB4 | IGF | CRC | ADJ |
| IGF1 | IGF1R | IGF1_IGF1R | IGF | CRC | CRC |
| IGF1 | ITGA6_ITGB4 | IGF1_ITGA6_ITGB4 | IGF | CRC | CRC |
| IGF1 | IGF1R | IGF1_IGF1R | IGF | CRC | FAP |
| IGF1 | ITGA6_ITGB4 | IGF1_ITGA6_ITGB4 | IGF | CRC | FAP |
| IGF2 | IGF1R | IGF2_IGF1R | IGF | CRC | MSS |
| IGF1 | IGF1R | IGF1_IGF1R | IGF | Endometrium | ADJ |
| IGF1 | IGF1R | IGF1_IGF1R | IGF | Endometrium | AEH |
| Page: 1 2 3 |
Top |
Single-cell gene regulatory network inference analysis |
| Find out the significant the regulons (TFs) and the target genes of each regulon across cell types for different disease states |
| TF | Cell Type | Tissue | Disease Stage | Target Gene | RSS | Regulon Activity |
| ∗The dot plots of a searched regulon are shown for all cell subpopulations in each disease state of each tissue based on the regulon specific score inferred using pySCENIC and by calculating the average expression. |
| Page: 1 |
Top |
Somatic mutation of malignant transformation related genes |
| Annotation of somatic variants for genes involved in malignant transformation |
| Hugo Symbol | Variant Class | Variant Classification | dbSNP RS | HGVSc | HGVSp | HGVSp Short | SWISSPROT | BIOTYPE | SIFT | PolyPhen | Tumor Sample Barcode | Tissue | Histology | Sex | Age | Stage | Therapy Types | Drugs | Outcome |
| IGF1 | SNV | Missense_Mutation | novel | c.71N>C | p.Met24Thr | p.M24T | P05019 | protein_coding | deleterious(0) | benign(0.024) | TCGA-2W-A8YY-01 | Cervix | cervical & endocervical cancer | Female | <65 | I/II | Chemotherapy | cisplatin | CR |
| IGF1 | SNV | Missense_Mutation | rs367603396 | c.470N>A | p.Arg157His | p.R157H | P05019 | protein_coding | tolerated_low_confidence(0.28) | benign(0) | TCGA-AA-3984-01 | Colorectum | colon adenocarcinoma | Female | <65 | I/II | Unknown | Unknown | SD |
| IGF1 | SNV | Missense_Mutation | novel | c.133T>G | p.Ser45Ala | p.S45A | P05019 | protein_coding | tolerated(0.7) | benign(0.05) | TCGA-CM-4746-01 | Colorectum | colon adenocarcinoma | Male | <65 | I/II | Unknown | Unknown | SD |
| IGF1 | SNV | Missense_Mutation | c.394N>G | p.Thr132Ala | p.T132A | P05019 | protein_coding | tolerated(1) | benign(0) | TCGA-D5-6535-01 | Colorectum | colon adenocarcinoma | Female | >=65 | III/IV | Unknown | Unknown | SD | |
| IGF1 | SNV | Missense_Mutation | novel | c.157C>T | p.Leu53Phe | p.L53F | P05019 | protein_coding | deleterious(0) | probably_damaging(0.989) | TCGA-EI-6917-01 | Colorectum | rectum adenocarcinoma | Male | <65 | III/IV | Chemotherapy | 5fluorouracil+oxaciplatina+l-folinian | SD |
| IGF1 | SNV | Missense_Mutation | c.364C>T | p.Arg122Cys | p.R122C | P05019 | protein_coding | deleterious(0) | probably_damaging(0.997) | TCGA-A5-A0G2-01 | Endometrium | uterine corpus endometrioid carcinoma | Female | <65 | III/IV | Unknown | Unknown | SD | |
| IGF1 | SNV | Missense_Mutation | c.57N>A | p.Phe19Leu | p.F19L | P05019 | protein_coding | tolerated(0.37) | benign(0.009) | TCGA-A5-A2K5-01 | Endometrium | uterine corpus endometrioid carcinoma | Female | >=65 | I/II | Unknown | Unknown | SD | |
| IGF1 | SNV | Missense_Mutation | c.408N>T | p.Gln136His | p.Q136H | P05019 | protein_coding | tolerated(0.41) | benign(0) | TCGA-AP-A059-01 | Endometrium | uterine corpus endometrioid carcinoma | Female | >=65 | I/II | Unknown | Unknown | SD | |
| IGF1 | SNV | Missense_Mutation | c.167N>A | p.Ala56Asp | p.A56D | P05019 | protein_coding | deleterious(0) | possibly_damaging(0.841) | TCGA-AX-A0J0-01 | Endometrium | uterine corpus endometrioid carcinoma | Female | <65 | I/II | Unknown | Unknown | SD | |
| IGF1 | SNV | Missense_Mutation | c.57N>A | p.Phe19Leu | p.F19L | P05019 | protein_coding | tolerated(0.37) | benign(0.009) | TCGA-BS-A0TC-01 | Endometrium | uterine corpus endometrioid carcinoma | Female | >=65 | I/II | Unknown | Unknown | SD |
| Page: 1 2 3 |
Top |
Related drugs of malignant transformation related genes |
| Identification of chemicals and drugs interact with genes involved in malignant transfromation |
| (DGIdb 4.0) |
| Entrez ID | Symbol | Category | Interaction Types | Drug Claim Name | Drug Name | PMIDs |
| 3479 | IGF1 | GROWTH FACTOR, HORMONE ACTIVITY, CLINICALLY ACTIONABLE, DRUGGABLE GENOME, KINASE | BI-836845 | XENTUZUMAB | ||
| 3479 | IGF1 | GROWTH FACTOR, HORMONE ACTIVITY, CLINICALLY ACTIONABLE, DRUGGABLE GENOME, KINASE | Xentuzumab | XENTUZUMAB | ||
| 3479 | IGF1 | GROWTH FACTOR, HORMONE ACTIVITY, CLINICALLY ACTIONABLE, DRUGGABLE GENOME, KINASE | inhibitor | CHEMBL2109355 | DUSIGITUMAB | |
| 3479 | IGF1 | GROWTH FACTOR, HORMONE ACTIVITY, CLINICALLY ACTIONABLE, DRUGGABLE GENOME, KINASE | NNZ-2566 | |||
| 3479 | IGF1 | GROWTH FACTOR, HORMONE ACTIVITY, CLINICALLY ACTIONABLE, DRUGGABLE GENOME, KINASE | RECOMBINANT HUMAN INSULIN-LIKE GROWTH FACTOR BINDING PROTEIN-3 | |||
| 3479 | IGF1 | GROWTH FACTOR, HORMONE ACTIVITY, CLINICALLY ACTIONABLE, DRUGGABLE GENOME, KINASE | MEDI-573 | DUSIGITUMAB |
| Page: 1 |

Copyright 2023-Present -The University of Texas Health Science Center at Houston |