
|
|||||
|
 | |
| |
| |
| |
| |
| |
|
Gene: IGBP1 |
Gene summary for IGBP1 |
| Gene information | Species | Human | Gene symbol | IGBP1 | Gene ID | 3476 |
| Gene name | immunoglobulin binding protein 1 | |
| Gene Alias | ALPHA-4 | |
| Cytomap | Xq13.1 | |
| Gene Type | protein-coding | GO ID | GO:0000122 | UniProtAcc | P78318 |
Top |
Malignant transformation analysis |
| Identification of the aberrant gene expression in precancerous and cancerous lesions by comparing the gene expression of stem-like cells in diseased tissues with normal stem cells |
| Entrez ID | Symbol | Replicates | Species | Organ | Tissue | Adj P-value | Log2FC | Malignancy |
| 3476 | IGBP1 | HTA11_3410_2000001011 | Human | Colorectum | AD | 1.39e-09 | 3.85e-01 | 0.0155 |
| 3476 | IGBP1 | HTA11_2487_2000001011 | Human | Colorectum | SER | 5.56e-11 | 5.55e-01 | -0.1808 |
| 3476 | IGBP1 | HTA11_1938_2000001011 | Human | Colorectum | AD | 4.40e-08 | 6.21e-01 | -0.0811 |
| 3476 | IGBP1 | HTA11_78_2000001011 | Human | Colorectum | AD | 1.11e-09 | 5.95e-01 | -0.1088 |
| 3476 | IGBP1 | HTA11_347_2000001011 | Human | Colorectum | AD | 2.97e-38 | 9.16e-01 | -0.1954 |
| 3476 | IGBP1 | HTA11_411_2000001011 | Human | Colorectum | SER | 3.22e-08 | 1.09e+00 | -0.2602 |
| 3476 | IGBP1 | HTA11_2112_2000001011 | Human | Colorectum | SER | 5.30e-03 | 7.38e-01 | -0.2196 |
| 3476 | IGBP1 | HTA11_3361_2000001011 | Human | Colorectum | AD | 8.71e-05 | 4.25e-01 | -0.1207 |
| 3476 | IGBP1 | HTA11_83_2000001011 | Human | Colorectum | SER | 2.21e-09 | 6.15e-01 | -0.1526 |
| 3476 | IGBP1 | HTA11_696_2000001011 | Human | Colorectum | AD | 1.09e-23 | 6.18e-01 | -0.1464 |
| 3476 | IGBP1 | HTA11_866_2000001011 | Human | Colorectum | AD | 1.23e-12 | 4.19e-01 | -0.1001 |
| 3476 | IGBP1 | HTA11_1391_2000001011 | Human | Colorectum | AD | 1.70e-21 | 8.21e-01 | -0.059 |
| 3476 | IGBP1 | HTA11_2992_2000001011 | Human | Colorectum | SER | 9.07e-14 | 6.94e-01 | -0.1706 |
| 3476 | IGBP1 | HTA11_5212_2000001011 | Human | Colorectum | AD | 4.86e-06 | 4.70e-01 | -0.2061 |
| 3476 | IGBP1 | HTA11_5216_2000001011 | Human | Colorectum | SER | 8.97e-03 | 5.35e-01 | -0.1462 |
| 3476 | IGBP1 | HTA11_546_2000001011 | Human | Colorectum | AD | 3.16e-08 | 6.65e-01 | -0.0842 |
| 3476 | IGBP1 | HTA11_7862_2000001011 | Human | Colorectum | AD | 9.91e-07 | 5.21e-01 | -0.0179 |
| 3476 | IGBP1 | HTA11_866_3004761011 | Human | Colorectum | AD | 5.56e-09 | 4.98e-01 | 0.096 |
| 3476 | IGBP1 | HTA11_4255_2000001011 | Human | Colorectum | SER | 1.10e-03 | 7.03e-01 | 0.0446 |
| 3476 | IGBP1 | HTA11_8622_2000001021 | Human | Colorectum | SER | 1.15e-04 | 4.99e-01 | 0.0528 |
| Page: 1 2 3 4 5 6 7 8 9 10 |
| Tissue | Expression Dynamics | Abbreviation |
| Colorectum (GSE201348) |  | FAP: Familial adenomatous polyposis |
| CRC: Colorectal cancer | ||
| Colorectum (HTA11) |  | AD: Adenomas |
| SER: Sessile serrated lesions | ||
| MSI-H: Microsatellite-high colorectal cancer | ||
| MSS: Microsatellite stable colorectal cancer | ||
| Endometrium | 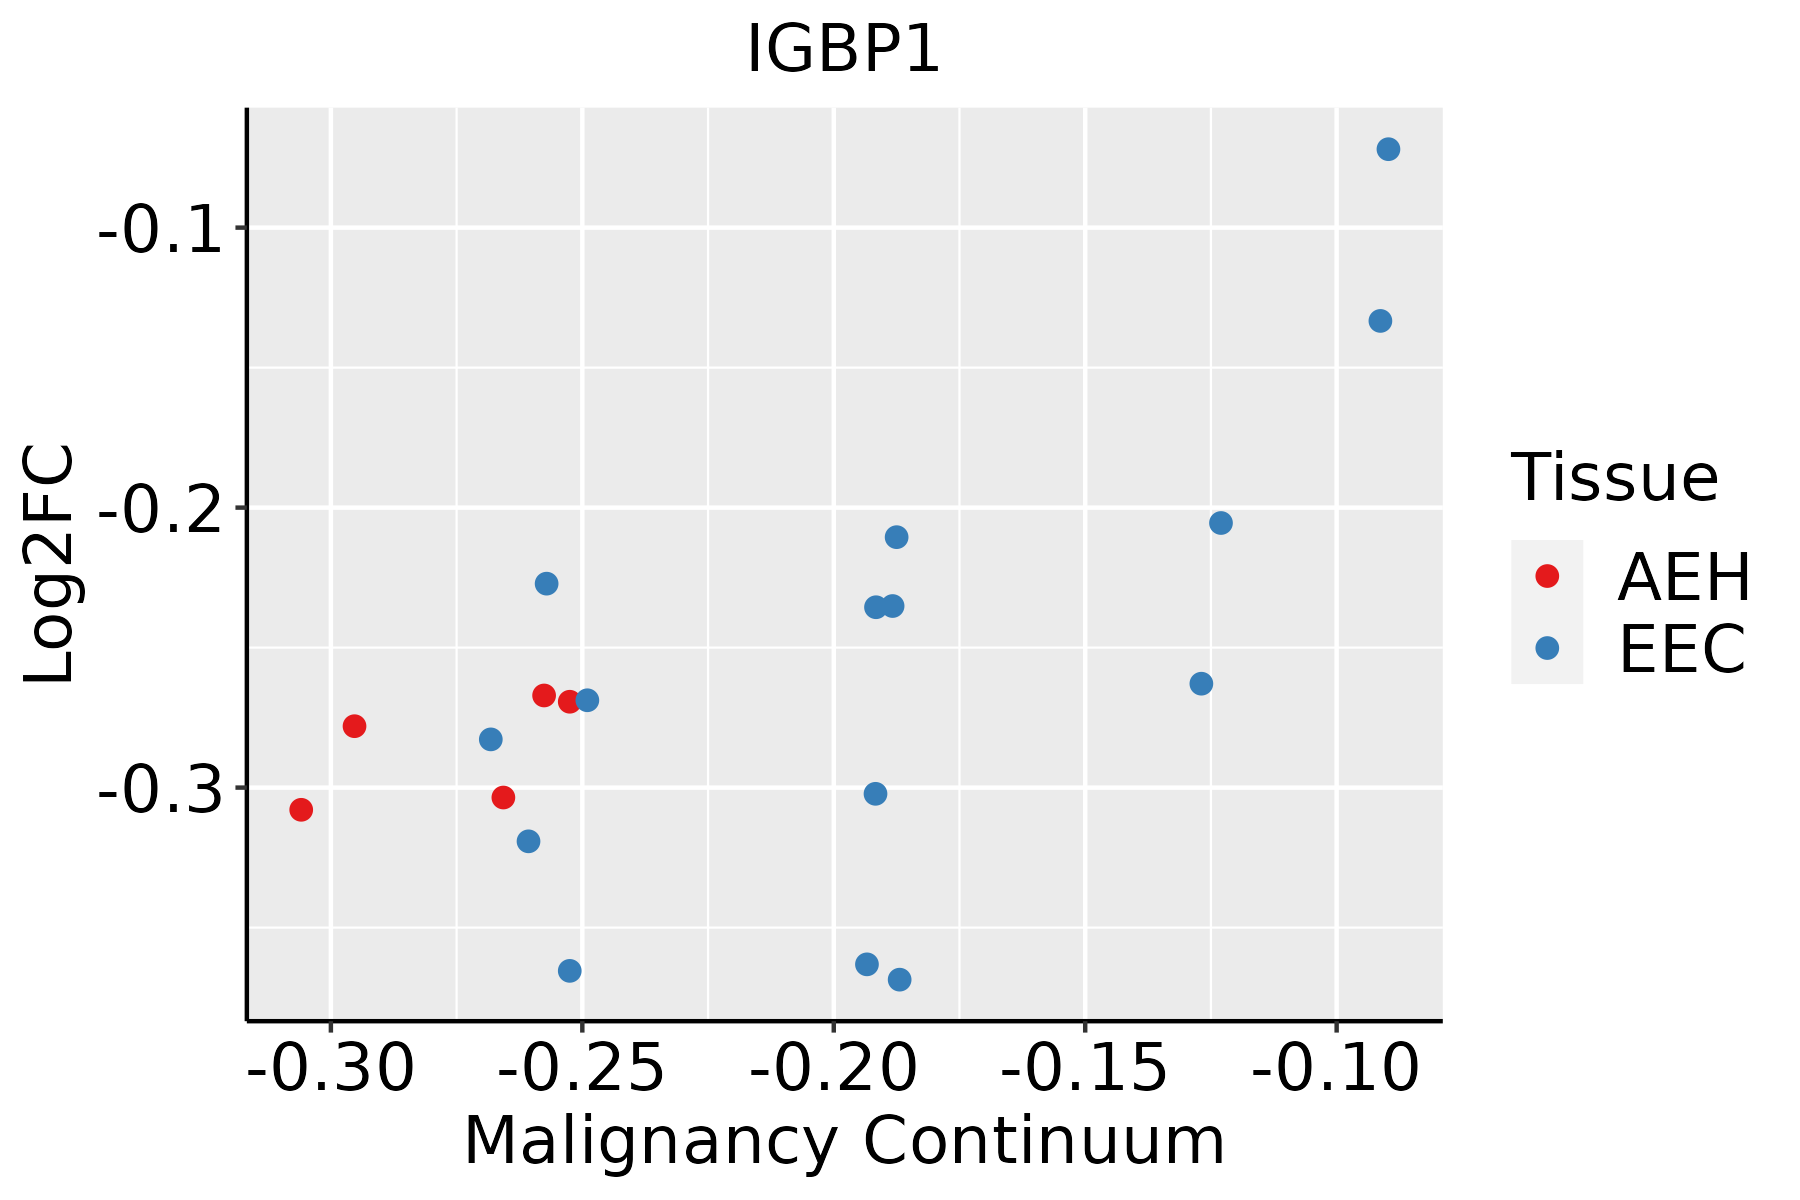 | AEH: Atypical endometrial hyperplasia |
| EEC: Endometrioid Cancer | ||
| Esophagus | 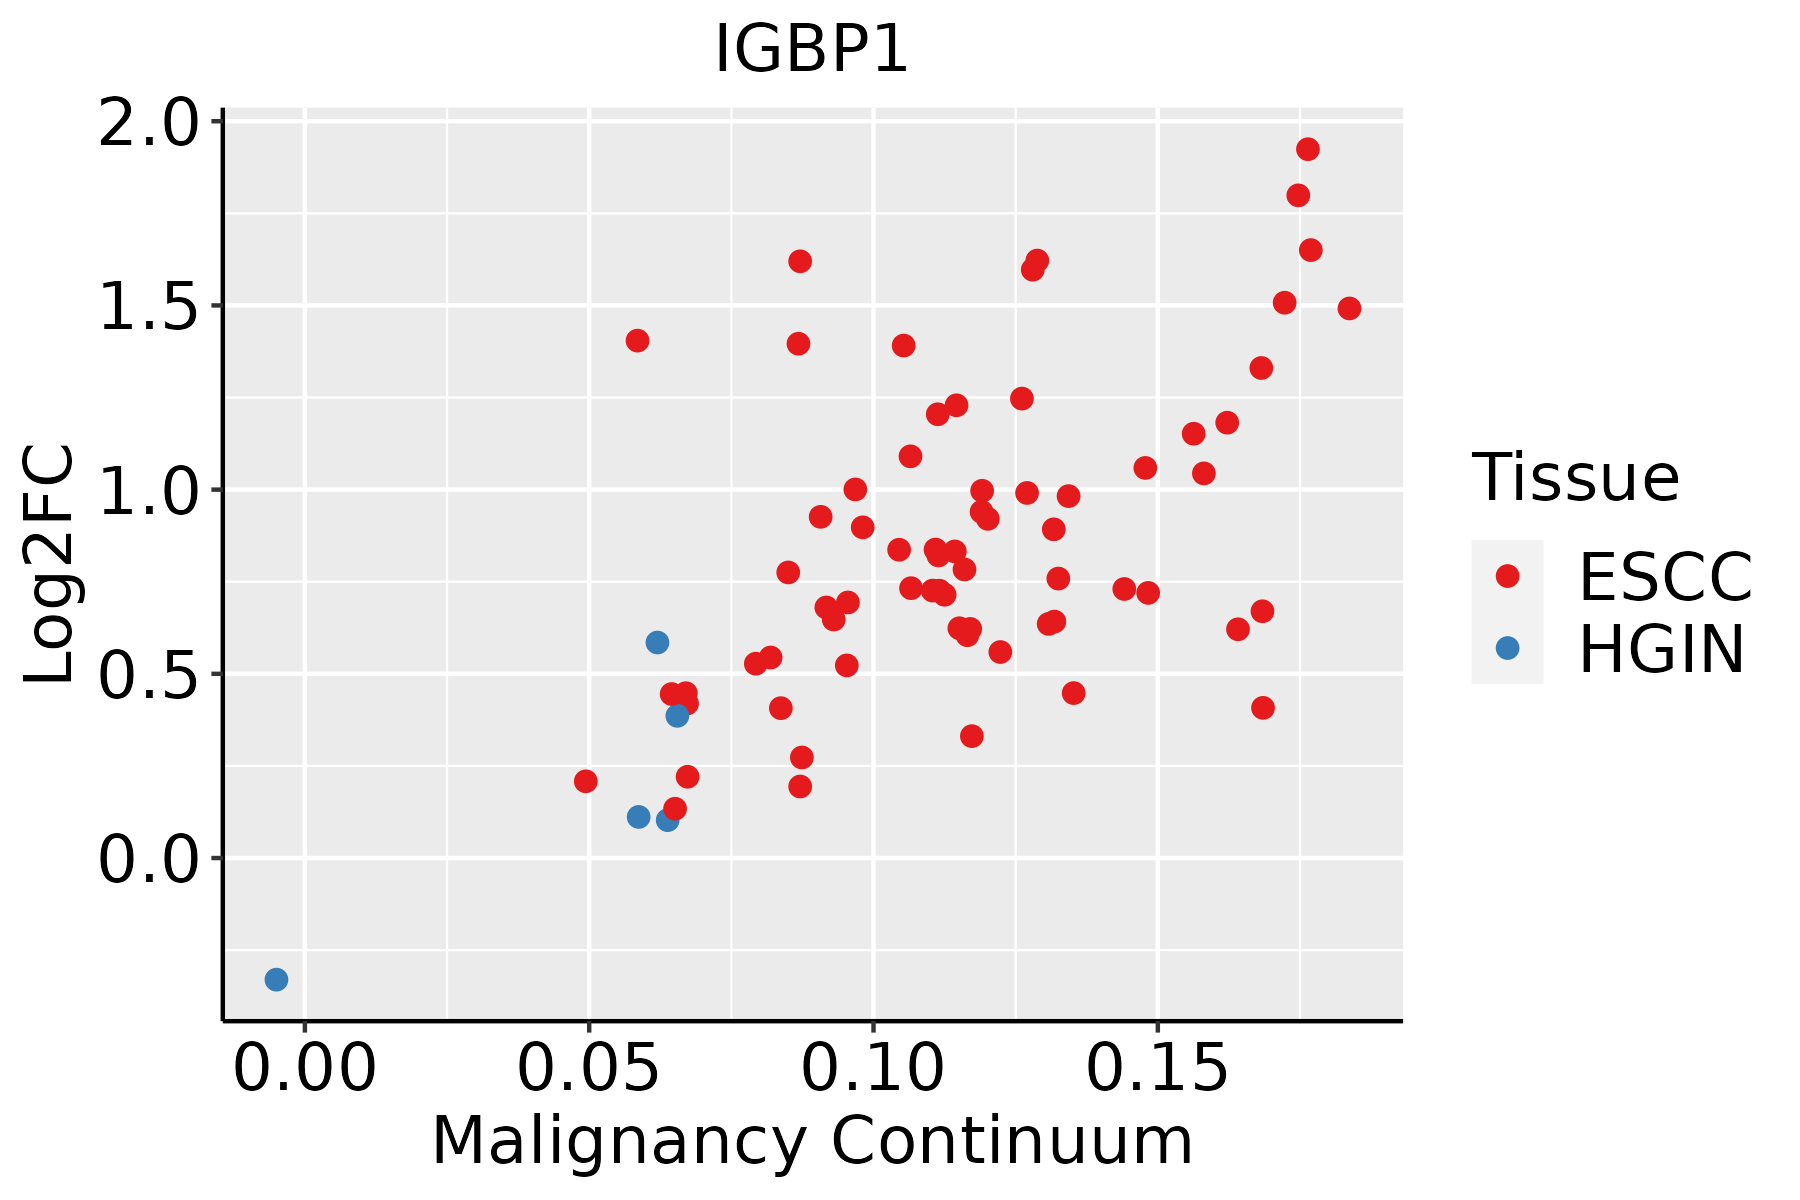 | ESCC: Esophageal squamous cell carcinoma |
| HGIN: High-grade intraepithelial neoplasias | ||
| LGIN: Low-grade intraepithelial neoplasias | ||
| Liver |  | HCC: Hepatocellular carcinoma |
| NAFLD: Non-alcoholic fatty liver disease | ||
| Oral Cavity |  | EOLP: Erosive Oral lichen planus |
| LP: leukoplakia | ||
| NEOLP: Non-erosive oral lichen planus | ||
| OSCC: Oral squamous cell carcinoma | ||
| Prostate | 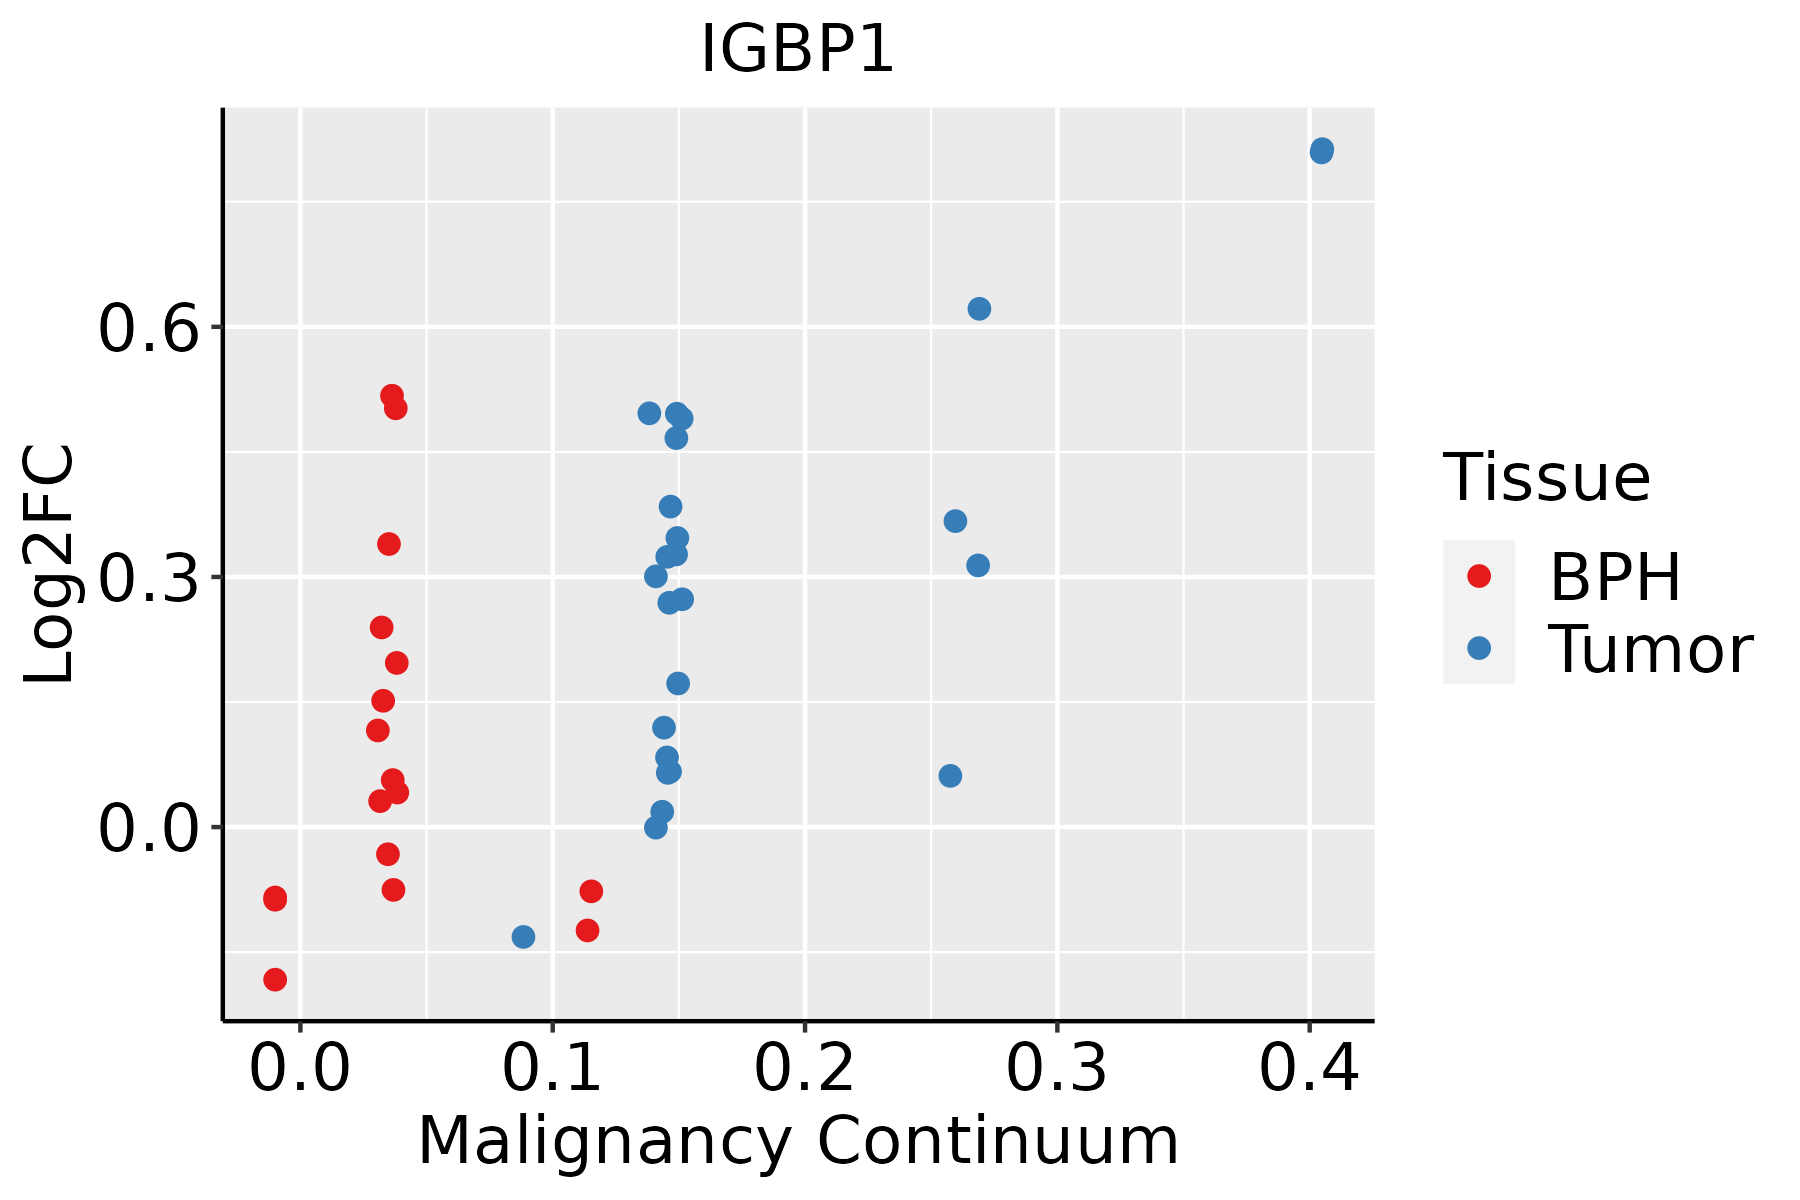 | BPH: Benign Prostatic Hyperplasia |
| Skin | 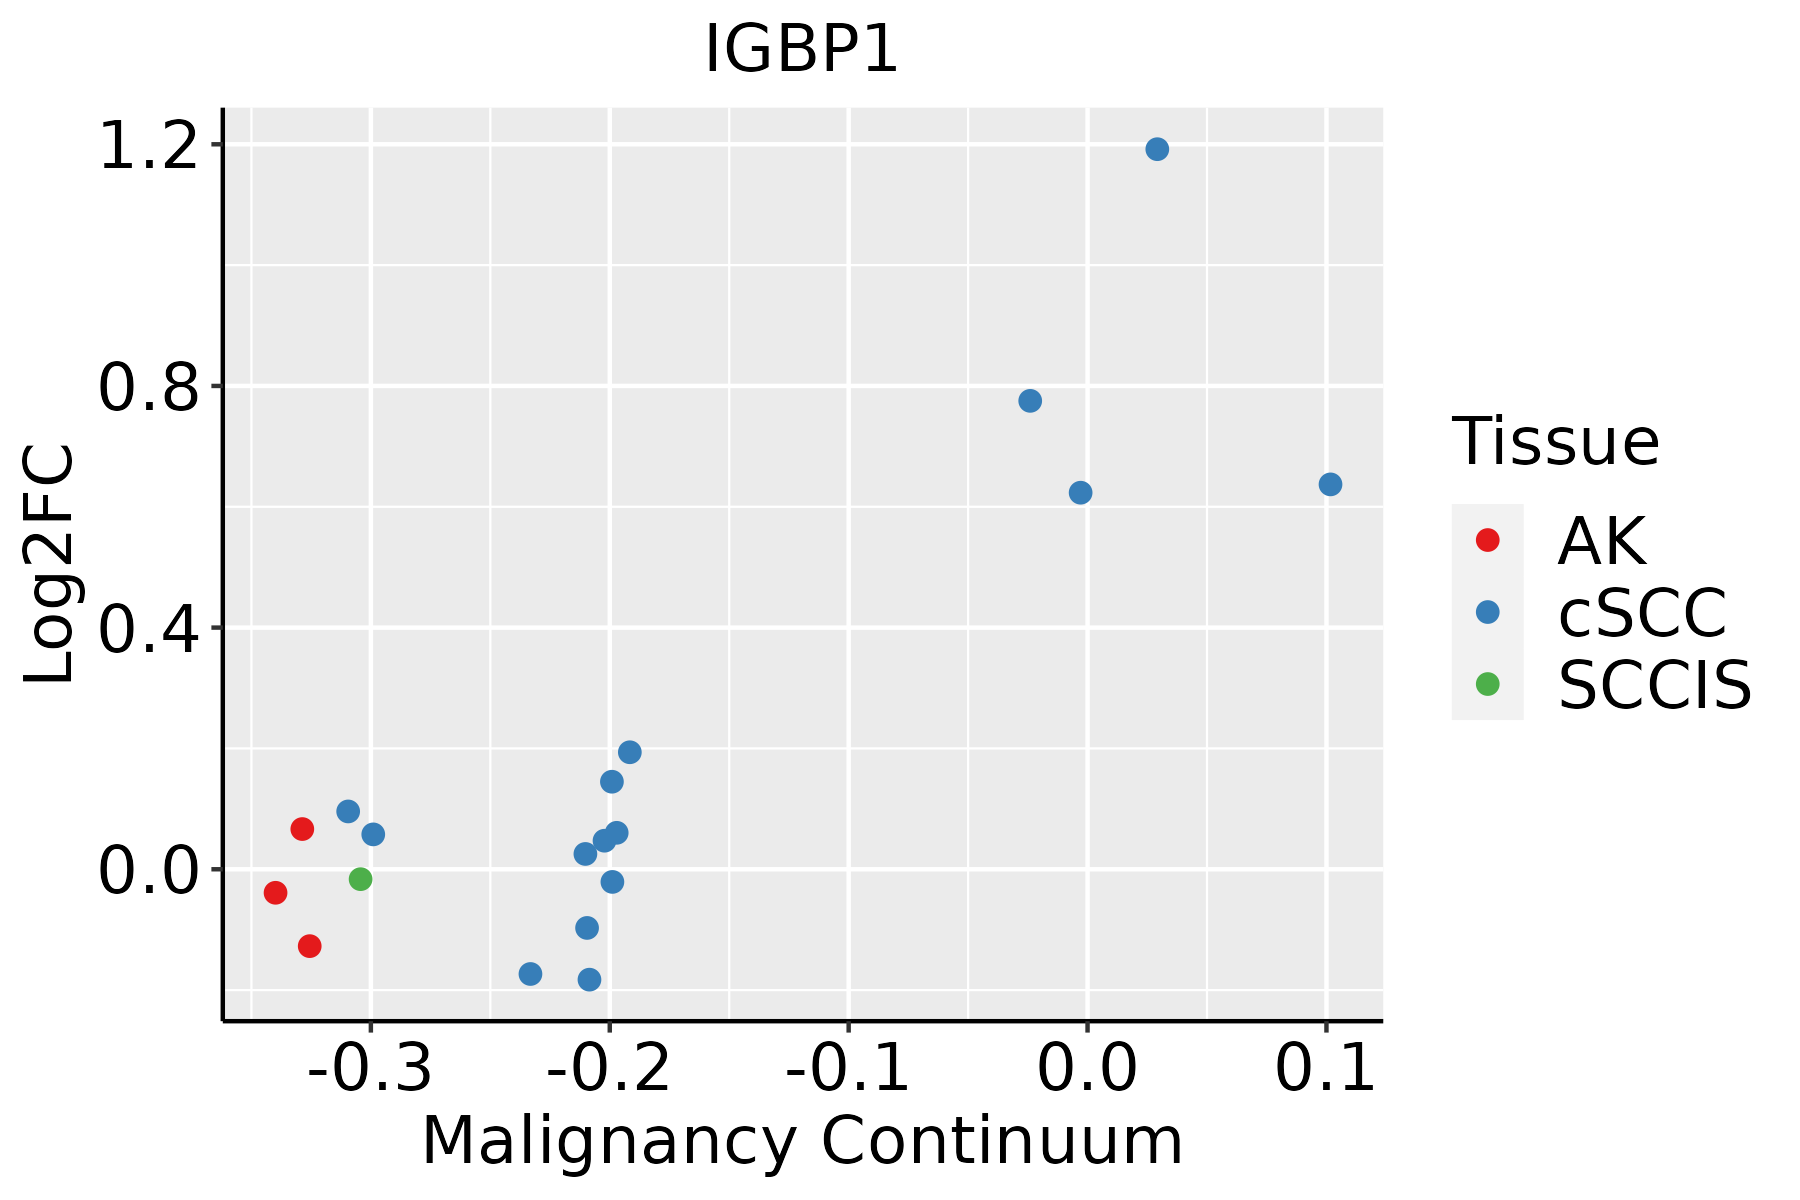 | AK: Actinic keratosis |
| cSCC: Cutaneous squamous cell carcinoma | ||
| SCCIS:squamous cell carcinoma in situ | ||
| Thyroid |  | ATC: Anaplastic thyroid cancer |
| HT: Hashimoto's thyroiditis | ||
| PTC: Papillary thyroid cancer |
| ∗log2FC in expression of this searched gene in stem-like cells from each diseased tissue sample relative to stem-like cells in normal samples in each tissue plotted against the malignancy continuum. Samples are colored based on if they are from different disease stage. |
Top |
Malignant transformation related pathway analysis |
| Find out the enriched GO biological processes and KEGG pathways involved in transition from healthy to precancer to cancer |
| Tissue | Disease Stage | Enriched GO biological Processes |
| Colorectum | AD |  |
| Colorectum | SER |  |
| Colorectum | MSS |  |
| Colorectum | MSI-H |  |
| Colorectum | FAP |  |
| ∗Top 15 enriched GO BP terms are showed in the bar plot of each disease state in each tissue. Each row represents a significant GO biological process which is colored according to the -log10(p.adjust). |
| Page: 1 2 3 4 5 6 7 8 9 |
| GO ID | Tissue | Disease Stage | Description | Gene Ratio | Bg Ratio | pvalue | p.adjust | Count |
| GO:0043281 | Colorectum | AD | regulation of cysteine-type endopeptidase activity involved in apoptotic process | 72/3918 | 209/18723 | 3.70e-06 | 1.03e-04 | 72 |
| GO:2000116 | Colorectum | AD | regulation of cysteine-type endopeptidase activity | 79/3918 | 235/18723 | 3.74e-06 | 1.03e-04 | 79 |
| GO:0052547 | Colorectum | AD | regulation of peptidase activity | 137/3918 | 461/18723 | 4.12e-06 | 1.12e-04 | 137 |
| GO:0016311 | Colorectum | AD | dephosphorylation | 123/3918 | 417/18723 | 1.84e-05 | 3.82e-04 | 123 |
| GO:0045861 | Colorectum | AD | negative regulation of proteolysis | 106/3918 | 351/18723 | 2.33e-05 | 4.57e-04 | 106 |
| GO:0035303 | Colorectum | AD | regulation of dephosphorylation | 46/3918 | 128/18723 | 6.20e-05 | 1.04e-03 | 46 |
| GO:0052548 | Colorectum | AD | regulation of endopeptidase activity | 124/3918 | 432/18723 | 6.58e-05 | 1.07e-03 | 124 |
| GO:0043154 | Colorectum | AD | negative regulation of cysteine-type endopeptidase activity involved in apoptotic process | 30/3918 | 78/18723 | 2.95e-04 | 3.59e-03 | 30 |
| GO:0043409 | Colorectum | AD | negative regulation of MAPK cascade | 57/3918 | 180/18723 | 4.61e-04 | 5.14e-03 | 57 |
| GO:0051403 | Colorectum | AD | stress-activated MAPK cascade | 72/3918 | 239/18723 | 4.77e-04 | 5.25e-03 | 72 |
| GO:0031098 | Colorectum | AD | stress-activated protein kinase signaling cascade | 74/3918 | 247/18723 | 4.80e-04 | 5.27e-03 | 74 |
| GO:2000117 | Colorectum | AD | negative regulation of cysteine-type endopeptidase activity | 31/3918 | 86/18723 | 8.67e-04 | 8.45e-03 | 31 |
| GO:0070302 | Colorectum | AD | regulation of stress-activated protein kinase signaling cascade | 58/3918 | 195/18723 | 2.21e-03 | 1.74e-02 | 58 |
| GO:0032872 | Colorectum | AD | regulation of stress-activated MAPK cascade | 57/3918 | 192/18723 | 2.51e-03 | 1.92e-02 | 57 |
| GO:0032873 | Colorectum | AD | negative regulation of stress-activated MAPK cascade | 19/3918 | 51/18723 | 5.44e-03 | 3.55e-02 | 19 |
| GO:0070303 | Colorectum | AD | negative regulation of stress-activated protein kinase signaling cascade | 19/3918 | 51/18723 | 5.44e-03 | 3.55e-02 | 19 |
| GO:00525471 | Colorectum | SER | regulation of peptidase activity | 114/2897 | 461/18723 | 1.18e-07 | 7.17e-06 | 114 |
| GO:00458611 | Colorectum | SER | negative regulation of proteolysis | 88/2897 | 351/18723 | 1.74e-06 | 7.50e-05 | 88 |
| GO:00525481 | Colorectum | SER | regulation of endopeptidase activity | 103/2897 | 432/18723 | 2.86e-06 | 1.16e-04 | 103 |
| GO:00432811 | Colorectum | SER | regulation of cysteine-type endopeptidase activity involved in apoptotic process | 57/2897 | 209/18723 | 8.08e-06 | 2.74e-04 | 57 |
| Page: 1 2 3 4 5 6 7 8 9 10 11 12 13 14 15 16 |
| Pathway ID | Tissue | Disease Stage | Description | Gene Ratio | Bg Ratio | pvalue | p.adjust | qvalue | Count |
| hsa04140 | Colorectum | AD | Autophagy - animal | 49/2092 | 141/8465 | 4.58e-03 | 2.20e-02 | 1.40e-02 | 49 |
| hsa041401 | Colorectum | AD | Autophagy - animal | 49/2092 | 141/8465 | 4.58e-03 | 2.20e-02 | 1.40e-02 | 49 |
| hsa041402 | Colorectum | SER | Autophagy - animal | 39/1580 | 141/8465 | 5.43e-03 | 3.28e-02 | 2.38e-02 | 39 |
| hsa041403 | Colorectum | SER | Autophagy - animal | 39/1580 | 141/8465 | 5.43e-03 | 3.28e-02 | 2.38e-02 | 39 |
| hsa041404 | Colorectum | MSS | Autophagy - animal | 45/1875 | 141/8465 | 4.42e-03 | 1.90e-02 | 1.16e-02 | 45 |
| hsa041405 | Colorectum | MSS | Autophagy - animal | 45/1875 | 141/8465 | 4.42e-03 | 1.90e-02 | 1.16e-02 | 45 |
| hsa0414010 | Esophagus | ESCC | Autophagy - animal | 101/4205 | 141/8465 | 7.60e-08 | 6.21e-07 | 3.18e-07 | 101 |
| hsa041362 | Esophagus | ESCC | Autophagy - other | 23/4205 | 32/8465 | 8.99e-03 | 2.14e-02 | 1.09e-02 | 23 |
| hsa0414015 | Esophagus | ESCC | Autophagy - animal | 101/4205 | 141/8465 | 7.60e-08 | 6.21e-07 | 3.18e-07 | 101 |
| hsa0413611 | Esophagus | ESCC | Autophagy - other | 23/4205 | 32/8465 | 8.99e-03 | 2.14e-02 | 1.09e-02 | 23 |
| hsa041406 | Liver | Cirrhotic | Autophagy - animal | 65/2530 | 141/8465 | 3.10e-05 | 2.47e-04 | 1.52e-04 | 65 |
| hsa0414011 | Liver | Cirrhotic | Autophagy - animal | 65/2530 | 141/8465 | 3.10e-05 | 2.47e-04 | 1.52e-04 | 65 |
| hsa0414021 | Liver | HCC | Autophagy - animal | 99/4020 | 141/8465 | 3.08e-08 | 4.70e-07 | 2.61e-07 | 99 |
| hsa0414031 | Liver | HCC | Autophagy - animal | 99/4020 | 141/8465 | 3.08e-08 | 4.70e-07 | 2.61e-07 | 99 |
| hsa041409 | Oral cavity | OSCC | Autophagy - animal | 94/3704 | 141/8465 | 2.73e-08 | 2.38e-07 | 1.21e-07 | 94 |
| hsa0414014 | Oral cavity | OSCC | Autophagy - animal | 94/3704 | 141/8465 | 2.73e-08 | 2.38e-07 | 1.21e-07 | 94 |
| hsa0414024 | Oral cavity | LP | Autophagy - animal | 55/2418 | 141/8465 | 4.54e-03 | 1.87e-02 | 1.20e-02 | 55 |
| hsa0414034 | Oral cavity | LP | Autophagy - animal | 55/2418 | 141/8465 | 4.54e-03 | 1.87e-02 | 1.20e-02 | 55 |
| hsa041408 | Prostate | BPH | Autophagy - animal | 42/1718 | 141/8465 | 4.46e-03 | 1.53e-02 | 9.49e-03 | 42 |
| hsa0414013 | Prostate | BPH | Autophagy - animal | 42/1718 | 141/8465 | 4.46e-03 | 1.53e-02 | 9.49e-03 | 42 |
| Page: 1 2 |
Top |
Cell-cell communication analysis |
| Identification of potential cell-cell interactions between two cell types and their ligand-receptor pairs for different disease states |
| Ligand | Receptor | LRpair | Pathway | Tissue | Disease Stage |
| Page: 1 |
Top |
Single-cell gene regulatory network inference analysis |
| Find out the significant the regulons (TFs) and the target genes of each regulon across cell types for different disease states |
| TF | Cell Type | Tissue | Disease Stage | Target Gene | RSS | Regulon Activity |
| ∗The dot plots of a searched regulon are shown for all cell subpopulations in each disease state of each tissue based on the regulon specific score inferred using pySCENIC and by calculating the average expression. |
| Page: 1 |
Top |
Somatic mutation of malignant transformation related genes |
| Annotation of somatic variants for genes involved in malignant transformation |
| Hugo Symbol | Variant Class | Variant Classification | dbSNP RS | HGVSc | HGVSp | HGVSp Short | SWISSPROT | BIOTYPE | SIFT | PolyPhen | Tumor Sample Barcode | Tissue | Histology | Sex | Age | Stage | Therapy Types | Drugs | Outcome |
| IGBP1 | SNV | Missense_Mutation | rs145852352 | c.1012A>G | p.Met338Val | p.M338V | P78318 | protein_coding | tolerated(0.07) | benign(0.317) | TCGA-D8-A1JD-01 | Breast | breast invasive carcinoma | Female | <65 | I/II | Chemotherapy | adriamycin | SD |
| IGBP1 | SNV | Missense_Mutation | rs766373243 | c.29N>T | p.Pro10Leu | p.P10L | P78318 | protein_coding | tolerated(0.05) | benign(0.015) | TCGA-E2-A158-01 | Breast | breast invasive carcinoma | Female | <65 | I/II | Chemotherapy | arimidex | SD |
| IGBP1 | SNV | Missense_Mutation | c.729N>G | p.Phe243Leu | p.F243L | P78318 | protein_coding | deleterious(0.01) | probably_damaging(0.982) | TCGA-IR-A3LA-01 | Cervix | cervical & endocervical cancer | Female | <65 | I/II | Chemotherapy | cisplatin | CR | |
| IGBP1 | SNV | Missense_Mutation | c.311N>A | p.Arg104Gln | p.R104Q | P78318 | protein_coding | tolerated(0.64) | benign(0.003) | TCGA-AA-3833-01 | Colorectum | colon adenocarcinoma | Female | <65 | I/II | Unknown | Unknown | SD | |
| IGBP1 | SNV | Missense_Mutation | novel | c.160N>A | p.Glu54Lys | p.E54K | P78318 | protein_coding | tolerated(0.46) | benign(0.007) | TCGA-G4-6304-01 | Colorectum | colon adenocarcinoma | Female | >=65 | I/II | Chemotherapy | fluorouracil | PD |
| IGBP1 | SNV | Missense_Mutation | c.635N>G | p.Asp212Gly | p.D212G | P78318 | protein_coding | deleterious(0) | probably_damaging(0.92) | TCGA-AG-3892-01 | Colorectum | rectum adenocarcinoma | Female | <65 | I/II | Unknown | Unknown | SD | |
| IGBP1 | SNV | Missense_Mutation | c.28C>T | p.Pro10Ser | p.P10S | P78318 | protein_coding | deleterious(0.03) | benign(0.17) | TCGA-AG-A002-01 | Colorectum | rectum adenocarcinoma | Male | <65 | I/II | Unknown | Unknown | SD | |
| IGBP1 | SNV | Missense_Mutation | novel | c.568C>T | p.Arg190Cys | p.R190C | P78318 | protein_coding | deleterious(0.02) | possibly_damaging(0.604) | TCGA-EI-6917-01 | Colorectum | rectum adenocarcinoma | Male | <65 | III/IV | Chemotherapy | 5fluorouracil+oxaciplatina+l-folinian | SD |
| IGBP1 | SNV | Missense_Mutation | novel | c.566T>C | p.Val189Ala | p.V189A | P78318 | protein_coding | tolerated(0.09) | possibly_damaging(0.843) | TCGA-A5-A0G1-01 | Endometrium | uterine corpus endometrioid carcinoma | Female | >=65 | I/II | Unknown | Unknown | SD |
| IGBP1 | SNV | Missense_Mutation | c.191N>A | p.Arg64Gln | p.R64Q | P78318 | protein_coding | tolerated(0.25) | benign(0.069) | TCGA-A5-A0GP-01 | Endometrium | uterine corpus endometrioid carcinoma | Female | <65 | I/II | Unknown | Unknown | SD |
| Page: 1 2 3 4 |
Top |
Related drugs of malignant transformation related genes |
| Identification of chemicals and drugs interact with genes involved in malignant transfromation |
| (DGIdb 4.0) |
| Entrez ID | Symbol | Category | Interaction Types | Drug Claim Name | Drug Name | PMIDs |
| Page: 1 |

Copyright 2023-Present -The University of Texas Health Science Center at Houston |