
|
|||||
|
 | |
| |
| |
| |
| |
| |
|
Gene: IFT52 |
Gene summary for IFT52 |
| Gene information | Species | Human | Gene symbol | IFT52 | Gene ID | 51098 |
| Gene name | intraflagellar transport 52 | |
| Gene Alias | C20orf9 | |
| Cytomap | 20q13.12 | |
| Gene Type | protein-coding | GO ID | GO:0001838 | UniProtAcc | Q9Y366 |
Top |
Malignant transformation analysis |
| Identification of the aberrant gene expression in precancerous and cancerous lesions by comparing the gene expression of stem-like cells in diseased tissues with normal stem cells |
| Entrez ID | Symbol | Replicates | Species | Organ | Tissue | Adj P-value | Log2FC | Malignancy |
| 51098 | IFT52 | LZE4T | Human | Esophagus | ESCC | 1.30e-10 | 2.02e-01 | 0.0811 |
| 51098 | IFT52 | LZE8T | Human | Esophagus | ESCC | 9.88e-03 | 8.89e-02 | 0.067 |
| 51098 | IFT52 | LZE20T | Human | Esophagus | ESCC | 8.91e-03 | 8.62e-02 | 0.0662 |
| 51098 | IFT52 | LZE24T | Human | Esophagus | ESCC | 6.72e-11 | 2.83e-01 | 0.0596 |
| 51098 | IFT52 | LZE21T | Human | Esophagus | ESCC | 9.36e-04 | 2.21e-01 | 0.0655 |
| 51098 | IFT52 | LZE6T | Human | Esophagus | ESCC | 1.34e-02 | 2.18e-01 | 0.0845 |
| 51098 | IFT52 | P1T-E | Human | Esophagus | ESCC | 6.37e-05 | 1.99e-01 | 0.0875 |
| 51098 | IFT52 | P2T-E | Human | Esophagus | ESCC | 3.15e-31 | 5.38e-01 | 0.1177 |
| 51098 | IFT52 | P4T-E | Human | Esophagus | ESCC | 1.75e-20 | 5.02e-01 | 0.1323 |
| 51098 | IFT52 | P5T-E | Human | Esophagus | ESCC | 1.48e-17 | 3.31e-01 | 0.1327 |
| 51098 | IFT52 | P8T-E | Human | Esophagus | ESCC | 1.62e-40 | 7.33e-01 | 0.0889 |
| 51098 | IFT52 | P9T-E | Human | Esophagus | ESCC | 2.29e-06 | 1.69e-01 | 0.1131 |
| 51098 | IFT52 | P10T-E | Human | Esophagus | ESCC | 5.41e-41 | 7.89e-01 | 0.116 |
| 51098 | IFT52 | P11T-E | Human | Esophagus | ESCC | 1.44e-11 | 4.24e-01 | 0.1426 |
| 51098 | IFT52 | P12T-E | Human | Esophagus | ESCC | 1.74e-35 | 6.38e-01 | 0.1122 |
| 51098 | IFT52 | P15T-E | Human | Esophagus | ESCC | 1.53e-25 | 5.17e-01 | 0.1149 |
| 51098 | IFT52 | P16T-E | Human | Esophagus | ESCC | 1.88e-36 | 8.39e-01 | 0.1153 |
| 51098 | IFT52 | P17T-E | Human | Esophagus | ESCC | 5.57e-14 | 2.80e-01 | 0.1278 |
| 51098 | IFT52 | P19T-E | Human | Esophagus | ESCC | 1.33e-04 | 4.13e-01 | 0.1662 |
| 51098 | IFT52 | P20T-E | Human | Esophagus | ESCC | 3.98e-26 | 6.19e-01 | 0.1124 |
| Page: 1 2 3 4 5 |
| Tissue | Expression Dynamics | Abbreviation |
| Esophagus |  | ESCC: Esophageal squamous cell carcinoma |
| HGIN: High-grade intraepithelial neoplasias | ||
| LGIN: Low-grade intraepithelial neoplasias | ||
| Liver | 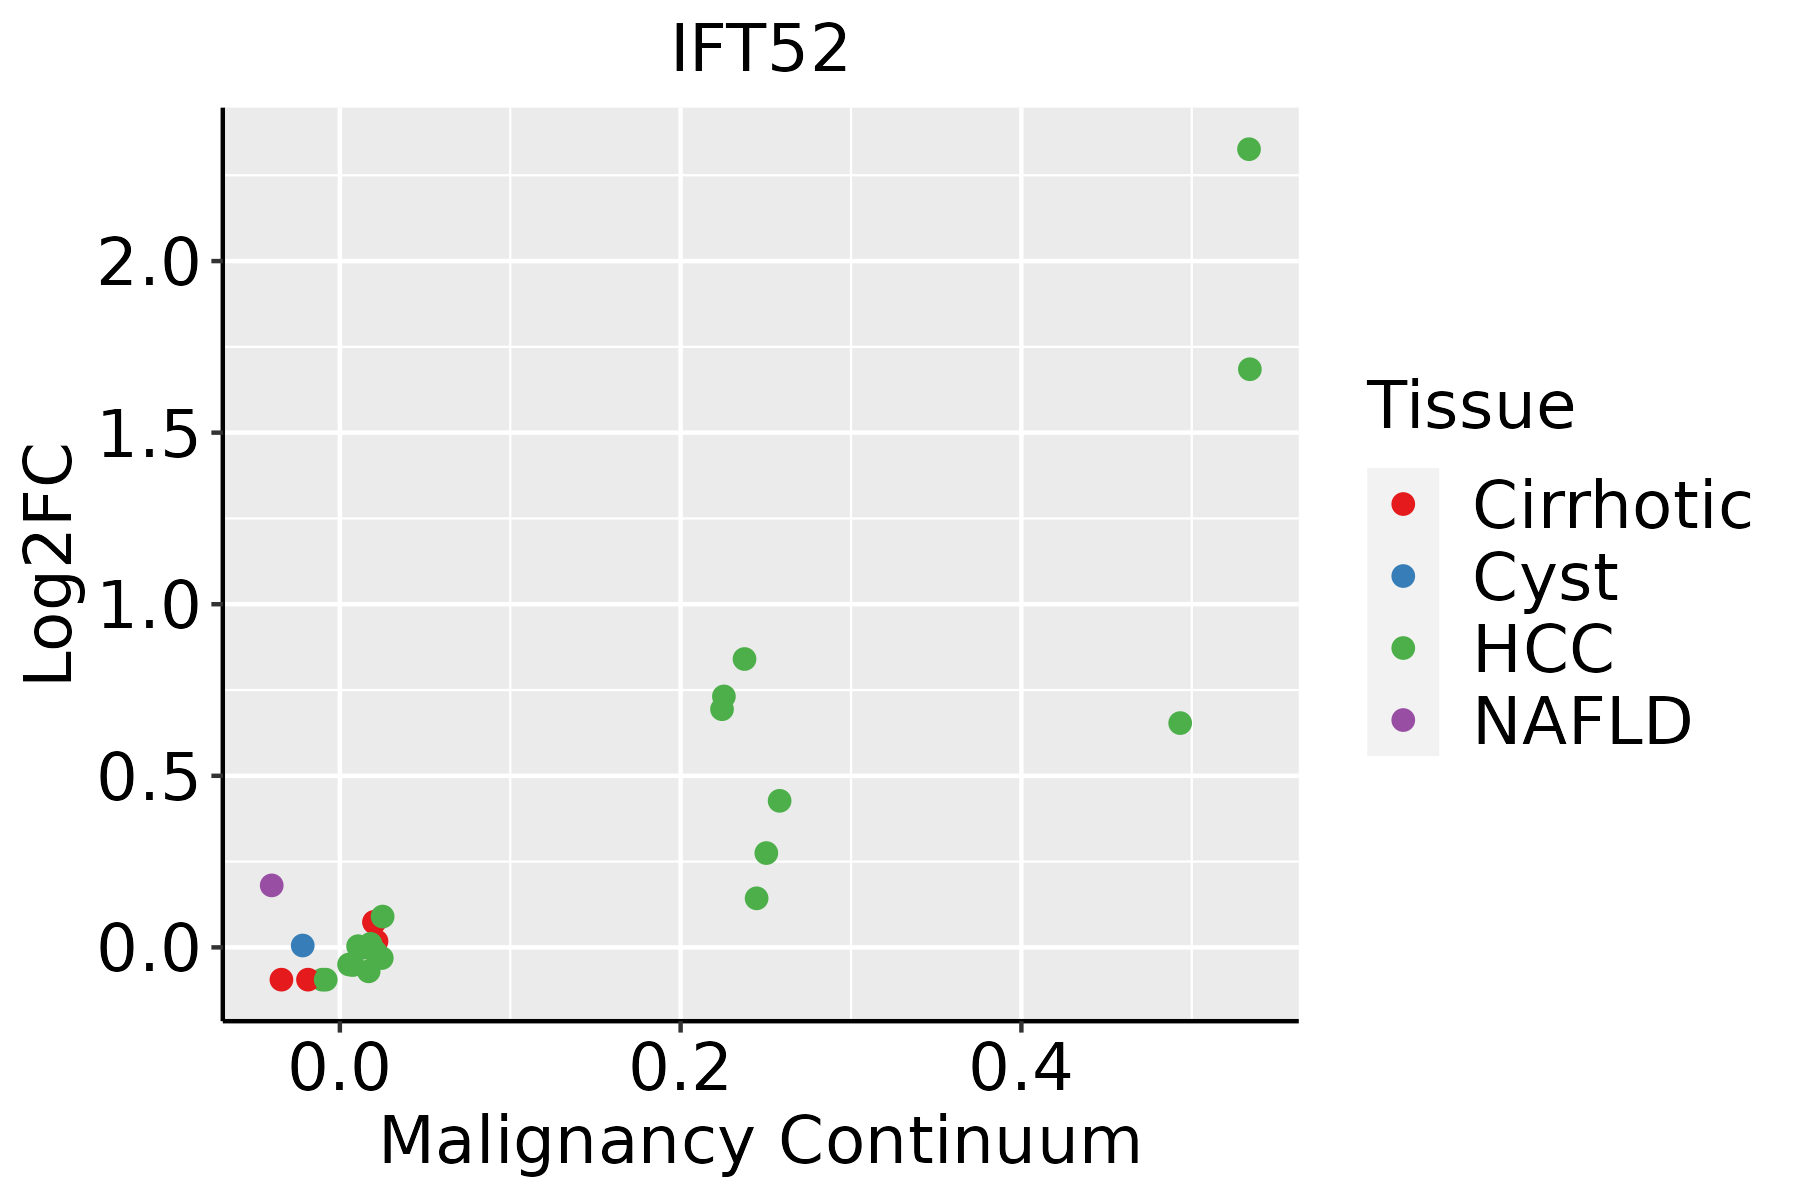 | HCC: Hepatocellular carcinoma |
| NAFLD: Non-alcoholic fatty liver disease | ||
| Oral Cavity | 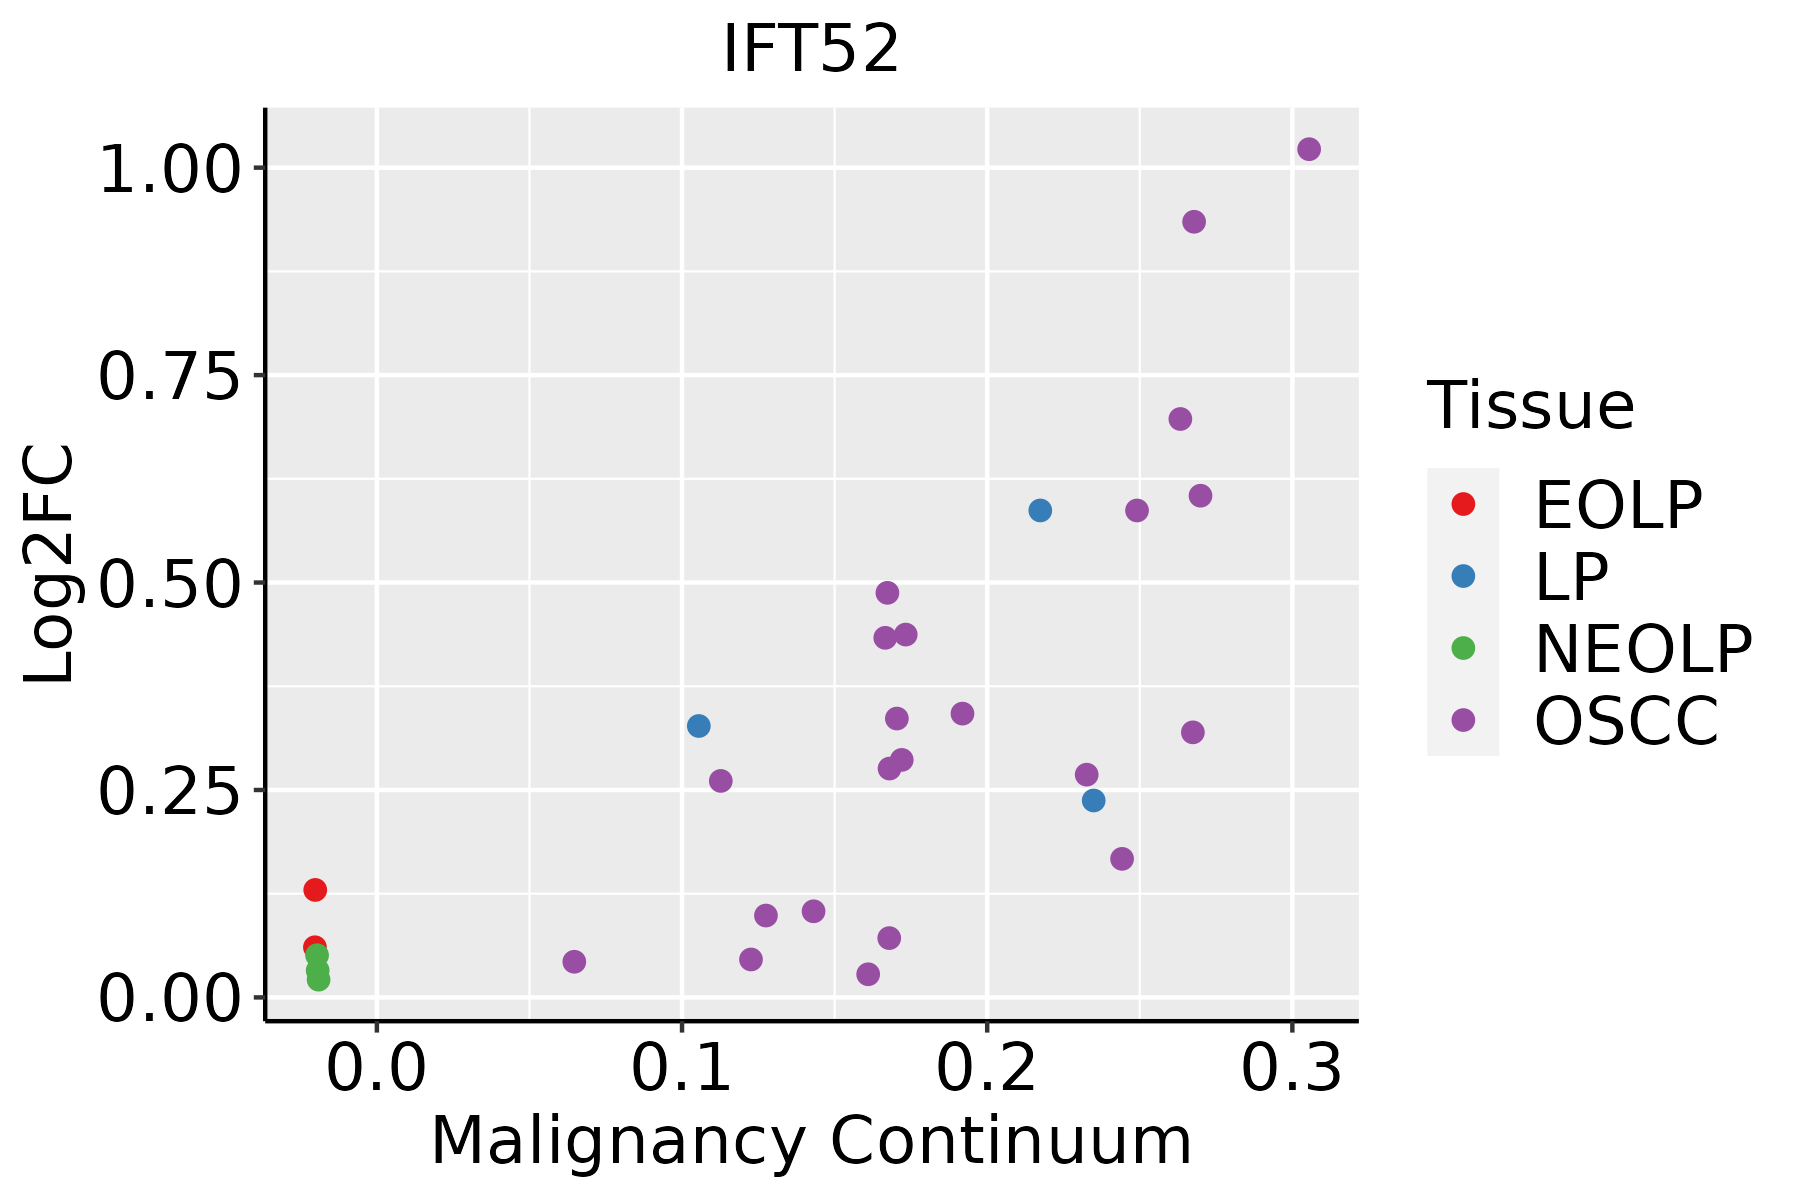 | EOLP: Erosive Oral lichen planus |
| LP: leukoplakia | ||
| NEOLP: Non-erosive oral lichen planus | ||
| OSCC: Oral squamous cell carcinoma | ||
| Thyroid | 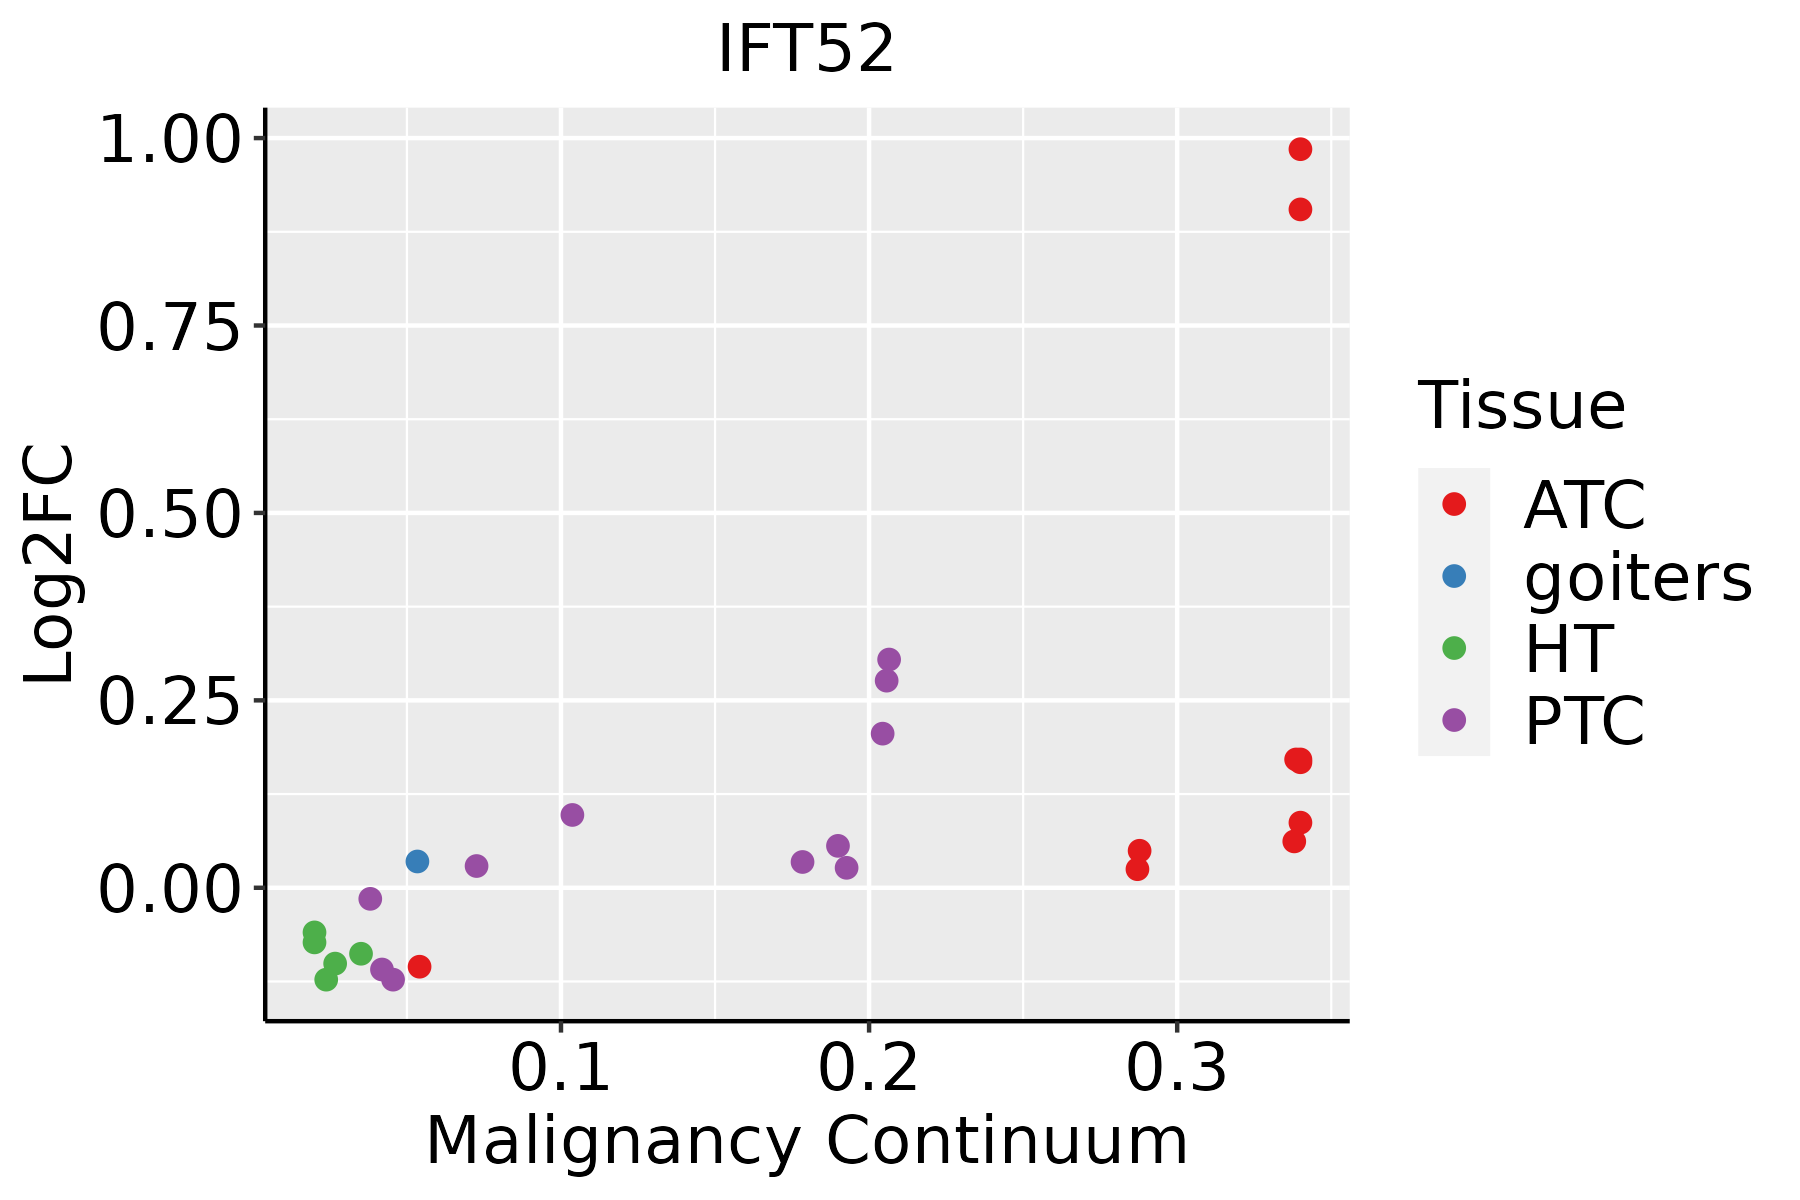 | ATC: Anaplastic thyroid cancer |
| HT: Hashimoto's thyroiditis | ||
| PTC: Papillary thyroid cancer |
| ∗log2FC in expression of this searched gene in stem-like cells from each diseased tissue sample relative to stem-like cells in normal samples in each tissue plotted against the malignancy continuum. Samples are colored based on if they are from different disease stage. |
Top |
Malignant transformation related pathway analysis |
| Find out the enriched GO biological processes and KEGG pathways involved in transition from healthy to precancer to cancer |
| Tissue | Disease Stage | Enriched GO biological Processes |
| Colorectum | AD |  |
| Colorectum | SER |  |
| Colorectum | MSS |  |
| Colorectum | MSI-H |  |
| Colorectum | FAP |  |
| ∗Top 15 enriched GO BP terms are showed in the bar plot of each disease state in each tissue. Each row represents a significant GO biological process which is colored according to the -log10(p.adjust). |
| Page: 1 2 3 4 5 6 7 8 9 |
| GO ID | Tissue | Disease Stage | Description | Gene Ratio | Bg Ratio | pvalue | p.adjust | Count |
| GO:005160418 | Esophagus | ESCC | protein maturation | 189/8552 | 294/18723 | 7.64e-11 | 2.39e-09 | 189 |
| GO:003070518 | Esophagus | ESCC | cytoskeleton-dependent intracellular transport | 133/8552 | 195/18723 | 1.48e-10 | 4.27e-09 | 133 |
| GO:001097013 | Esophagus | ESCC | transport along microtubule | 107/8552 | 155/18723 | 3.17e-09 | 6.80e-08 | 107 |
| GO:000184115 | Esophagus | ESCC | neural tube formation | 75/8552 | 102/18723 | 9.68e-09 | 1.95e-07 | 75 |
| GO:003150314 | Esophagus | ESCC | protein-containing complex localization | 139/8552 | 220/18723 | 1.14e-07 | 1.85e-06 | 139 |
| GO:00219159 | Esophagus | ESCC | neural tube development | 101/8552 | 152/18723 | 1.78e-07 | 2.79e-06 | 101 |
| GO:00163316 | Esophagus | ESCC | morphogenesis of embryonic epithelium | 98/8552 | 147/18723 | 2.12e-07 | 3.27e-06 | 98 |
| GO:000183814 | Esophagus | ESCC | embryonic epithelial tube formation | 83/8552 | 121/18723 | 2.78e-07 | 4.08e-06 | 83 |
| GO:003514815 | Esophagus | ESCC | tube formation | 96/8552 | 148/18723 | 1.86e-06 | 2.16e-05 | 96 |
| GO:00721759 | Esophagus | ESCC | epithelial tube formation | 86/8552 | 132/18723 | 4.81e-06 | 5.10e-05 | 86 |
| GO:006056210 | Esophagus | ESCC | epithelial tube morphogenesis | 187/8552 | 325/18723 | 9.95e-06 | 9.44e-05 | 187 |
| GO:001648514 | Esophagus | ESCC | protein processing | 134/8552 | 225/18723 | 1.81e-05 | 1.60e-04 | 134 |
| GO:00991114 | Esophagus | ESCC | microtubule-based transport | 115/8552 | 190/18723 | 2.54e-05 | 2.15e-04 | 115 |
| GO:005067318 | Esophagus | ESCC | epithelial cell proliferation | 238/8552 | 437/18723 | 1.19e-04 | 8.20e-04 | 238 |
| GO:005067817 | Esophagus | ESCC | regulation of epithelial cell proliferation | 206/8552 | 381/18723 | 5.51e-04 | 3.02e-03 | 206 |
| GO:00485687 | Esophagus | ESCC | embryonic organ development | 228/8552 | 427/18723 | 7.28e-04 | 3.79e-03 | 228 |
| GO:00487367 | Esophagus | ESCC | appendage development | 98/8552 | 172/18723 | 1.83e-03 | 8.37e-03 | 98 |
| GO:00601737 | Esophagus | ESCC | limb development | 98/8552 | 172/18723 | 1.83e-03 | 8.37e-03 | 98 |
| GO:19055153 | Esophagus | ESCC | non-motile cilium assembly | 39/8552 | 61/18723 | 3.08e-03 | 1.28e-02 | 39 |
| GO:005160412 | Liver | HCC | protein maturation | 171/7958 | 294/18723 | 3.80e-08 | 8.30e-07 | 171 |
| Page: 1 2 3 4 5 |
| Pathway ID | Tissue | Disease Stage | Description | Gene Ratio | Bg Ratio | pvalue | p.adjust | qvalue | Count |
| Page: 1 |
Top |
Cell-cell communication analysis |
| Identification of potential cell-cell interactions between two cell types and their ligand-receptor pairs for different disease states |
| Ligand | Receptor | LRpair | Pathway | Tissue | Disease Stage |
| Page: 1 |
Top |
Single-cell gene regulatory network inference analysis |
| Find out the significant the regulons (TFs) and the target genes of each regulon across cell types for different disease states |
| TF | Cell Type | Tissue | Disease Stage | Target Gene | RSS | Regulon Activity |
| ∗The dot plots of a searched regulon are shown for all cell subpopulations in each disease state of each tissue based on the regulon specific score inferred using pySCENIC and by calculating the average expression. |
| Page: 1 |
Top |
Somatic mutation of malignant transformation related genes |
| Annotation of somatic variants for genes involved in malignant transformation |
| Hugo Symbol | Variant Class | Variant Classification | dbSNP RS | HGVSc | HGVSp | HGVSp Short | SWISSPROT | BIOTYPE | SIFT | PolyPhen | Tumor Sample Barcode | Tissue | Histology | Sex | Age | Stage | Therapy Types | Drugs | Outcome |
| IFT52 | SNV | Missense_Mutation | c.232N>C | p.Asp78His | p.D78H | Q9Y366 | protein_coding | deleterious(0.05) | possibly_damaging(0.904) | TCGA-A1-A0SK-01 | Breast | breast invasive carcinoma | Female | <65 | I/II | Unknown | Unknown | PD | |
| IFT52 | SNV | Missense_Mutation | c.1115A>G | p.Asn372Ser | p.N372S | Q9Y366 | protein_coding | deleterious(0.03) | possibly_damaging(0.493) | TCGA-A2-A25C-01 | Breast | breast invasive carcinoma | Female | <65 | I/II | Chemotherapy | taxotere | SD | |
| IFT52 | SNV | Missense_Mutation | rs754799617 | c.701N>T | p.Asp234Val | p.D234V | Q9Y366 | protein_coding | deleterious(0) | possibly_damaging(0.886) | TCGA-A7-A6VY-01 | Breast | breast invasive carcinoma | Female | <65 | I/II | Chemotherapy | cyclophosphamide | CR |
| IFT52 | SNV | Missense_Mutation | novel | c.766G>C | p.Glu256Gln | p.E256Q | Q9Y366 | protein_coding | deleterious(0.03) | probably_damaging(0.962) | TCGA-AC-A23H-01 | Breast | breast invasive carcinoma | Female | >=65 | I/II | Unknown | Unknown | PD |
| IFT52 | SNV | Missense_Mutation | c.664N>G | p.Gln222Glu | p.Q222E | Q9Y366 | protein_coding | tolerated(0.35) | benign(0.007) | TCGA-EK-A2PI-01 | Cervix | cervical & endocervical cancer | Female | <65 | III/IV | Unknown | Unknown | SD | |
| IFT52 | SNV | Missense_Mutation | novel | c.341N>T | p.Ala114Val | p.A114V | Q9Y366 | protein_coding | tolerated(0.07) | benign(0.125) | TCGA-AA-3811-01 | Colorectum | colon adenocarcinoma | Female | >=65 | III/IV | Unknown | Unknown | PD |
| IFT52 | SNV | Missense_Mutation | novel | c.694N>G | p.Ile232Val | p.I232V | Q9Y366 | protein_coding | tolerated(0.15) | benign(0.021) | TCGA-CA-6717-01 | Colorectum | colon adenocarcinoma | Male | <65 | I/II | Chemotherapy | oxaliplatin | CR |
| IFT52 | SNV | Missense_Mutation | c.181C>T | p.Pro61Ser | p.P61S | Q9Y366 | protein_coding | deleterious(0.04) | probably_damaging(1) | TCGA-NH-A5IV-01 | Colorectum | colon adenocarcinoma | Female | >=65 | I/II | Unknown | Unknown | SD | |
| IFT52 | SNV | Missense_Mutation | novel | c.302N>G | p.Phe101Cys | p.F101C | Q9Y366 | protein_coding | deleterious(0.05) | probably_damaging(0.998) | TCGA-A5-A1OF-01 | Endometrium | uterine corpus endometrioid carcinoma | Female | <65 | I/II | Unknown | Unknown | SD |
| IFT52 | SNV | Missense_Mutation | c.144N>T | p.Glu48Asp | p.E48D | Q9Y366 | protein_coding | tolerated(0.51) | benign(0.057) | TCGA-AP-A056-01 | Endometrium | uterine corpus endometrioid carcinoma | Female | <65 | I/II | Unknown | Unknown | SD |
| Page: 1 2 3 4 5 |
Top |
Related drugs of malignant transformation related genes |
| Identification of chemicals and drugs interact with genes involved in malignant transfromation |
| (DGIdb 4.0) |
| Entrez ID | Symbol | Category | Interaction Types | Drug Claim Name | Drug Name | PMIDs |
| Page: 1 |

Copyright 2023-Present -The University of Texas Health Science Center at Houston |