
|
|||||
|
 | |
| |
| |
| |
| |
| |
|
Gene: IFT46 |
Gene summary for IFT46 |
| Gene information | Species | Human | Gene symbol | IFT46 | Gene ID | 56912 |
| Gene name | intraflagellar transport 46 | |
| Gene Alias | C11orf2 | |
| Cytomap | 11q23.3 | |
| Gene Type | protein-coding | GO ID | GO:0006810 | UniProtAcc | Q9NQC8 |
Top |
Malignant transformation analysis |
| Identification of the aberrant gene expression in precancerous and cancerous lesions by comparing the gene expression of stem-like cells in diseased tissues with normal stem cells |
| Entrez ID | Symbol | Replicates | Species | Organ | Tissue | Adj P-value | Log2FC | Malignancy |
| 56912 | IFT46 | LZE22D1 | Human | Esophagus | HGIN | 1.23e-03 | 2.27e-01 | 0.0595 |
| 56912 | IFT46 | LZE22T | Human | Esophagus | ESCC | 2.68e-05 | 6.27e-01 | 0.068 |
| 56912 | IFT46 | LZE24T | Human | Esophagus | ESCC | 1.44e-08 | 2.32e-01 | 0.0596 |
| 56912 | IFT46 | P2T-E | Human | Esophagus | ESCC | 2.17e-08 | 8.33e-02 | 0.1177 |
| 56912 | IFT46 | P4T-E | Human | Esophagus | ESCC | 7.60e-20 | 3.97e-01 | 0.1323 |
| 56912 | IFT46 | P5T-E | Human | Esophagus | ESCC | 1.72e-04 | 7.37e-02 | 0.1327 |
| 56912 | IFT46 | P8T-E | Human | Esophagus | ESCC | 1.81e-08 | 1.37e-01 | 0.0889 |
| 56912 | IFT46 | P10T-E | Human | Esophagus | ESCC | 1.03e-08 | 6.87e-02 | 0.116 |
| 56912 | IFT46 | P11T-E | Human | Esophagus | ESCC | 2.28e-10 | 2.89e-01 | 0.1426 |
| 56912 | IFT46 | P12T-E | Human | Esophagus | ESCC | 2.36e-11 | 2.62e-01 | 0.1122 |
| 56912 | IFT46 | P15T-E | Human | Esophagus | ESCC | 3.01e-09 | 8.82e-02 | 0.1149 |
| 56912 | IFT46 | P16T-E | Human | Esophagus | ESCC | 2.73e-13 | 2.35e-01 | 0.1153 |
| 56912 | IFT46 | P20T-E | Human | Esophagus | ESCC | 3.53e-04 | 4.84e-02 | 0.1124 |
| 56912 | IFT46 | P21T-E | Human | Esophagus | ESCC | 9.80e-13 | 1.80e-01 | 0.1617 |
| 56912 | IFT46 | P22T-E | Human | Esophagus | ESCC | 4.19e-06 | 5.59e-02 | 0.1236 |
| 56912 | IFT46 | P23T-E | Human | Esophagus | ESCC | 6.83e-08 | 1.24e-01 | 0.108 |
| 56912 | IFT46 | P24T-E | Human | Esophagus | ESCC | 6.95e-14 | 8.98e-02 | 0.1287 |
| 56912 | IFT46 | P26T-E | Human | Esophagus | ESCC | 5.48e-16 | 3.10e-01 | 0.1276 |
| 56912 | IFT46 | P27T-E | Human | Esophagus | ESCC | 2.03e-09 | 1.35e-01 | 0.1055 |
| 56912 | IFT46 | P28T-E | Human | Esophagus | ESCC | 7.28e-10 | 5.77e-02 | 0.1149 |
| Page: 1 2 3 |
| Tissue | Expression Dynamics | Abbreviation |
| Esophagus | 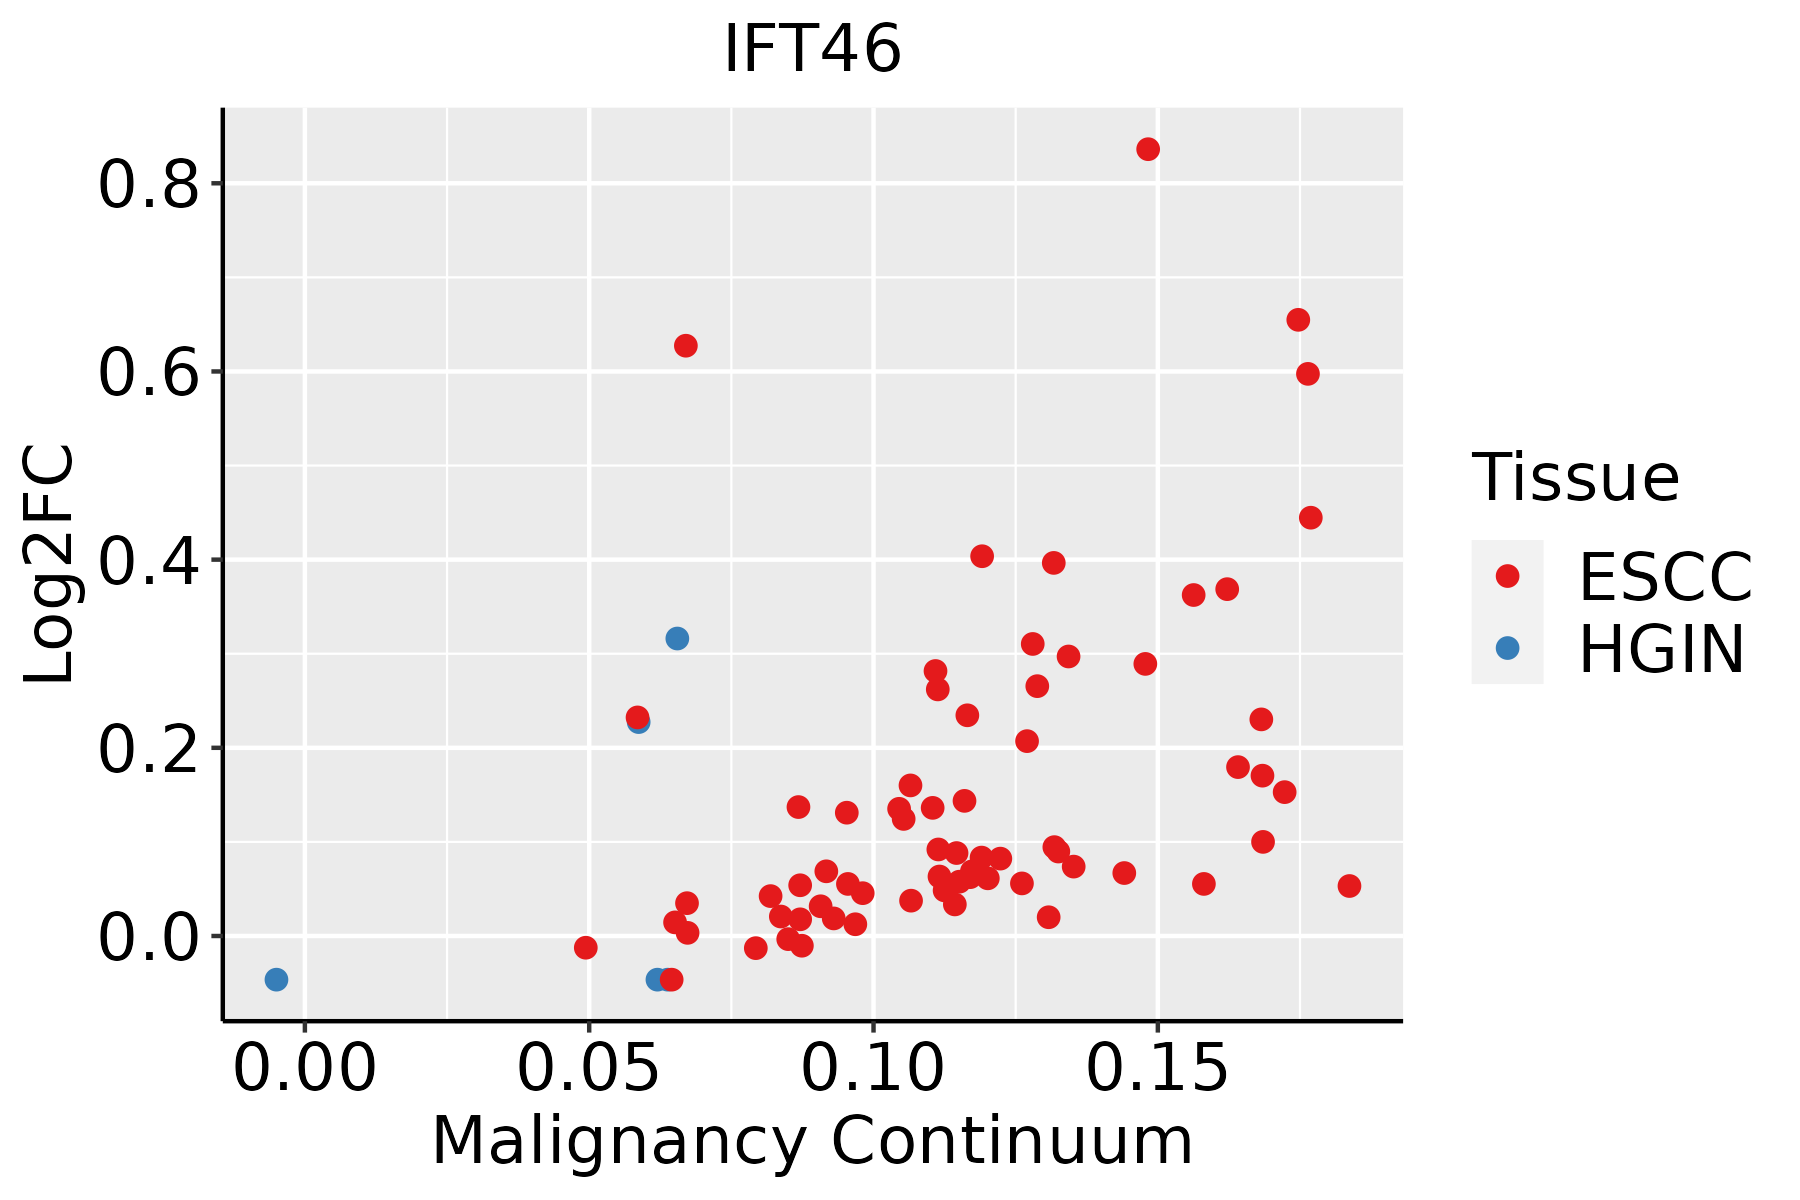 | ESCC: Esophageal squamous cell carcinoma |
| HGIN: High-grade intraepithelial neoplasias | ||
| LGIN: Low-grade intraepithelial neoplasias |
| ∗log2FC in expression of this searched gene in stem-like cells from each diseased tissue sample relative to stem-like cells in normal samples in each tissue plotted against the malignancy continuum. Samples are colored based on if they are from different disease stage. |
Top |
Malignant transformation related pathway analysis |
| Find out the enriched GO biological processes and KEGG pathways involved in transition from healthy to precancer to cancer |
| Tissue | Disease Stage | Enriched GO biological Processes |
| Colorectum | AD |  |
| Colorectum | SER |  |
| Colorectum | MSS |  |
| Colorectum | MSI-H |  |
| Colorectum | FAP |  |
| ∗Top 15 enriched GO BP terms are showed in the bar plot of each disease state in each tissue. Each row represents a significant GO biological process which is colored according to the -log10(p.adjust). |
| Page: 1 2 3 4 5 6 7 8 9 |
| GO ID | Tissue | Disease Stage | Description | Gene Ratio | Bg Ratio | pvalue | p.adjust | Count |
| GO:003164727 | Esophagus | HGIN | regulation of protein stability | 96/2587 | 298/18723 | 2.21e-16 | 5.76e-14 | 96 |
| GO:005082127 | Esophagus | HGIN | protein stabilization | 64/2587 | 191/18723 | 3.11e-12 | 4.24e-10 | 64 |
| GO:00315035 | Esophagus | HGIN | protein-containing complex localization | 50/2587 | 220/18723 | 2.18e-04 | 3.98e-03 | 50 |
| GO:003070517 | Esophagus | HGIN | cytoskeleton-dependent intracellular transport | 45/2587 | 195/18723 | 3.07e-04 | 5.15e-03 | 45 |
| GO:00109707 | Esophagus | HGIN | transport along microtubule | 35/2587 | 155/18723 | 2.01e-03 | 2.12e-02 | 35 |
| GO:0031647111 | Esophagus | ESCC | regulation of protein stability | 223/8552 | 298/18723 | 5.76e-25 | 1.52e-22 | 223 |
| GO:0050821111 | Esophagus | ESCC | protein stabilization | 140/8552 | 191/18723 | 6.50e-15 | 3.61e-13 | 140 |
| GO:003070518 | Esophagus | ESCC | cytoskeleton-dependent intracellular transport | 133/8552 | 195/18723 | 1.48e-10 | 4.27e-09 | 133 |
| GO:001097013 | Esophagus | ESCC | transport along microtubule | 107/8552 | 155/18723 | 3.17e-09 | 6.80e-08 | 107 |
| GO:003150314 | Esophagus | ESCC | protein-containing complex localization | 139/8552 | 220/18723 | 1.14e-07 | 1.85e-06 | 139 |
| GO:00991114 | Esophagus | ESCC | microtubule-based transport | 115/8552 | 190/18723 | 2.54e-05 | 2.15e-04 | 115 |
| Page: 1 |
| Pathway ID | Tissue | Disease Stage | Description | Gene Ratio | Bg Ratio | pvalue | p.adjust | qvalue | Count |
| Page: 1 |
Top |
Cell-cell communication analysis |
| Identification of potential cell-cell interactions between two cell types and their ligand-receptor pairs for different disease states |
| Ligand | Receptor | LRpair | Pathway | Tissue | Disease Stage |
| Page: 1 |
Top |
Single-cell gene regulatory network inference analysis |
| Find out the significant the regulons (TFs) and the target genes of each regulon across cell types for different disease states |
| TF | Cell Type | Tissue | Disease Stage | Target Gene | RSS | Regulon Activity |
| ∗The dot plots of a searched regulon are shown for all cell subpopulations in each disease state of each tissue based on the regulon specific score inferred using pySCENIC and by calculating the average expression. |
| Page: 1 |
Top |
Somatic mutation of malignant transformation related genes |
| Annotation of somatic variants for genes involved in malignant transformation |
| Hugo Symbol | Variant Class | Variant Classification | dbSNP RS | HGVSc | HGVSp | HGVSp Short | SWISSPROT | BIOTYPE | SIFT | PolyPhen | Tumor Sample Barcode | Tissue | Histology | Sex | Age | Stage | Therapy Types | Drugs | Outcome |
| IFT46 | SNV | Missense_Mutation | c.835N>A | p.Pro279Thr | p.P279T | Q9NQC8 | protein_coding | deleterious(0.04) | benign(0.278) | TCGA-A8-A09A-01 | Breast | breast invasive carcinoma | Female | <65 | I/II | Hormone Therapy | tamoxiphen | SD | |
| IFT46 | SNV | Missense_Mutation | rs782623965 | c.515N>A | p.Arg172His | p.R172H | Q9NQC8 | protein_coding | deleterious(0.01) | possibly_damaging(0.795) | TCGA-AR-A1AL-01 | Breast | breast invasive carcinoma | Female | <65 | III/IV | Hormone Therapy | anastrozole | SD |
| IFT46 | insertion | Nonsense_Mutation | novel | c.904_905insCCTGCCTCAGATTGCTGTCCCCGGGGAGTTAATGCATCTAC | p.Val302AlafsTer11 | p.V302Afs*11 | Q9NQC8 | protein_coding | TCGA-BH-A0GZ-01 | Breast | breast invasive carcinoma | Female | <65 | I/II | Hormone Therapy | arimidex | SD | ||
| IFT46 | SNV | Missense_Mutation | c.532N>A | p.Asp178Asn | p.D178N | Q9NQC8 | protein_coding | deleterious(0.04) | possibly_damaging(0.529) | TCGA-EK-A2H0-01 | Cervix | cervical & endocervical cancer | Female | <65 | I/II | Chemotherapy | cisplatin | CR | |
| IFT46 | SNV | Missense_Mutation | c.377N>T | p.Ser126Phe | p.S126F | Q9NQC8 | protein_coding | deleterious(0.01) | probably_damaging(0.914) | TCGA-Q1-A73O-01 | Cervix | cervical & endocervical cancer | Female | <65 | I/II | Chemotherapy | cisplatin | CR | |
| IFT46 | SNV | Missense_Mutation | c.532N>A | p.Asp178Asn | p.D178N | Q9NQC8 | protein_coding | deleterious(0.04) | possibly_damaging(0.529) | TCGA-ZJ-A8QQ-01 | Cervix | cervical & endocervical cancer | Female | <65 | I/II | Chemotherapy | cisplatin | SD | |
| IFT46 | SNV | Missense_Mutation | rs782595984 | c.724C>T | p.Arg242Cys | p.R242C | Q9NQC8 | protein_coding | deleterious(0.01) | probably_damaging(0.994) | TCGA-A6-2686-01 | Colorectum | colon adenocarcinoma | Female | >=65 | I/II | Unknown | Unknown | SD |
| IFT46 | SNV | Missense_Mutation | c.1056N>C | p.Leu352Phe | p.L352F | Q9NQC8 | protein_coding | deleterious_low_confidence(0.02) | possibly_damaging(0.748) | TCGA-AA-3510-01 | Colorectum | colon adenocarcinoma | Male | >=65 | I/II | Unknown | Unknown | SD | |
| IFT46 | SNV | Missense_Mutation | rs782595984 | c.724N>T | p.Arg242Cys | p.R242C | Q9NQC8 | protein_coding | deleterious(0.01) | probably_damaging(0.994) | TCGA-AD-6895-01 | Colorectum | colon adenocarcinoma | Male | >=65 | III/IV | Unknown | Unknown | SD |
| IFT46 | SNV | Missense_Mutation | novel | c.647A>C | p.Lys216Thr | p.K216T | Q9NQC8 | protein_coding | tolerated(0.37) | benign(0.056) | TCGA-F5-6814-01 | Colorectum | rectum adenocarcinoma | Male | <65 | I/II | Unknown | Unknown | SD |
| Page: 1 2 3 4 |
Top |
Related drugs of malignant transformation related genes |
| Identification of chemicals and drugs interact with genes involved in malignant transfromation |
| (DGIdb 4.0) |
| Entrez ID | Symbol | Category | Interaction Types | Drug Claim Name | Drug Name | PMIDs |
| Page: 1 |

Copyright 2023-Present -The University of Texas Health Science Center at Houston |