
|
|||||
|
 | |
| |
| |
| |
| |
| |
|
Gene: IFT43 |
Gene summary for IFT43 |
| Gene information | Species | Human | Gene symbol | IFT43 | Gene ID | 112752 |
| Gene name | intraflagellar transport 43 | |
| Gene Alias | C14orf179 | |
| Cytomap | 14q24.3 | |
| Gene Type | protein-coding | GO ID | GO:0006810 | UniProtAcc | Q96FT9 |
Top |
Malignant transformation analysis |
| Identification of the aberrant gene expression in precancerous and cancerous lesions by comparing the gene expression of stem-like cells in diseased tissues with normal stem cells |
| Entrez ID | Symbol | Replicates | Species | Organ | Tissue | Adj P-value | Log2FC | Malignancy |
| 112752 | IFT43 | LZE4T | Human | Esophagus | ESCC | 6.08e-18 | 4.35e-01 | 0.0811 |
| 112752 | IFT43 | LZE5T | Human | Esophagus | ESCC | 1.60e-04 | 3.70e-01 | 0.0514 |
| 112752 | IFT43 | LZE8T | Human | Esophagus | ESCC | 4.46e-10 | 3.38e-01 | 0.067 |
| 112752 | IFT43 | LZE20T | Human | Esophagus | ESCC | 1.69e-09 | 3.59e-01 | 0.0662 |
| 112752 | IFT43 | LZE22D1 | Human | Esophagus | HGIN | 1.35e-06 | 2.13e-01 | 0.0595 |
| 112752 | IFT43 | LZE22T | Human | Esophagus | ESCC | 4.20e-03 | 4.19e-01 | 0.068 |
| 112752 | IFT43 | LZE24T | Human | Esophagus | ESCC | 7.09e-23 | 7.10e-01 | 0.0596 |
| 112752 | IFT43 | LZE21T | Human | Esophagus | ESCC | 8.10e-03 | 3.12e-01 | 0.0655 |
| 112752 | IFT43 | LZE6T | Human | Esophagus | ESCC | 2.86e-09 | 3.55e-01 | 0.0845 |
| 112752 | IFT43 | P1T-E | Human | Esophagus | ESCC | 1.66e-11 | 5.04e-01 | 0.0875 |
| 112752 | IFT43 | P2T-E | Human | Esophagus | ESCC | 1.76e-41 | 7.80e-01 | 0.1177 |
| 112752 | IFT43 | P4T-E | Human | Esophagus | ESCC | 1.77e-42 | 8.23e-01 | 0.1323 |
| 112752 | IFT43 | P5T-E | Human | Esophagus | ESCC | 1.32e-29 | 5.23e-01 | 0.1327 |
| 112752 | IFT43 | P8T-E | Human | Esophagus | ESCC | 3.38e-54 | 8.96e-01 | 0.0889 |
| 112752 | IFT43 | P9T-E | Human | Esophagus | ESCC | 2.29e-16 | 4.46e-01 | 0.1131 |
| 112752 | IFT43 | P10T-E | Human | Esophagus | ESCC | 1.60e-47 | 8.94e-01 | 0.116 |
| 112752 | IFT43 | P11T-E | Human | Esophagus | ESCC | 4.12e-18 | 8.06e-01 | 0.1426 |
| 112752 | IFT43 | P12T-E | Human | Esophagus | ESCC | 8.33e-45 | 8.41e-01 | 0.1122 |
| 112752 | IFT43 | P15T-E | Human | Esophagus | ESCC | 6.35e-53 | 1.10e+00 | 0.1149 |
| 112752 | IFT43 | P16T-E | Human | Esophagus | ESCC | 1.12e-34 | 6.89e-01 | 0.1153 |
| Page: 1 2 3 4 5 6 |
| Tissue | Expression Dynamics | Abbreviation |
| Esophagus | 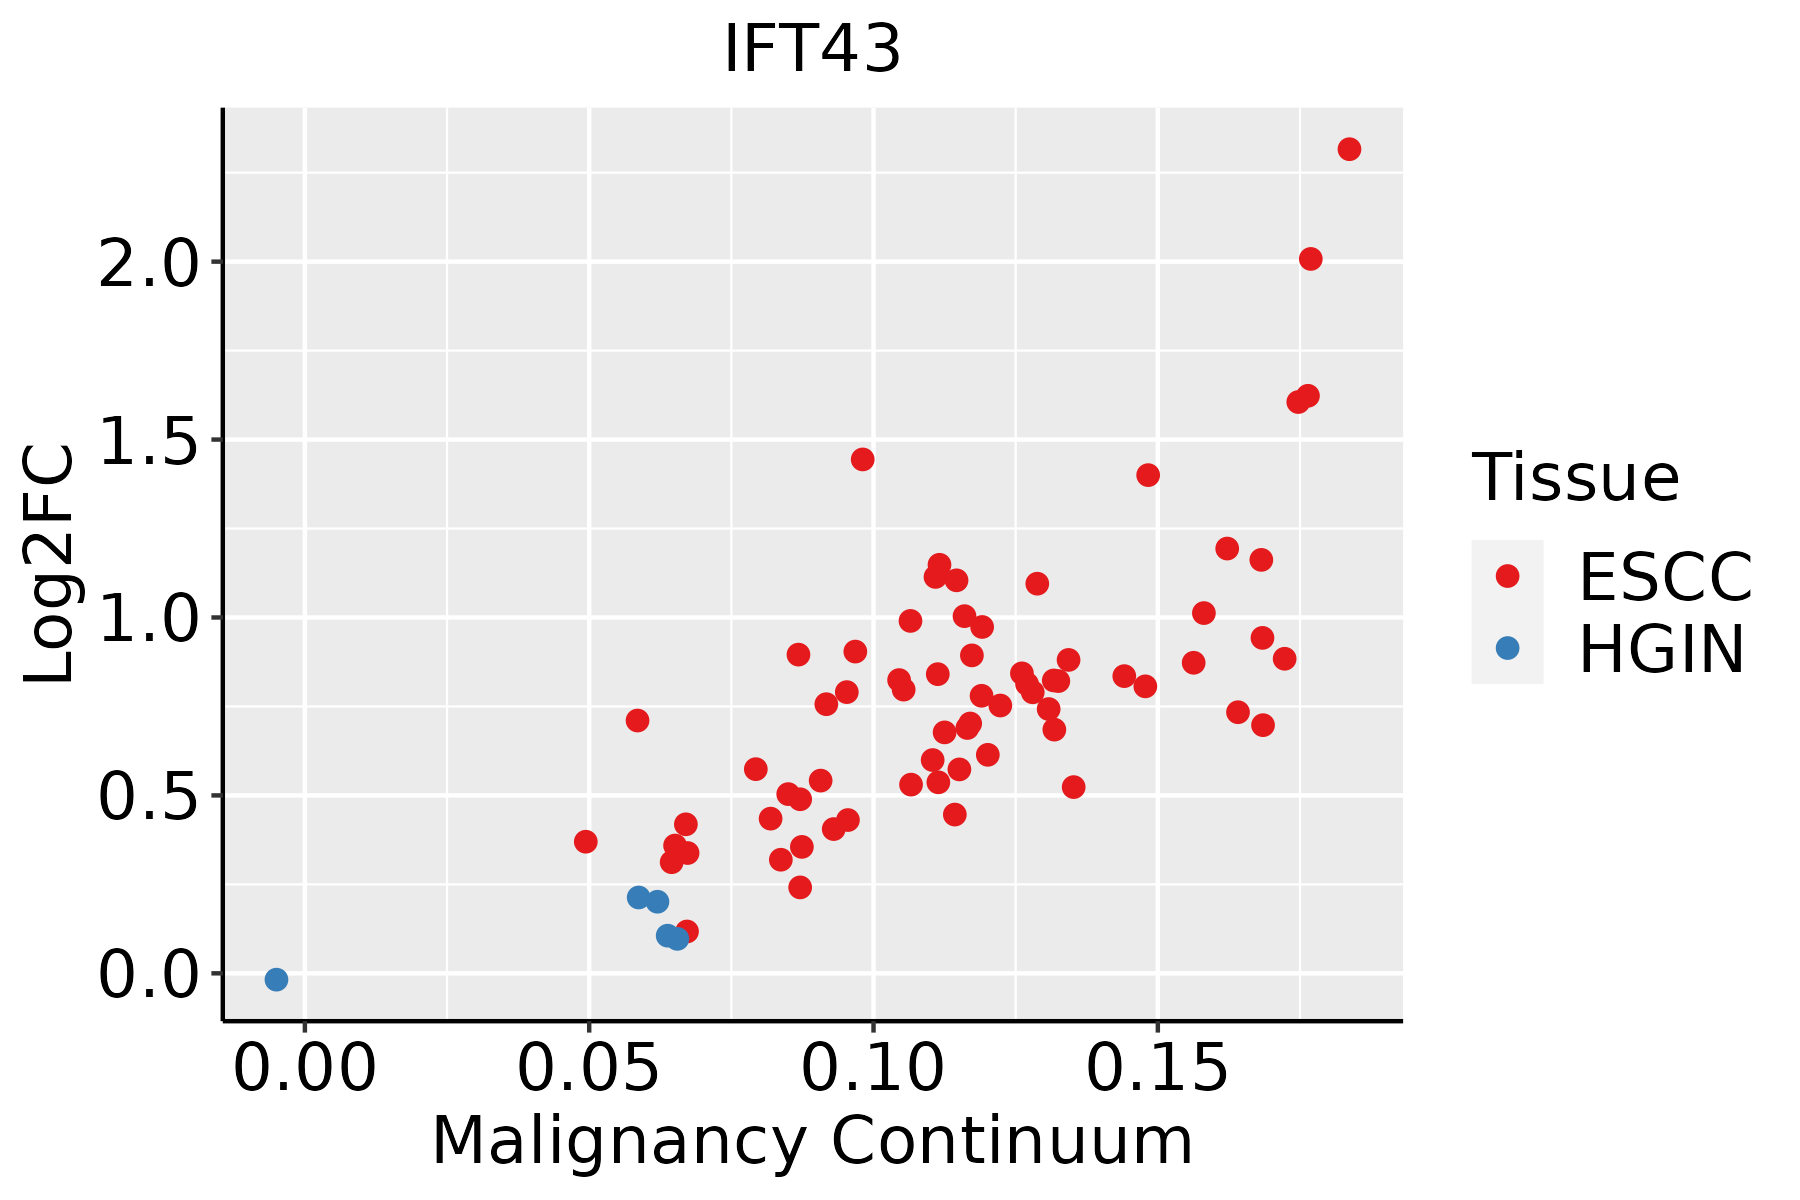 | ESCC: Esophageal squamous cell carcinoma |
| HGIN: High-grade intraepithelial neoplasias | ||
| LGIN: Low-grade intraepithelial neoplasias | ||
| Liver | 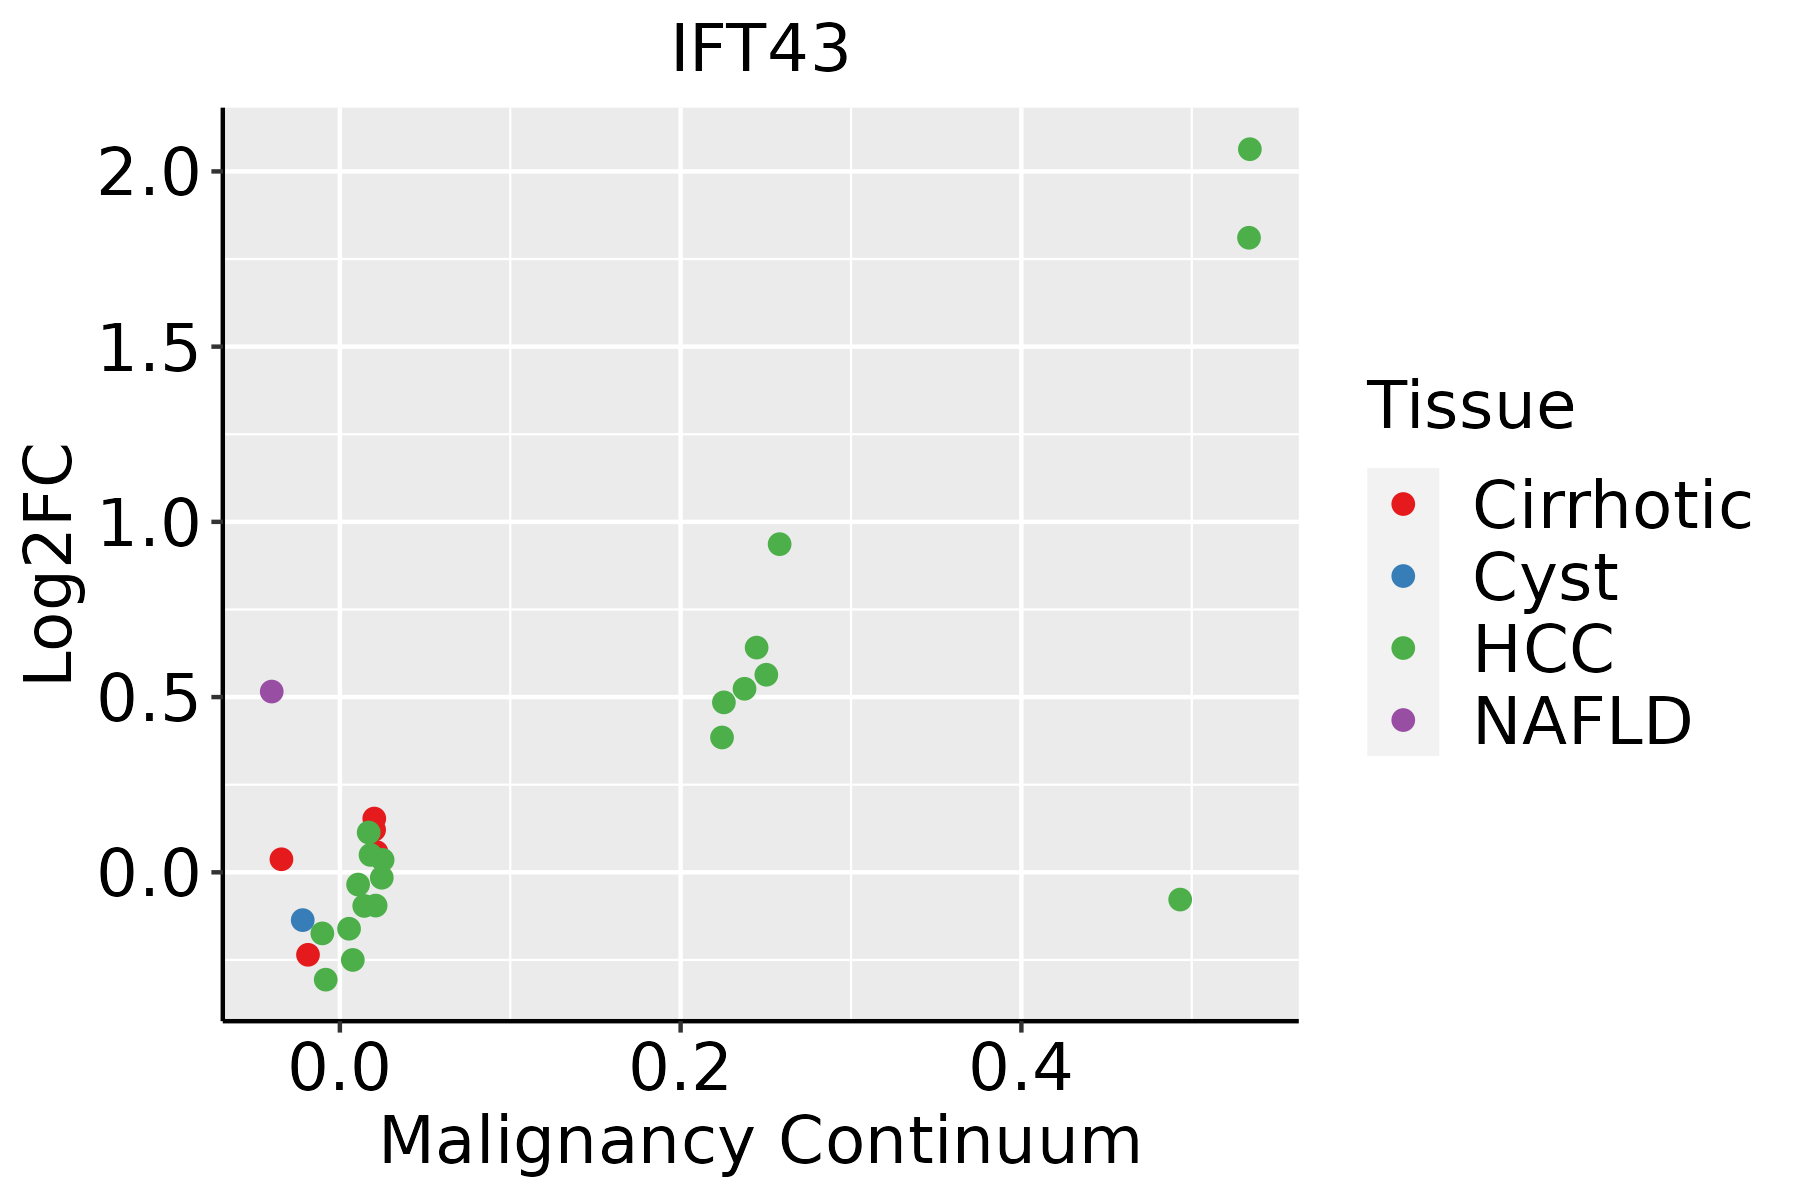 | HCC: Hepatocellular carcinoma |
| NAFLD: Non-alcoholic fatty liver disease | ||
| Oral Cavity |  | EOLP: Erosive Oral lichen planus |
| LP: leukoplakia | ||
| NEOLP: Non-erosive oral lichen planus | ||
| OSCC: Oral squamous cell carcinoma | ||
| Skin | 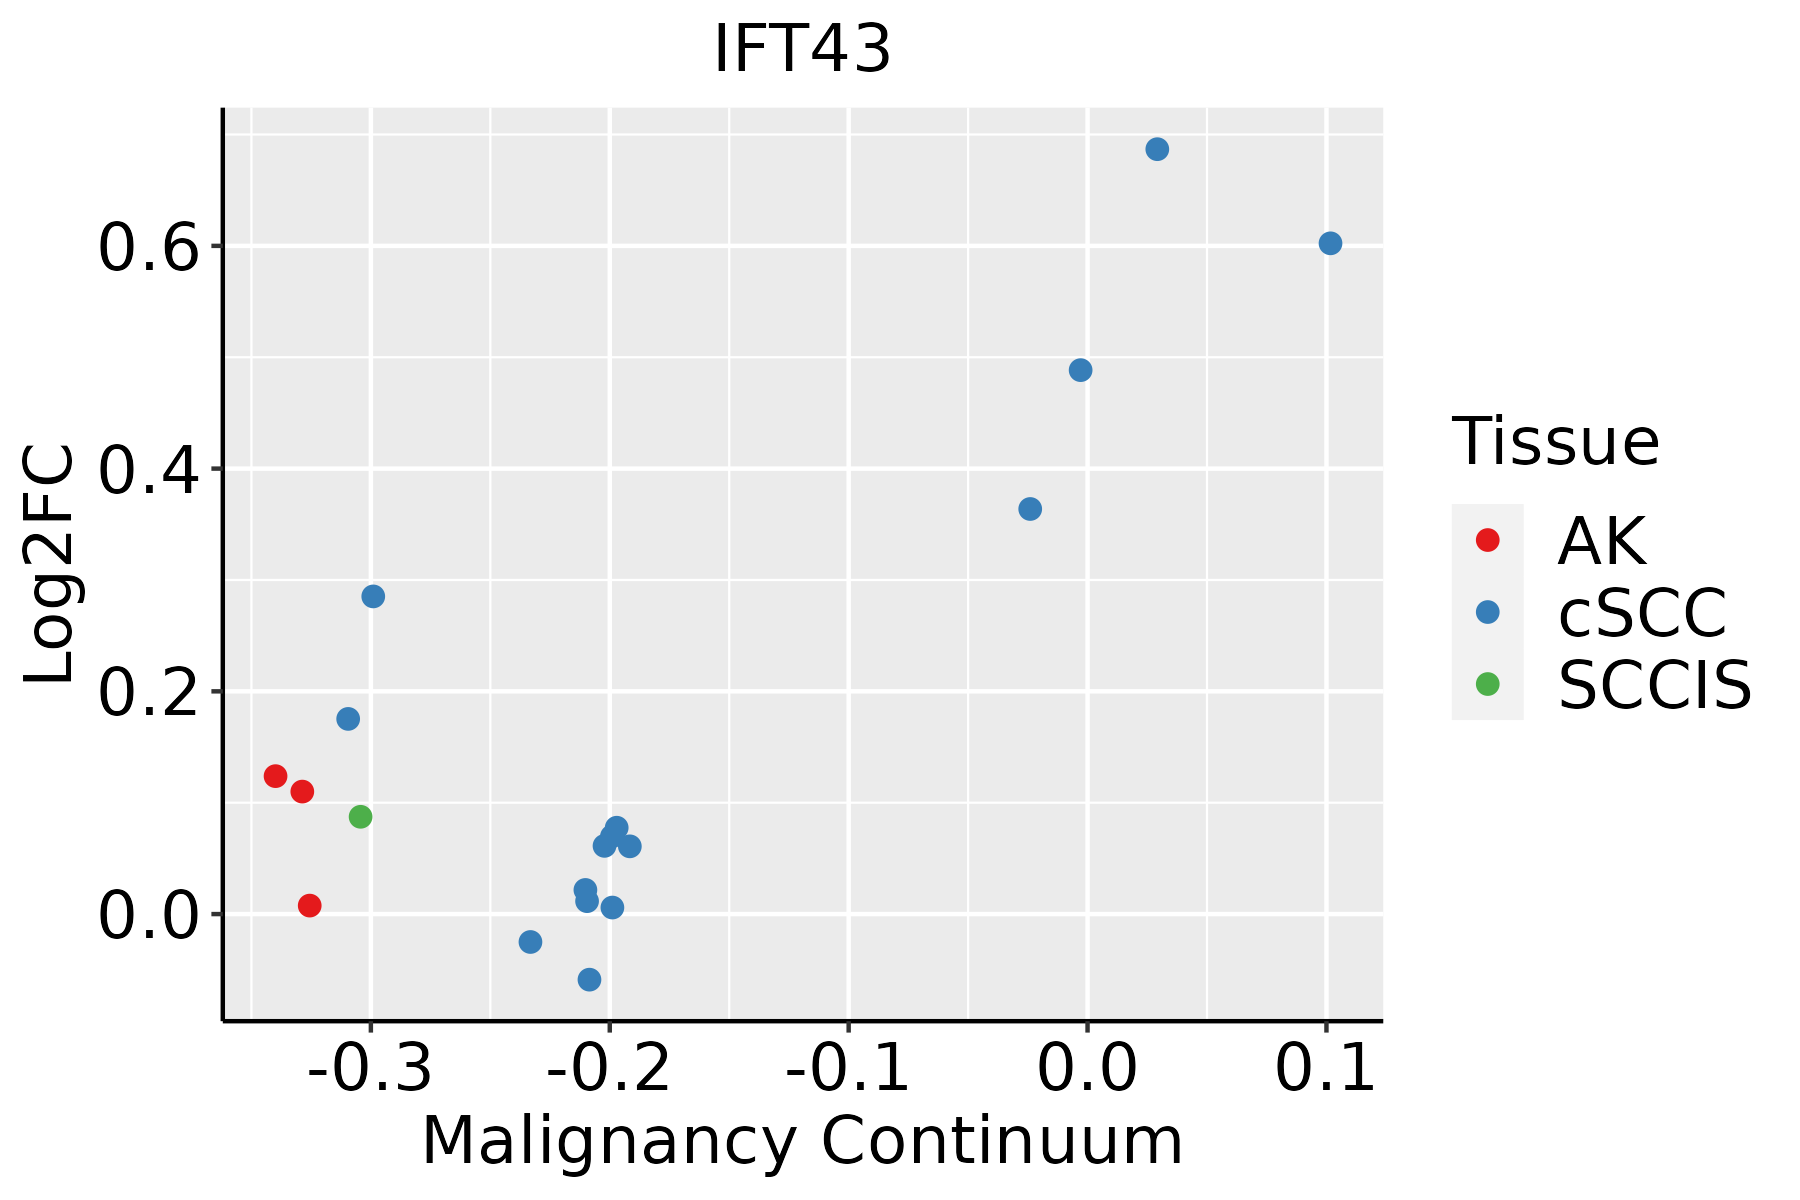 | AK: Actinic keratosis |
| cSCC: Cutaneous squamous cell carcinoma | ||
| SCCIS:squamous cell carcinoma in situ | ||
| Thyroid | 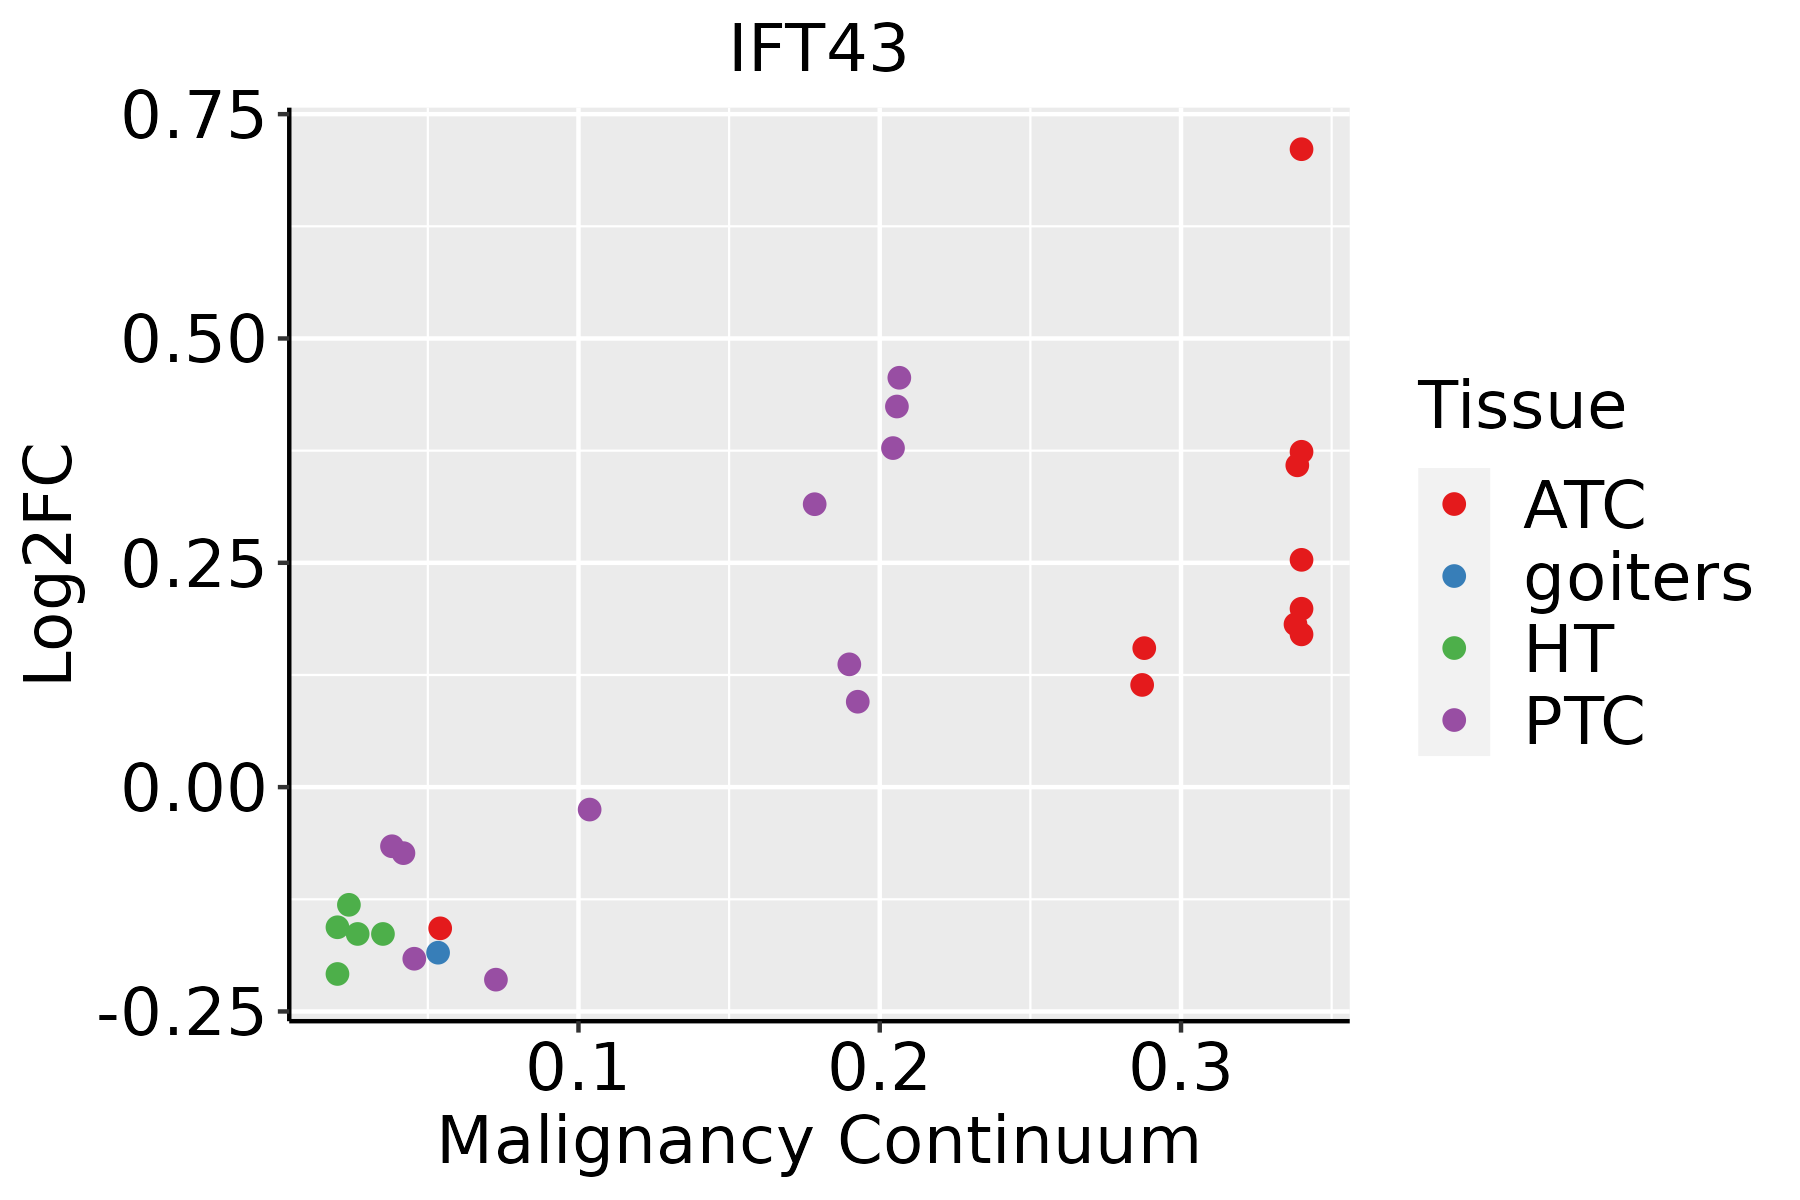 | ATC: Anaplastic thyroid cancer |
| HT: Hashimoto's thyroiditis | ||
| PTC: Papillary thyroid cancer |
| ∗log2FC in expression of this searched gene in stem-like cells from each diseased tissue sample relative to stem-like cells in normal samples in each tissue plotted against the malignancy continuum. Samples are colored based on if they are from different disease stage. |
Top |
Malignant transformation related pathway analysis |
| Find out the enriched GO biological processes and KEGG pathways involved in transition from healthy to precancer to cancer |
| Tissue | Disease Stage | Enriched GO biological Processes |
| Colorectum | AD |  |
| Colorectum | SER |  |
| Colorectum | MSS |  |
| Colorectum | MSI-H |  |
| Colorectum | FAP |  |
| ∗Top 15 enriched GO BP terms are showed in the bar plot of each disease state in each tissue. Each row represents a significant GO biological process which is colored according to the -log10(p.adjust). |
| Page: 1 2 3 4 5 6 7 8 9 |
| GO ID | Tissue | Disease Stage | Description | Gene Ratio | Bg Ratio | pvalue | p.adjust | Count |
| GO:00315035 | Esophagus | HGIN | protein-containing complex localization | 50/2587 | 220/18723 | 2.18e-04 | 3.98e-03 | 50 |
| GO:003070517 | Esophagus | HGIN | cytoskeleton-dependent intracellular transport | 45/2587 | 195/18723 | 3.07e-04 | 5.15e-03 | 45 |
| GO:00109707 | Esophagus | HGIN | transport along microtubule | 35/2587 | 155/18723 | 2.01e-03 | 2.12e-02 | 35 |
| GO:003070518 | Esophagus | ESCC | cytoskeleton-dependent intracellular transport | 133/8552 | 195/18723 | 1.48e-10 | 4.27e-09 | 133 |
| GO:001097013 | Esophagus | ESCC | transport along microtubule | 107/8552 | 155/18723 | 3.17e-09 | 6.80e-08 | 107 |
| GO:003150314 | Esophagus | ESCC | protein-containing complex localization | 139/8552 | 220/18723 | 1.14e-07 | 1.85e-06 | 139 |
| GO:00991114 | Esophagus | ESCC | microtubule-based transport | 115/8552 | 190/18723 | 2.54e-05 | 2.15e-04 | 115 |
| GO:00307055 | Liver | NAFLD | cytoskeleton-dependent intracellular transport | 33/1882 | 195/18723 | 1.98e-03 | 1.98e-02 | 33 |
| GO:00109703 | Liver | NAFLD | transport along microtubule | 26/1882 | 155/18723 | 6.30e-03 | 4.69e-02 | 26 |
| GO:003070511 | Liver | Cirrhotic | cytoskeleton-dependent intracellular transport | 68/4634 | 195/18723 | 9.54e-04 | 6.77e-03 | 68 |
| GO:0031503 | Liver | Cirrhotic | protein-containing complex localization | 75/4634 | 220/18723 | 1.13e-03 | 7.73e-03 | 75 |
| GO:00109701 | Liver | Cirrhotic | transport along microtubule | 52/4634 | 155/18723 | 8.42e-03 | 3.91e-02 | 52 |
| GO:00315031 | Liver | HCC | protein-containing complex localization | 129/7958 | 220/18723 | 9.38e-07 | 1.42e-05 | 129 |
| GO:003070521 | Liver | HCC | cytoskeleton-dependent intracellular transport | 111/7958 | 195/18723 | 3.25e-05 | 3.28e-04 | 111 |
| GO:00109702 | Liver | HCC | transport along microtubule | 90/7958 | 155/18723 | 6.49e-05 | 5.92e-04 | 90 |
| GO:003070510 | Oral cavity | OSCC | cytoskeleton-dependent intracellular transport | 113/7305 | 195/18723 | 6.03e-08 | 1.09e-06 | 113 |
| GO:00315034 | Oral cavity | OSCC | protein-containing complex localization | 123/7305 | 220/18723 | 2.54e-07 | 4.00e-06 | 123 |
| GO:00109706 | Oral cavity | OSCC | transport along microtubule | 88/7305 | 155/18723 | 5.35e-06 | 6.02e-05 | 88 |
| GO:00991113 | Oral cavity | OSCC | microtubule-based transport | 96/7305 | 190/18723 | 7.92e-04 | 4.27e-03 | 96 |
| GO:003150313 | Oral cavity | LP | protein-containing complex localization | 82/4623 | 220/18723 | 2.08e-05 | 3.44e-04 | 82 |
| Page: 1 2 |
| Pathway ID | Tissue | Disease Stage | Description | Gene Ratio | Bg Ratio | pvalue | p.adjust | qvalue | Count |
| Page: 1 |
Top |
Cell-cell communication analysis |
| Identification of potential cell-cell interactions between two cell types and their ligand-receptor pairs for different disease states |
| Ligand | Receptor | LRpair | Pathway | Tissue | Disease Stage |
| Page: 1 |
Top |
Single-cell gene regulatory network inference analysis |
| Find out the significant the regulons (TFs) and the target genes of each regulon across cell types for different disease states |
| TF | Cell Type | Tissue | Disease Stage | Target Gene | RSS | Regulon Activity |
| ∗The dot plots of a searched regulon are shown for all cell subpopulations in each disease state of each tissue based on the regulon specific score inferred using pySCENIC and by calculating the average expression. |
| Page: 1 |
Top |
Somatic mutation of malignant transformation related genes |
| Annotation of somatic variants for genes involved in malignant transformation |
| Hugo Symbol | Variant Class | Variant Classification | dbSNP RS | HGVSc | HGVSp | HGVSp Short | SWISSPROT | BIOTYPE | SIFT | PolyPhen | Tumor Sample Barcode | Tissue | Histology | Sex | Age | Stage | Therapy Types | Drugs | Outcome |
| IFT43 | SNV | Missense_Mutation | rs537877088 | c.397N>T | p.Arg133Trp | p.R133W | Q96FT9 | protein_coding | deleterious(0) | probably_damaging(0.97) | TCGA-AC-A3TN-01 | Breast | breast invasive carcinoma | Female | >=65 | I/II | Hormone Therapy | arimidex | SD |
| IFT43 | SNV | Missense_Mutation | c.573G>T | p.Glu191Asp | p.E191D | Q96FT9 | protein_coding | deleterious(0.04) | probably_damaging(0.997) | TCGA-C5-A2M2-01 | Cervix | cervical & endocervical cancer | Female | <65 | I/II | Unknown | Unknown | SD | |
| IFT43 | SNV | Missense_Mutation | rs753110306 | c.425N>G | p.Asn142Ser | p.N142S | Q96FT9 | protein_coding | tolerated(0.11) | benign(0.263) | TCGA-5M-AAT6-01 | Colorectum | colon adenocarcinoma | Female | <65 | III/IV | Unknown | Unknown | PD |
| IFT43 | SNV | Missense_Mutation | novel | c.497N>C | p.Leu166Pro | p.L166P | Q96FT9 | protein_coding | deleterious(0) | probably_damaging(0.999) | TCGA-5M-AAT6-01 | Colorectum | colon adenocarcinoma | Female | <65 | III/IV | Unknown | Unknown | PD |
| IFT43 | SNV | Missense_Mutation | rs756700836 | c.217N>A | p.Gly73Ser | p.G73S | Q96FT9 | protein_coding | tolerated(0.95) | benign(0.003) | TCGA-AA-A00N-01 | Colorectum | colon adenocarcinoma | Male | >=65 | I/II | Unknown | Unknown | PD |
| IFT43 | SNV | Missense_Mutation | novel | c.70N>T | p.Arg24Cys | p.R24C | Q96FT9 | protein_coding | deleterious(0) | probably_damaging(1) | TCGA-F5-6814-01 | Colorectum | rectum adenocarcinoma | Male | <65 | I/II | Unknown | Unknown | SD |
| IFT43 | SNV | Missense_Mutation | novel | c.56N>T | p.Arg19Met | p.R19M | Q96FT9 | protein_coding | tolerated(0.11) | possibly_damaging(0.723) | TCGA-A5-A7WJ-01 | Endometrium | uterine corpus endometrioid carcinoma | Female | <65 | I/II | Unknown | Unknown | SD |
| IFT43 | SNV | Missense_Mutation | rs765983098 | c.511N>A | p.Glu171Lys | p.E171K | Q96FT9 | protein_coding | deleterious(0.02) | probably_damaging(0.988) | TCGA-AX-A05Z-01 | Endometrium | uterine corpus endometrioid carcinoma | Female | <65 | III/IV | Chemotherapy | adriamycin | SD |
| IFT43 | SNV | Missense_Mutation | novel | c.565N>C | p.Ser189Pro | p.S189P | Q96FT9 | protein_coding | deleterious(0) | probably_damaging(0.994) | TCGA-AX-A05Z-01 | Endometrium | uterine corpus endometrioid carcinoma | Female | <65 | III/IV | Chemotherapy | adriamycin | SD |
| IFT43 | SNV | Missense_Mutation | c.293N>T | p.Ala98Val | p.A98V | Q96FT9 | protein_coding | tolerated(0.26) | benign(0.006) | TCGA-AX-A06F-01 | Endometrium | uterine corpus endometrioid carcinoma | Female | <65 | III/IV | Chemotherapy | carboplatin | SD |
| Page: 1 2 3 |
Top |
Related drugs of malignant transformation related genes |
| Identification of chemicals and drugs interact with genes involved in malignant transfromation |
| (DGIdb 4.0) |
| Entrez ID | Symbol | Category | Interaction Types | Drug Claim Name | Drug Name | PMIDs |
| Page: 1 |

Copyright 2023-Present -The University of Texas Health Science Center at Houston |