
|
|||||
|
 | |
| |
| |
| |
| |
| |
|
Gene: IFT27 |
Gene summary for IFT27 |
| Gene information | Species | Human | Gene symbol | IFT27 | Gene ID | 11020 |
| Gene name | intraflagellar transport 27 | |
| Gene Alias | BBS19 | |
| Cytomap | 22q12.3 | |
| Gene Type | protein-coding | GO ID | GO:0000003 | UniProtAcc | Q9BW83 |
Top |
Malignant transformation analysis |
| Identification of the aberrant gene expression in precancerous and cancerous lesions by comparing the gene expression of stem-like cells in diseased tissues with normal stem cells |
| Entrez ID | Symbol | Replicates | Species | Organ | Tissue | Adj P-value | Log2FC | Malignancy |
| 11020 | IFT27 | LZE4T | Human | Esophagus | ESCC | 3.69e-10 | 4.17e-01 | 0.0811 |
| 11020 | IFT27 | LZE7T | Human | Esophagus | ESCC | 9.60e-09 | 6.96e-01 | 0.0667 |
| 11020 | IFT27 | LZE24T | Human | Esophagus | ESCC | 9.45e-13 | 4.92e-01 | 0.0596 |
| 11020 | IFT27 | LZE6T | Human | Esophagus | ESCC | 9.23e-04 | 3.88e-01 | 0.0845 |
| 11020 | IFT27 | P1T-E | Human | Esophagus | ESCC | 9.49e-04 | 3.58e-01 | 0.0875 |
| 11020 | IFT27 | P2T-E | Human | Esophagus | ESCC | 2.91e-24 | 5.13e-01 | 0.1177 |
| 11020 | IFT27 | P4T-E | Human | Esophagus | ESCC | 1.14e-28 | 6.87e-01 | 0.1323 |
| 11020 | IFT27 | P5T-E | Human | Esophagus | ESCC | 1.28e-04 | 8.21e-02 | 0.1327 |
| 11020 | IFT27 | P8T-E | Human | Esophagus | ESCC | 6.26e-22 | 4.11e-01 | 0.0889 |
| 11020 | IFT27 | P9T-E | Human | Esophagus | ESCC | 8.98e-17 | 5.37e-01 | 0.1131 |
| 11020 | IFT27 | P10T-E | Human | Esophagus | ESCC | 2.95e-31 | 5.85e-01 | 0.116 |
| 11020 | IFT27 | P11T-E | Human | Esophagus | ESCC | 3.33e-21 | 7.56e-01 | 0.1426 |
| 11020 | IFT27 | P12T-E | Human | Esophagus | ESCC | 6.52e-35 | 6.33e-01 | 0.1122 |
| 11020 | IFT27 | P15T-E | Human | Esophagus | ESCC | 3.85e-27 | 6.66e-01 | 0.1149 |
| 11020 | IFT27 | P16T-E | Human | Esophagus | ESCC | 6.45e-35 | 6.64e-01 | 0.1153 |
| 11020 | IFT27 | P17T-E | Human | Esophagus | ESCC | 3.44e-05 | 2.10e-01 | 0.1278 |
| 11020 | IFT27 | P19T-E | Human | Esophagus | ESCC | 3.72e-09 | 5.59e-01 | 0.1662 |
| 11020 | IFT27 | P20T-E | Human | Esophagus | ESCC | 2.58e-10 | 2.29e-01 | 0.1124 |
| 11020 | IFT27 | P21T-E | Human | Esophagus | ESCC | 4.66e-27 | 4.85e-01 | 0.1617 |
| 11020 | IFT27 | P22T-E | Human | Esophagus | ESCC | 2.81e-47 | 8.68e-01 | 0.1236 |
| Page: 1 2 3 4 5 6 |
| Tissue | Expression Dynamics | Abbreviation |
| Esophagus |  | ESCC: Esophageal squamous cell carcinoma |
| HGIN: High-grade intraepithelial neoplasias | ||
| LGIN: Low-grade intraepithelial neoplasias | ||
| Liver | 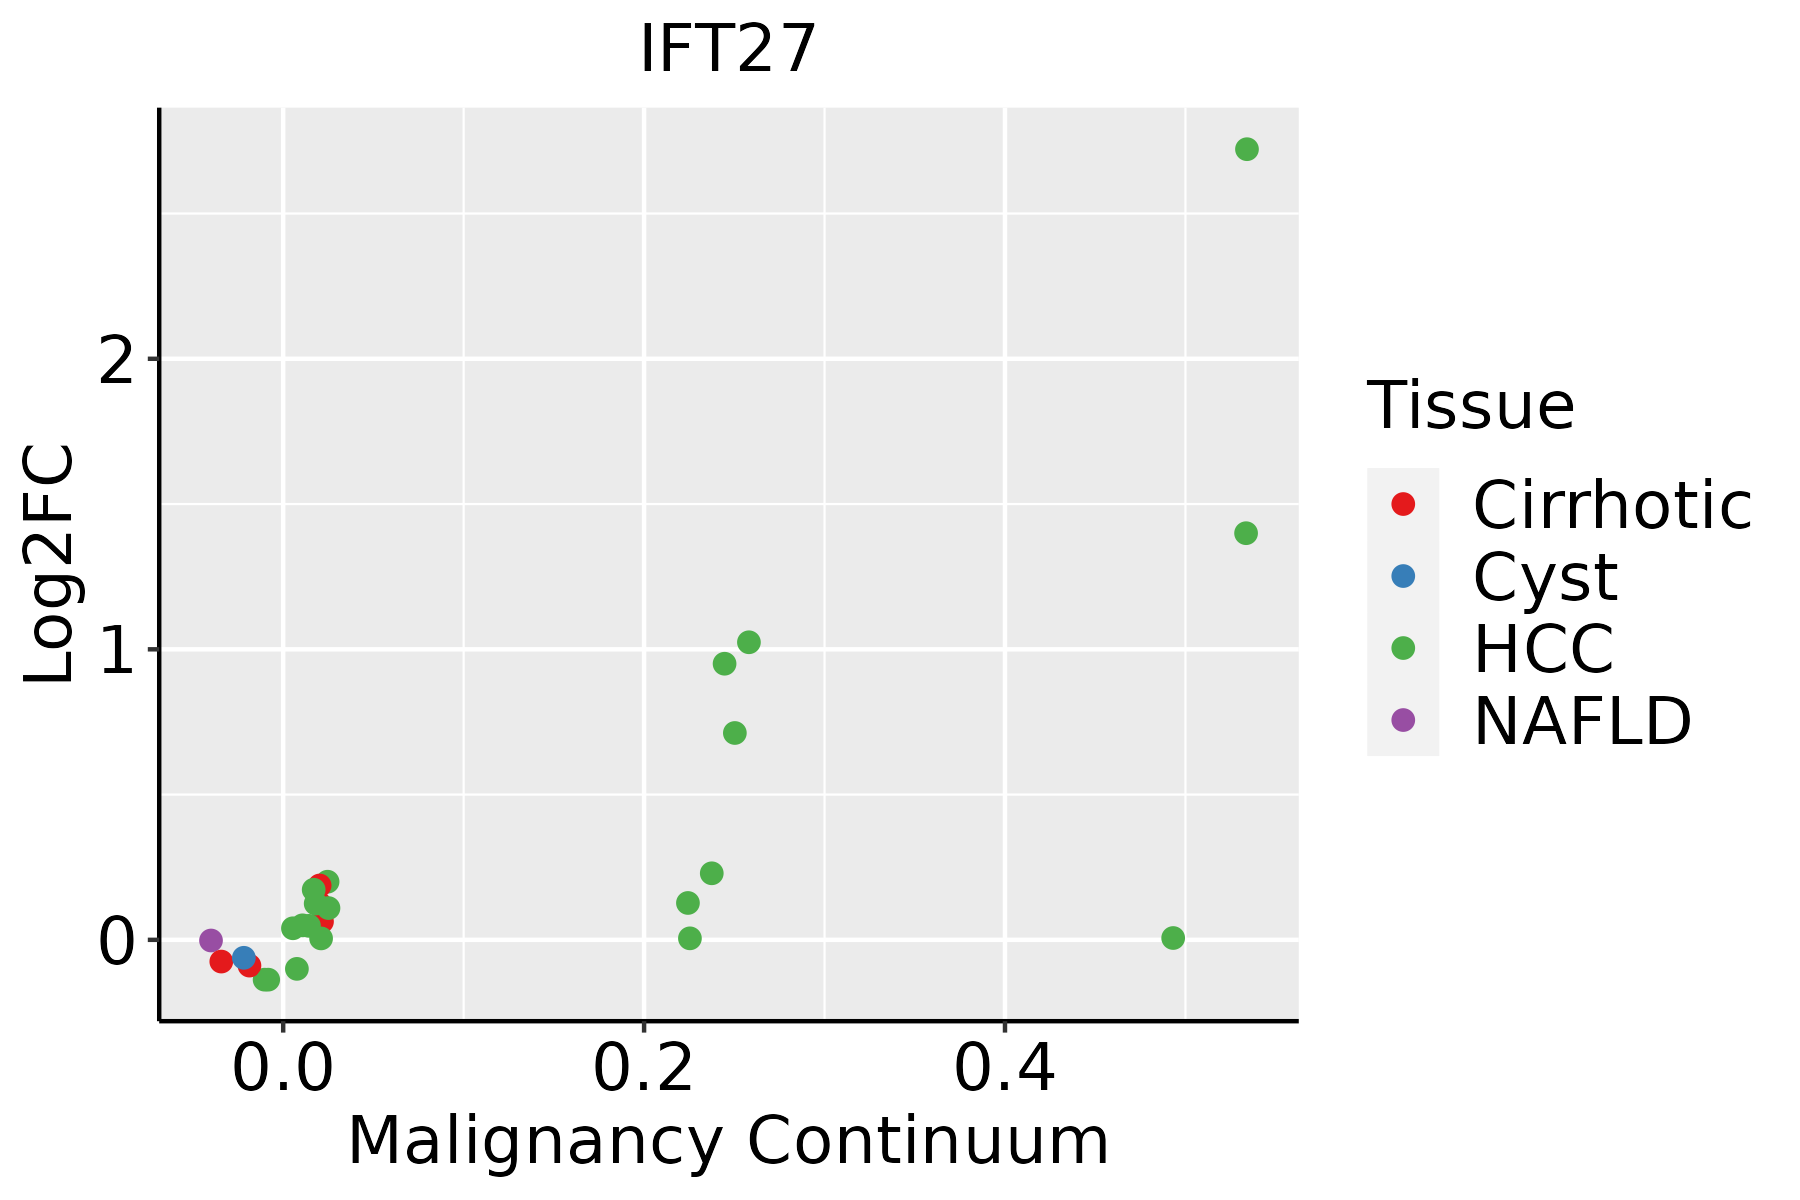 | HCC: Hepatocellular carcinoma |
| NAFLD: Non-alcoholic fatty liver disease | ||
| Oral Cavity |  | EOLP: Erosive Oral lichen planus |
| LP: leukoplakia | ||
| NEOLP: Non-erosive oral lichen planus | ||
| OSCC: Oral squamous cell carcinoma | ||
| Thyroid | 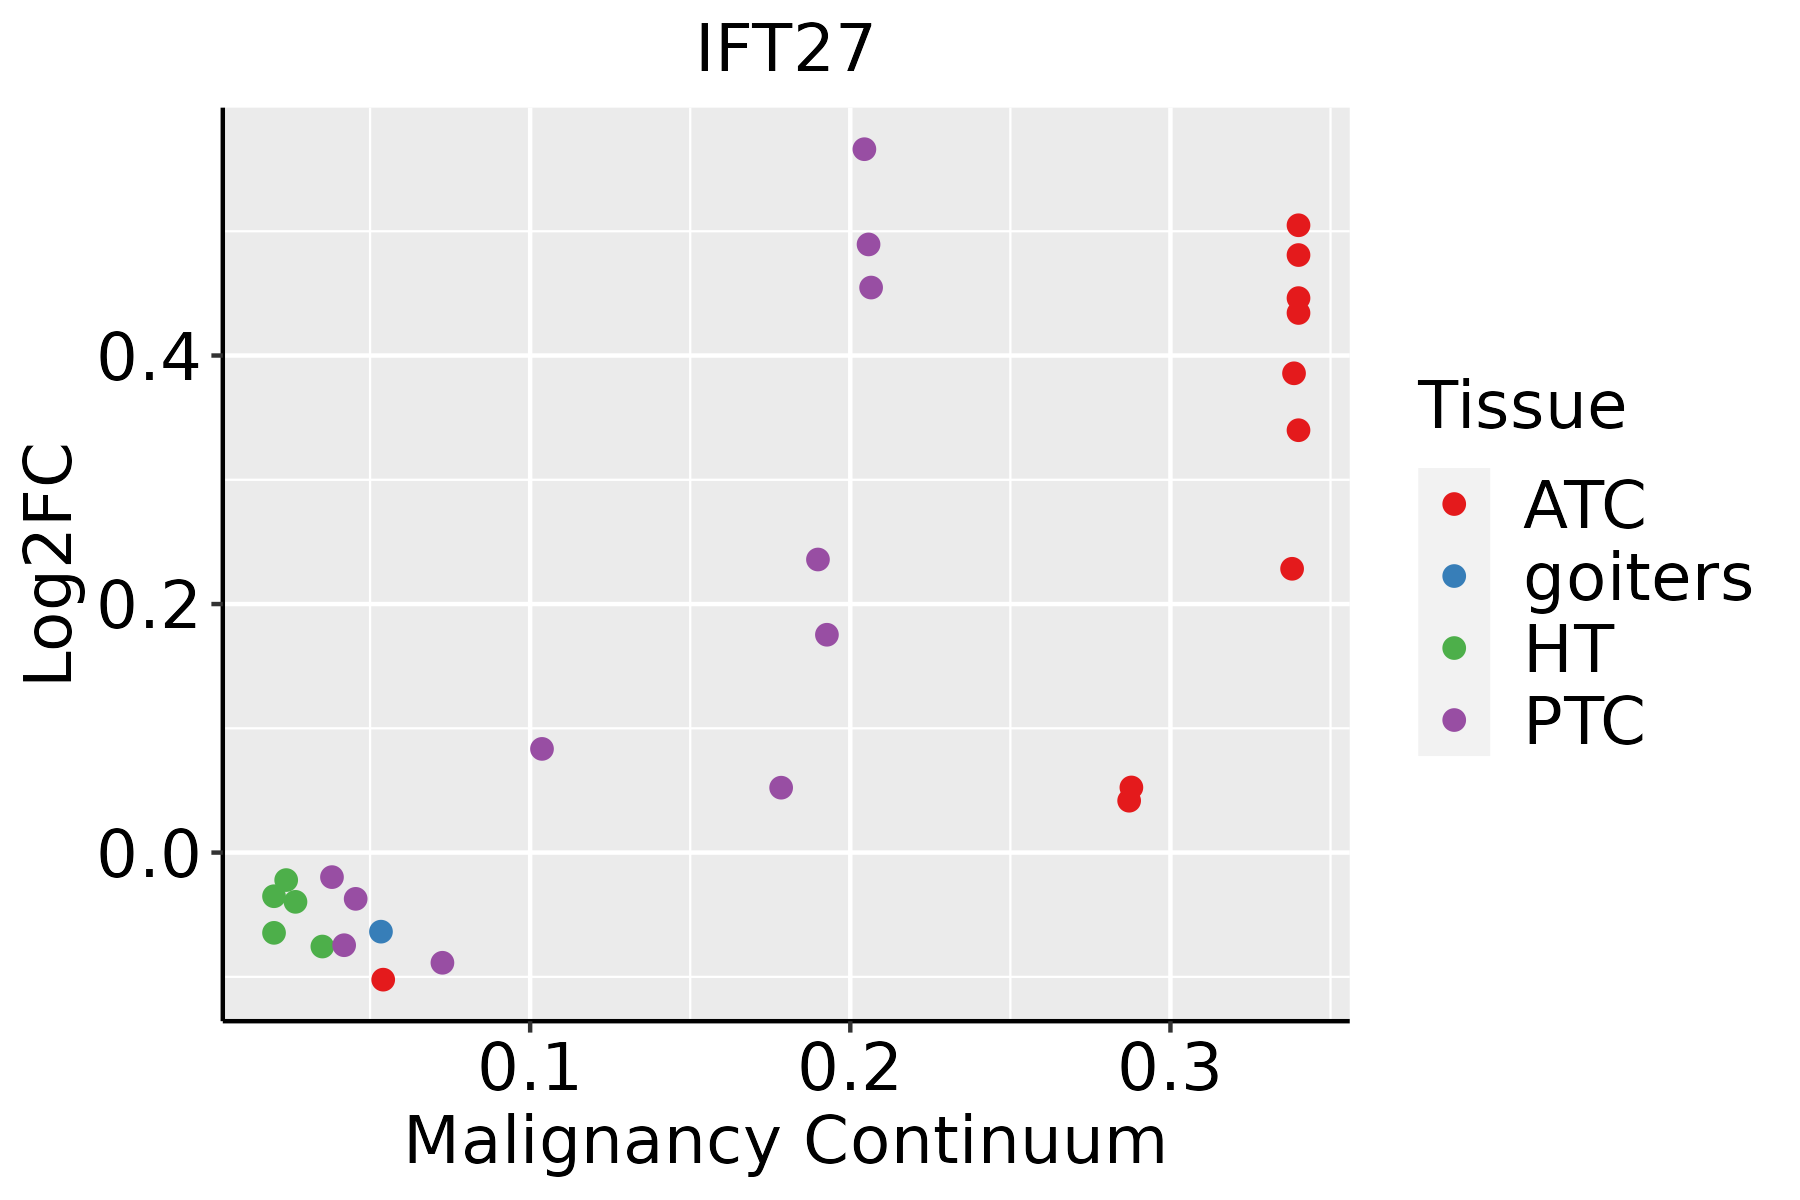 | ATC: Anaplastic thyroid cancer |
| HT: Hashimoto's thyroiditis | ||
| PTC: Papillary thyroid cancer |
| ∗log2FC in expression of this searched gene in stem-like cells from each diseased tissue sample relative to stem-like cells in normal samples in each tissue plotted against the malignancy continuum. Samples are colored based on if they are from different disease stage. |
Top |
Malignant transformation related pathway analysis |
| Find out the enriched GO biological processes and KEGG pathways involved in transition from healthy to precancer to cancer |
| Tissue | Disease Stage | Enriched GO biological Processes |
| Colorectum | AD |  |
| Colorectum | SER |  |
| Colorectum | MSS |  |
| Colorectum | MSI-H |  |
| Colorectum | FAP |  |
| ∗Top 15 enriched GO BP terms are showed in the bar plot of each disease state in each tissue. Each row represents a significant GO biological process which is colored according to the -log10(p.adjust). |
| Page: 1 2 3 4 5 6 7 8 9 |
| GO ID | Tissue | Disease Stage | Description | Gene Ratio | Bg Ratio | pvalue | p.adjust | Count |
| GO:003070518 | Esophagus | ESCC | cytoskeleton-dependent intracellular transport | 133/8552 | 195/18723 | 1.48e-10 | 4.27e-09 | 133 |
| GO:001097013 | Esophagus | ESCC | transport along microtubule | 107/8552 | 155/18723 | 3.17e-09 | 6.80e-08 | 107 |
| GO:003150314 | Esophagus | ESCC | protein-containing complex localization | 139/8552 | 220/18723 | 1.14e-07 | 1.85e-06 | 139 |
| GO:00991114 | Esophagus | ESCC | microtubule-based transport | 115/8552 | 190/18723 | 2.54e-05 | 2.15e-04 | 115 |
| GO:00016559 | Esophagus | ESCC | urogenital system development | 177/8552 | 338/18723 | 7.51e-03 | 2.69e-02 | 177 |
| GO:003070511 | Liver | Cirrhotic | cytoskeleton-dependent intracellular transport | 68/4634 | 195/18723 | 9.54e-04 | 6.77e-03 | 68 |
| GO:0031503 | Liver | Cirrhotic | protein-containing complex localization | 75/4634 | 220/18723 | 1.13e-03 | 7.73e-03 | 75 |
| GO:00109701 | Liver | Cirrhotic | transport along microtubule | 52/4634 | 155/18723 | 8.42e-03 | 3.91e-02 | 52 |
| GO:00315031 | Liver | HCC | protein-containing complex localization | 129/7958 | 220/18723 | 9.38e-07 | 1.42e-05 | 129 |
| GO:003070521 | Liver | HCC | cytoskeleton-dependent intracellular transport | 111/7958 | 195/18723 | 3.25e-05 | 3.28e-04 | 111 |
| GO:00109702 | Liver | HCC | transport along microtubule | 90/7958 | 155/18723 | 6.49e-05 | 5.92e-04 | 90 |
| GO:00016553 | Liver | HCC | urogenital system development | 170/7958 | 338/18723 | 2.15e-03 | 1.08e-02 | 170 |
| GO:00018222 | Liver | HCC | kidney development | 148/7958 | 293/18723 | 3.25e-03 | 1.49e-02 | 148 |
| GO:00720012 | Liver | HCC | renal system development | 152/7958 | 302/18723 | 3.45e-03 | 1.56e-02 | 152 |
| GO:003070510 | Oral cavity | OSCC | cytoskeleton-dependent intracellular transport | 113/7305 | 195/18723 | 6.03e-08 | 1.09e-06 | 113 |
| GO:00315034 | Oral cavity | OSCC | protein-containing complex localization | 123/7305 | 220/18723 | 2.54e-07 | 4.00e-06 | 123 |
| GO:00109706 | Oral cavity | OSCC | transport along microtubule | 88/7305 | 155/18723 | 5.35e-06 | 6.02e-05 | 88 |
| GO:00991113 | Oral cavity | OSCC | microtubule-based transport | 96/7305 | 190/18723 | 7.92e-04 | 4.27e-03 | 96 |
| GO:00016558 | Oral cavity | OSCC | urogenital system development | 160/7305 | 338/18723 | 1.03e-03 | 5.31e-03 | 160 |
| GO:003150313 | Oral cavity | LP | protein-containing complex localization | 82/4623 | 220/18723 | 2.08e-05 | 3.44e-04 | 82 |
| Page: 1 2 |
| Pathway ID | Tissue | Disease Stage | Description | Gene Ratio | Bg Ratio | pvalue | p.adjust | qvalue | Count |
| Page: 1 |
Top |
Cell-cell communication analysis |
| Identification of potential cell-cell interactions between two cell types and their ligand-receptor pairs for different disease states |
| Ligand | Receptor | LRpair | Pathway | Tissue | Disease Stage |
| Page: 1 |
Top |
Single-cell gene regulatory network inference analysis |
| Find out the significant the regulons (TFs) and the target genes of each regulon across cell types for different disease states |
| TF | Cell Type | Tissue | Disease Stage | Target Gene | RSS | Regulon Activity |
| ∗The dot plots of a searched regulon are shown for all cell subpopulations in each disease state of each tissue based on the regulon specific score inferred using pySCENIC and by calculating the average expression. |
| Page: 1 |
Top |
Somatic mutation of malignant transformation related genes |
| Annotation of somatic variants for genes involved in malignant transformation |
| Hugo Symbol | Variant Class | Variant Classification | dbSNP RS | HGVSc | HGVSp | HGVSp Short | SWISSPROT | BIOTYPE | SIFT | PolyPhen | Tumor Sample Barcode | Tissue | Histology | Sex | Age | Stage | Therapy Types | Drugs | Outcome |
| IFT27 | SNV | Missense_Mutation | novel | c.323G>T | p.Arg108Leu | p.R108L | Q9BW83 | protein_coding | deleterious(0) | possibly_damaging(0.814) | TCGA-Q1-A73S-01 | Cervix | cervical & endocervical cancer | Female | <65 | I/II | Chemotherapy | cisplatin | SD |
| IFT27 | SNV | Missense_Mutation | c.550N>A | p.Ala184Thr | p.A184T | Q9BW83 | protein_coding | tolerated(0.75) | benign(0) | TCGA-F4-6570-01 | Colorectum | colon adenocarcinoma | Female | >=65 | I/II | Unknown | Unknown | SD | |
| IFT27 | SNV | Missense_Mutation | c.551N>T | p.Ala184Val | p.A184V | Q9BW83 | protein_coding | tolerated(0.1) | benign(0) | TCGA-B5-A0K6-01 | Endometrium | uterine corpus endometrioid carcinoma | Female | <65 | I/II | Unknown | Unknown | SD | |
| IFT27 | SNV | Missense_Mutation | rs185871181 | c.77N>A | p.Arg26His | p.R26H | Q9BW83 | protein_coding | tolerated(0.91) | benign(0.003) | TCGA-D1-A174-01 | Endometrium | uterine corpus endometrioid carcinoma | Female | <65 | I/II | Unknown | Unknown | SD |
| IFT27 | SNV | Missense_Mutation | c.65C>G | p.Ala22Gly | p.A22G | Q9BW83 | protein_coding | deleterious(0) | benign(0.186) | TCGA-63-5128-01 | Lung | lung squamous cell carcinoma | Male | Unknown | I/II | Unknown | Unknown | PD | |
| IFT27 | SNV | Missense_Mutation | novel | c.500N>G | p.Leu167Arg | p.L167R | Q9BW83 | protein_coding | deleterious(0) | probably_damaging(0.999) | TCGA-63-A5M9-01 | Lung | lung squamous cell carcinoma | Female | Unknown | I/II | Unknown | Unknown | SD |
| IFT27 | SNV | Missense_Mutation | rs775878094 | c.58G>A | p.Ala20Thr | p.A20T | Q9BW83 | protein_coding | tolerated(0.06) | benign(0.313) | TCGA-J4-A6G1-01 | Prostate | prostate adenocarcinoma | Male | >=65 | 8 | Unknown | Unknown | SD |
| Page: 1 |
Top |
Related drugs of malignant transformation related genes |
| Identification of chemicals and drugs interact with genes involved in malignant transfromation |
| (DGIdb 4.0) |
| Entrez ID | Symbol | Category | Interaction Types | Drug Claim Name | Drug Name | PMIDs |
| Page: 1 |

Copyright 2023-Present -The University of Texas Health Science Center at Houston |