
|
|||||
|
 | |
| |
| |
| |
| |
| |
|
Gene: IFT172 |
Gene summary for IFT172 |
| Gene information | Species | Human | Gene symbol | IFT172 | Gene ID | 26160 |
| Gene name | intraflagellar transport 172 | |
| Gene Alias | BBS20 | |
| Cytomap | 2p23.3 | |
| Gene Type | protein-coding | GO ID | GO:0000226 | UniProtAcc | Q9UG01 |
Top |
Malignant transformation analysis |
| Identification of the aberrant gene expression in precancerous and cancerous lesions by comparing the gene expression of stem-like cells in diseased tissues with normal stem cells |
| Entrez ID | Symbol | Replicates | Species | Organ | Tissue | Adj P-value | Log2FC | Malignancy |
| 26160 | IFT172 | LZE4T | Human | Esophagus | ESCC | 5.33e-03 | 1.17e-01 | 0.0811 |
| 26160 | IFT172 | LZE8T | Human | Esophagus | ESCC | 2.95e-05 | 9.23e-02 | 0.067 |
| 26160 | IFT172 | LZE24T | Human | Esophagus | ESCC | 1.70e-05 | 3.64e-01 | 0.0596 |
| 26160 | IFT172 | LZE21T | Human | Esophagus | ESCC | 2.89e-02 | 3.83e-01 | 0.0655 |
| 26160 | IFT172 | P2T-E | Human | Esophagus | ESCC | 7.02e-12 | 2.38e-01 | 0.1177 |
| 26160 | IFT172 | P4T-E | Human | Esophagus | ESCC | 7.39e-07 | 1.04e-01 | 0.1323 |
| 26160 | IFT172 | P5T-E | Human | Esophagus | ESCC | 3.80e-06 | -9.32e-03 | 0.1327 |
| 26160 | IFT172 | P8T-E | Human | Esophagus | ESCC | 7.48e-08 | 1.10e-01 | 0.0889 |
| 26160 | IFT172 | P9T-E | Human | Esophagus | ESCC | 2.10e-11 | 3.49e-01 | 0.1131 |
| 26160 | IFT172 | P10T-E | Human | Esophagus | ESCC | 1.20e-10 | 1.49e-01 | 0.116 |
| 26160 | IFT172 | P12T-E | Human | Esophagus | ESCC | 8.23e-10 | 5.71e-02 | 0.1122 |
| 26160 | IFT172 | P15T-E | Human | Esophagus | ESCC | 2.87e-14 | 3.76e-01 | 0.1149 |
| 26160 | IFT172 | P16T-E | Human | Esophagus | ESCC | 3.52e-19 | 1.41e-01 | 0.1153 |
| 26160 | IFT172 | P17T-E | Human | Esophagus | ESCC | 4.31e-02 | 2.14e-01 | 0.1278 |
| 26160 | IFT172 | P20T-E | Human | Esophagus | ESCC | 2.89e-13 | 1.46e-01 | 0.1124 |
| 26160 | IFT172 | P21T-E | Human | Esophagus | ESCC | 5.64e-12 | 1.35e-01 | 0.1617 |
| 26160 | IFT172 | P22T-E | Human | Esophagus | ESCC | 6.87e-12 | 5.86e-02 | 0.1236 |
| 26160 | IFT172 | P23T-E | Human | Esophagus | ESCC | 7.65e-12 | 3.08e-01 | 0.108 |
| 26160 | IFT172 | P24T-E | Human | Esophagus | ESCC | 1.28e-16 | 1.18e-01 | 0.1287 |
| 26160 | IFT172 | P26T-E | Human | Esophagus | ESCC | 2.79e-09 | 1.47e-01 | 0.1276 |
| Page: 1 2 3 |
| Tissue | Expression Dynamics | Abbreviation |
| Esophagus | 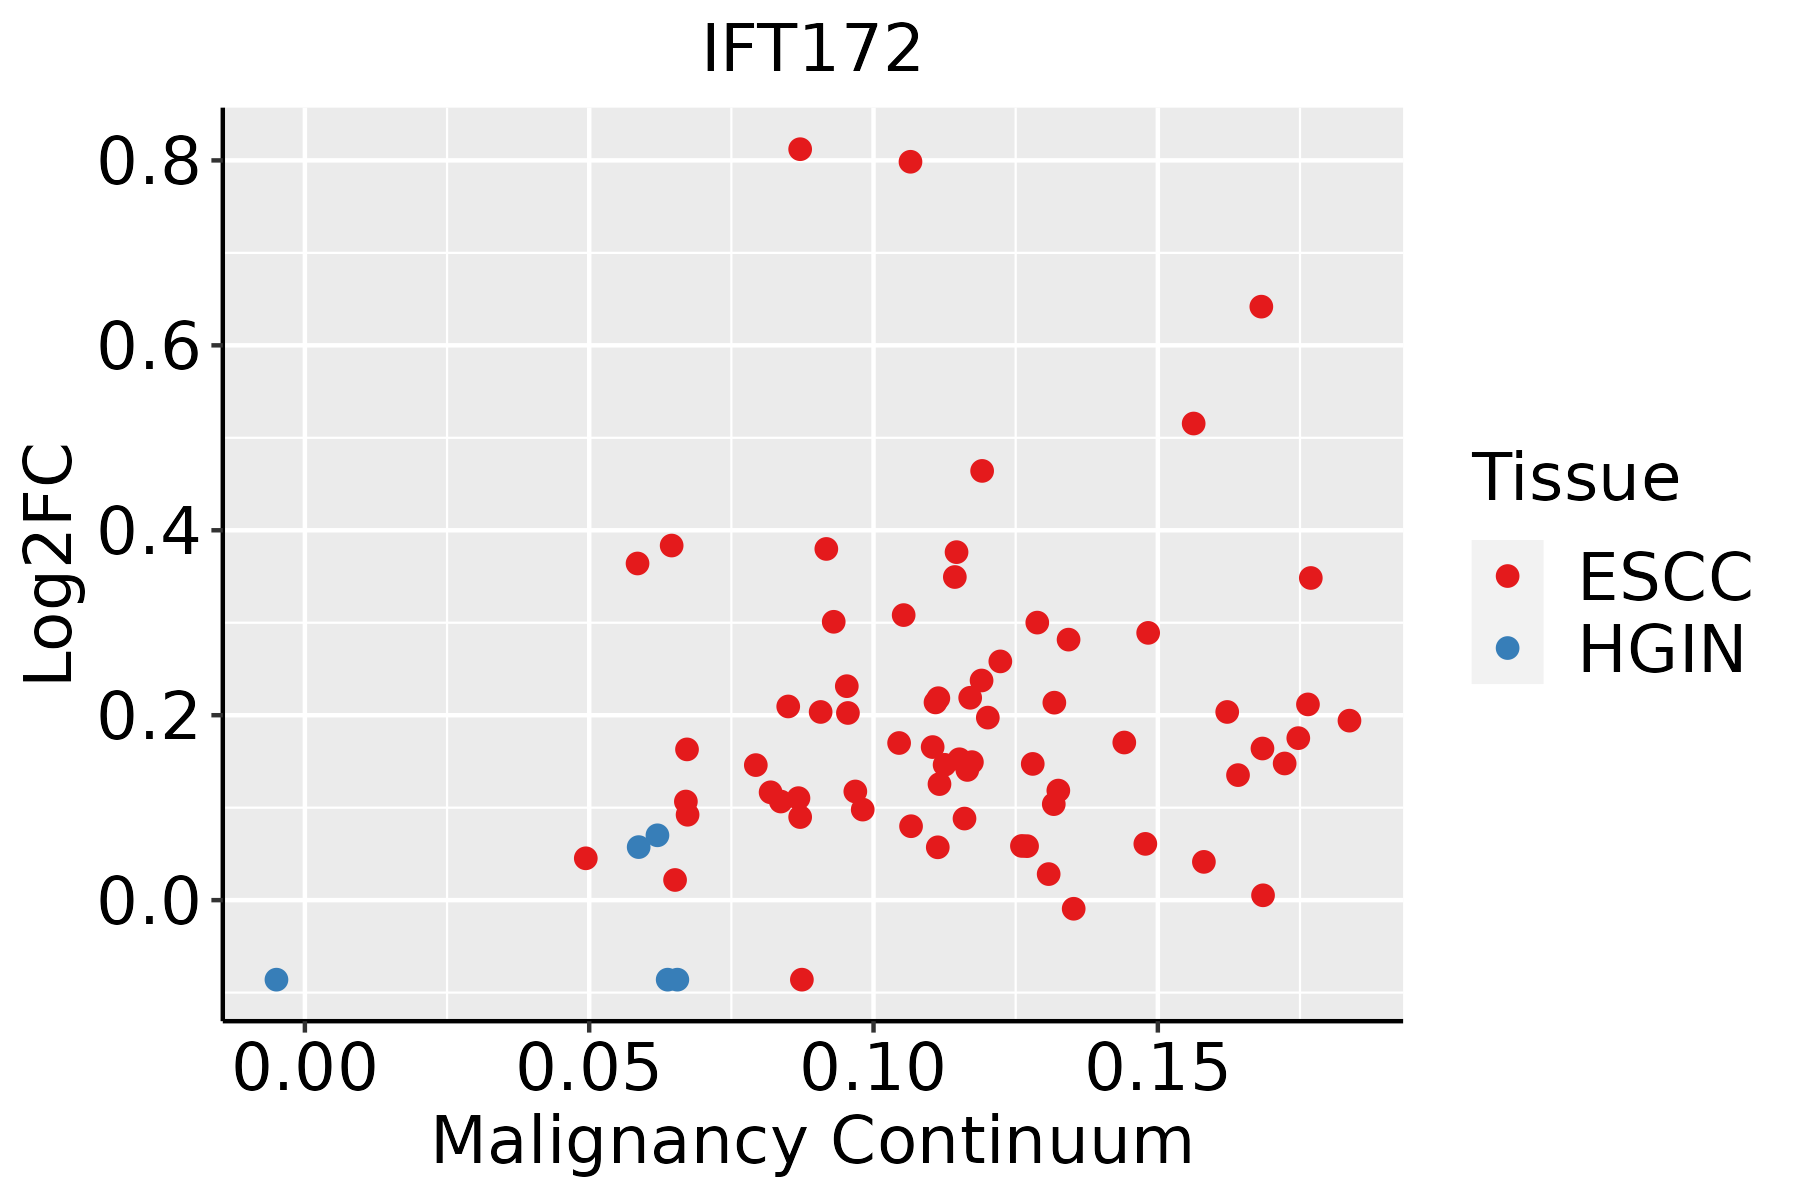 | ESCC: Esophageal squamous cell carcinoma |
| HGIN: High-grade intraepithelial neoplasias | ||
| LGIN: Low-grade intraepithelial neoplasias | ||
| Oral Cavity | 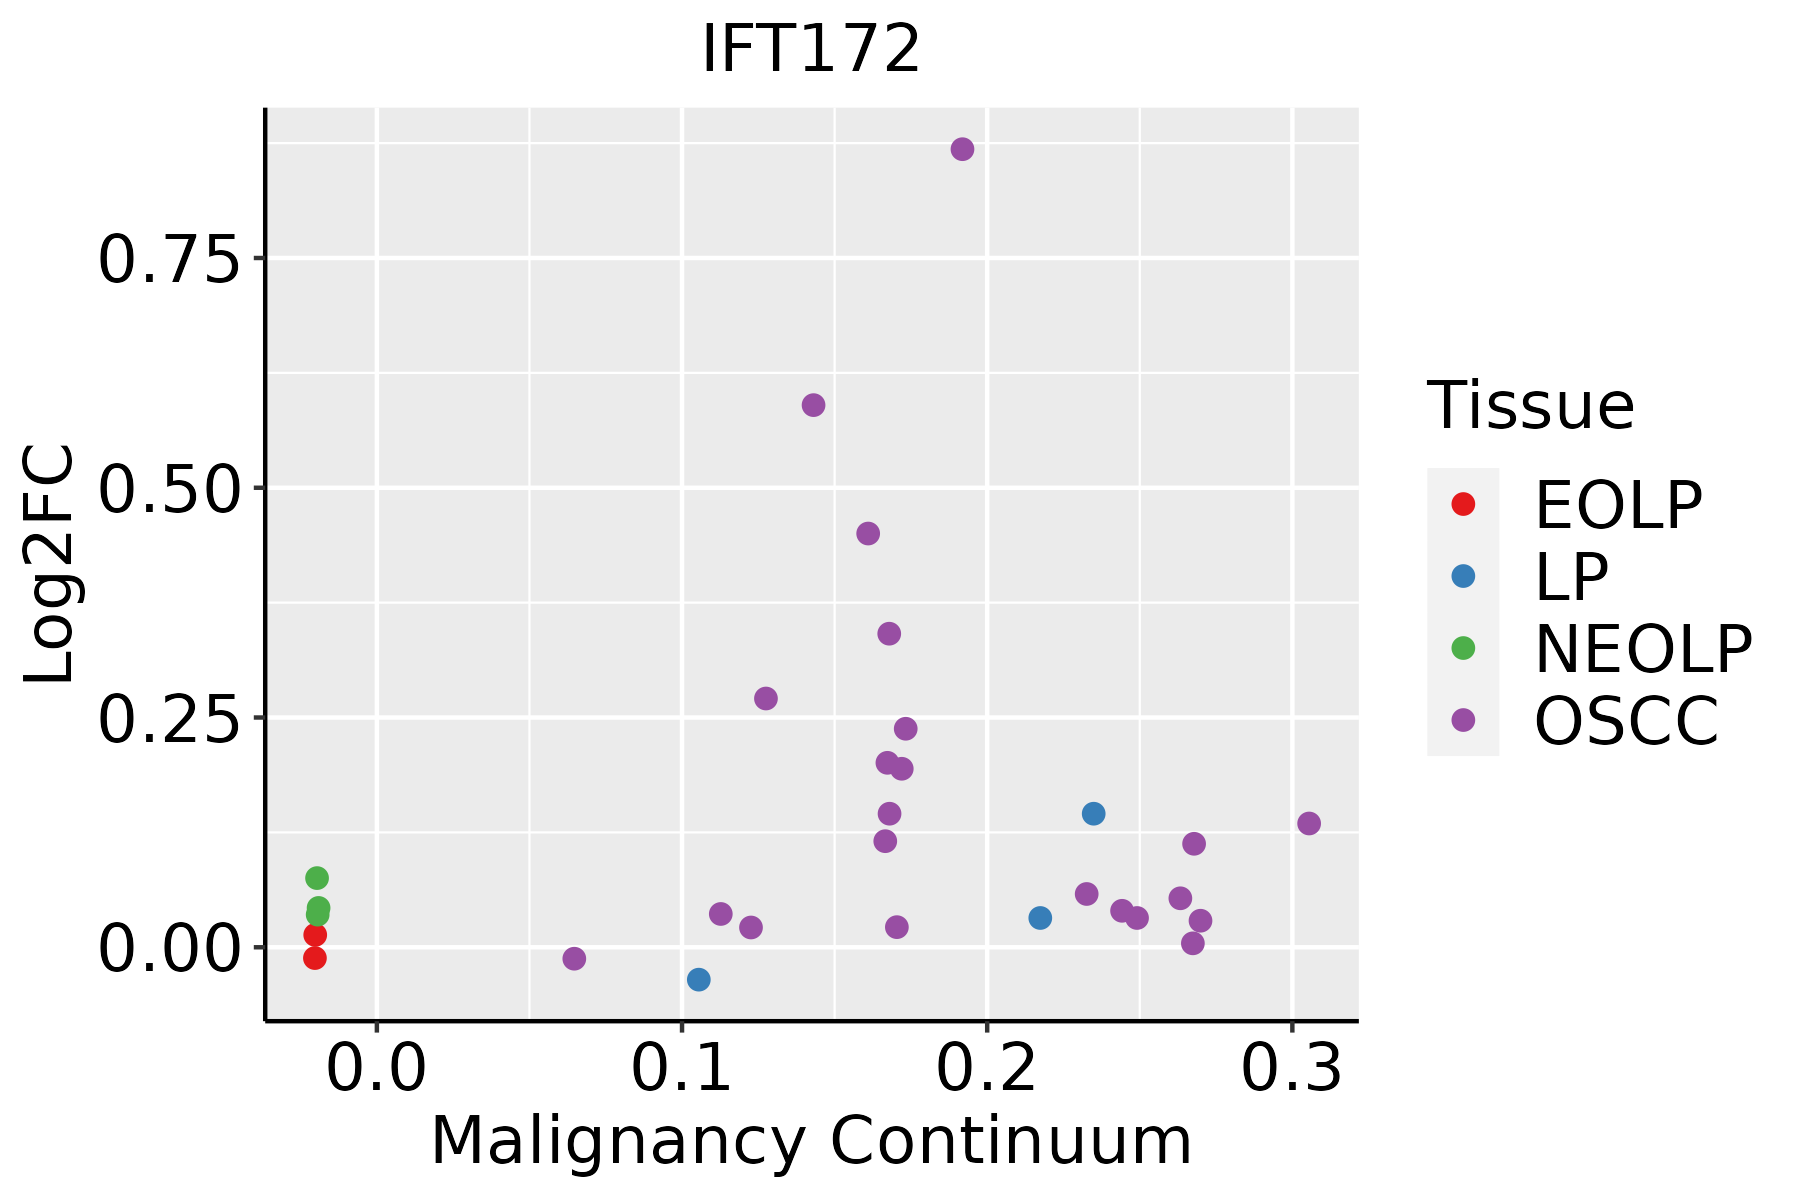 | EOLP: Erosive Oral lichen planus |
| LP: leukoplakia | ||
| NEOLP: Non-erosive oral lichen planus | ||
| OSCC: Oral squamous cell carcinoma |
| ∗log2FC in expression of this searched gene in stem-like cells from each diseased tissue sample relative to stem-like cells in normal samples in each tissue plotted against the malignancy continuum. Samples are colored based on if they are from different disease stage. |
Top |
Malignant transformation related pathway analysis |
| Find out the enriched GO biological processes and KEGG pathways involved in transition from healthy to precancer to cancer |
| Tissue | Disease Stage | Enriched GO biological Processes |
| Colorectum | AD |  |
| Colorectum | SER |  |
| Colorectum | MSS |  |
| Colorectum | MSI-H |  |
| Colorectum | FAP |  |
| ∗Top 15 enriched GO BP terms are showed in the bar plot of each disease state in each tissue. Each row represents a significant GO biological process which is colored according to the -log10(p.adjust). |
| Page: 1 2 3 4 5 6 7 8 9 |
| GO ID | Tissue | Disease Stage | Description | Gene Ratio | Bg Ratio | pvalue | p.adjust | Count |
| GO:005160418 | Esophagus | ESCC | protein maturation | 189/8552 | 294/18723 | 7.64e-11 | 2.39e-09 | 189 |
| GO:003070518 | Esophagus | ESCC | cytoskeleton-dependent intracellular transport | 133/8552 | 195/18723 | 1.48e-10 | 4.27e-09 | 133 |
| GO:001097013 | Esophagus | ESCC | transport along microtubule | 107/8552 | 155/18723 | 3.17e-09 | 6.80e-08 | 107 |
| GO:000184115 | Esophagus | ESCC | neural tube formation | 75/8552 | 102/18723 | 9.68e-09 | 1.95e-07 | 75 |
| GO:000184314 | Esophagus | ESCC | neural tube closure | 66/8552 | 88/18723 | 1.98e-08 | 3.82e-07 | 66 |
| GO:001402014 | Esophagus | ESCC | primary neural tube formation | 69/8552 | 94/18723 | 4.22e-08 | 7.76e-07 | 69 |
| GO:006060614 | Esophagus | ESCC | tube closure | 66/8552 | 89/18723 | 4.24e-08 | 7.76e-07 | 66 |
| GO:003150314 | Esophagus | ESCC | protein-containing complex localization | 139/8552 | 220/18723 | 1.14e-07 | 1.85e-06 | 139 |
| GO:00219159 | Esophagus | ESCC | neural tube development | 101/8552 | 152/18723 | 1.78e-07 | 2.79e-06 | 101 |
| GO:00163316 | Esophagus | ESCC | morphogenesis of embryonic epithelium | 98/8552 | 147/18723 | 2.12e-07 | 3.27e-06 | 98 |
| GO:000183814 | Esophagus | ESCC | embryonic epithelial tube formation | 83/8552 | 121/18723 | 2.78e-07 | 4.08e-06 | 83 |
| GO:000854410 | Esophagus | ESCC | epidermis development | 193/8552 | 324/18723 | 2.87e-07 | 4.19e-06 | 193 |
| GO:003514815 | Esophagus | ESCC | tube formation | 96/8552 | 148/18723 | 1.86e-06 | 2.16e-05 | 96 |
| GO:00721759 | Esophagus | ESCC | epithelial tube formation | 86/8552 | 132/18723 | 4.81e-06 | 5.10e-05 | 86 |
| GO:006056210 | Esophagus | ESCC | epithelial tube morphogenesis | 187/8552 | 325/18723 | 9.95e-06 | 9.44e-05 | 187 |
| GO:00072197 | Esophagus | ESCC | Notch signaling pathway | 106/8552 | 172/18723 | 1.74e-05 | 1.55e-04 | 106 |
| GO:001648514 | Esophagus | ESCC | protein processing | 134/8552 | 225/18723 | 1.81e-05 | 1.60e-04 | 134 |
| GO:00991114 | Esophagus | ESCC | microtubule-based transport | 115/8552 | 190/18723 | 2.54e-05 | 2.15e-04 | 115 |
| GO:005067318 | Esophagus | ESCC | epithelial cell proliferation | 238/8552 | 437/18723 | 1.19e-04 | 8.20e-04 | 238 |
| GO:005067817 | Esophagus | ESCC | regulation of epithelial cell proliferation | 206/8552 | 381/18723 | 5.51e-04 | 3.02e-03 | 206 |
| Page: 1 2 3 |
| Pathway ID | Tissue | Disease Stage | Description | Gene Ratio | Bg Ratio | pvalue | p.adjust | qvalue | Count |
| Page: 1 |
Top |
Cell-cell communication analysis |
| Identification of potential cell-cell interactions between two cell types and their ligand-receptor pairs for different disease states |
| Ligand | Receptor | LRpair | Pathway | Tissue | Disease Stage |
| Page: 1 |
Top |
Single-cell gene regulatory network inference analysis |
| Find out the significant the regulons (TFs) and the target genes of each regulon across cell types for different disease states |
| TF | Cell Type | Tissue | Disease Stage | Target Gene | RSS | Regulon Activity |
| ∗The dot plots of a searched regulon are shown for all cell subpopulations in each disease state of each tissue based on the regulon specific score inferred using pySCENIC and by calculating the average expression. |
| Page: 1 |
Top |
Somatic mutation of malignant transformation related genes |
| Annotation of somatic variants for genes involved in malignant transformation |
| Hugo Symbol | Variant Class | Variant Classification | dbSNP RS | HGVSc | HGVSp | HGVSp Short | SWISSPROT | BIOTYPE | SIFT | PolyPhen | Tumor Sample Barcode | Tissue | Histology | Sex | Age | Stage | Therapy Types | Drugs | Outcome |
| IFT172 | SNV | Missense_Mutation | c.3969N>G | p.Ile1323Met | p.I1323M | Q9UG01 | protein_coding | tolerated(0.21) | benign(0.045) | TCGA-A8-A09G-01 | Breast | breast invasive carcinoma | Female | >=65 | III/IV | Unknown | Unknown | SD | |
| IFT172 | SNV | Missense_Mutation | c.4117N>C | p.Glu1373Gln | p.E1373Q | Q9UG01 | protein_coding | tolerated(0.19) | benign(0.158) | TCGA-AC-A23H-01 | Breast | breast invasive carcinoma | Female | >=65 | I/II | Unknown | Unknown | PD | |
| IFT172 | SNV | Missense_Mutation | novel | c.1406N>A | p.Ala469Asp | p.A469D | Q9UG01 | protein_coding | tolerated(0.12) | benign(0.093) | TCGA-AN-A046-01 | Breast | breast invasive carcinoma | Female | >=65 | I/II | Unknown | Unknown | SD |
| IFT172 | SNV | Missense_Mutation | c.5247G>T | p.Gln1749His | p.Q1749H | Q9UG01 | protein_coding | tolerated_low_confidence(0.37) | benign(0.003) | TCGA-BH-A0BQ-01 | Breast | breast invasive carcinoma | Female | <65 | I/II | Unknown | Unknown | PD | |
| IFT172 | SNV | Missense_Mutation | rs146575848 | c.5005N>A | p.Ala1669Thr | p.A1669T | Q9UG01 | protein_coding | tolerated(0.72) | benign(0) | TCGA-BH-A0E0-01 | Breast | breast invasive carcinoma | Female | <65 | III/IV | Chemotherapy | docetaxel | SD |
| IFT172 | SNV | Missense_Mutation | rs763372262 | c.1037N>A | p.Arg346Gln | p.R346Q | Q9UG01 | protein_coding | tolerated(0.18) | benign(0.246) | TCGA-BH-A0E9-01 | Breast | breast invasive carcinoma | Female | <65 | I/II | Chemotherapy | taxotere | CR |
| IFT172 | SNV | Missense_Mutation | c.448N>C | p.Gly150Arg | p.G150R | Q9UG01 | protein_coding | tolerated(0.06) | possibly_damaging(0.595) | TCGA-E2-A10C-01 | Breast | breast invasive carcinoma | Female | <65 | I/II | Chemotherapy | cytoxan | SD | |
| IFT172 | SNV | Missense_Mutation | novel | c.2662N>A | p.Glu888Lys | p.E888K | Q9UG01 | protein_coding | tolerated(0.07) | benign(0.133) | TCGA-OL-A5DA-01 | Breast | breast invasive carcinoma | Female | <65 | I/II | Unknown | Unknown | SD |
| IFT172 | SNV | Missense_Mutation | novel | c.394N>A | p.Glu132Lys | p.E132K | Q9UG01 | protein_coding | deleterious(0) | possibly_damaging(0.493) | TCGA-OL-A66L-01 | Breast | breast invasive carcinoma | Female | >=65 | I/II | Unknown | Unknown | SD |
| IFT172 | SNV | Missense_Mutation | novel | c.1212N>T | p.Glu404Asp | p.E404D | Q9UG01 | protein_coding | tolerated(0.4) | benign(0.009) | TCGA-XX-A89A-01 | Breast | breast invasive carcinoma | Female | >=65 | I/II | Unknown | Unknown | SD |
| Page: 1 2 3 4 5 6 7 8 9 10 11 12 13 14 15 16 17 18 19 20 |
Top |
Related drugs of malignant transformation related genes |
| Identification of chemicals and drugs interact with genes involved in malignant transfromation |
| (DGIdb 4.0) |
| Entrez ID | Symbol | Category | Interaction Types | Drug Claim Name | Drug Name | PMIDs |
| Page: 1 |

Copyright 2023-Present -The University of Texas Health Science Center at Houston |