
|
|||||
|
 | |
| |
| |
| |
| |
| |
|
Gene: IFT122 |
Gene summary for IFT122 |
| Gene information | Species | Human | Gene symbol | IFT122 | Gene ID | 55764 |
| Gene name | intraflagellar transport 122 | |
| Gene Alias | CED | |
| Cytomap | 3q21.3-q22.1 | |
| Gene Type | protein-coding | GO ID | GO:0001654 | UniProtAcc | Q9HBG6 |
Top |
Malignant transformation analysis |
| Identification of the aberrant gene expression in precancerous and cancerous lesions by comparing the gene expression of stem-like cells in diseased tissues with normal stem cells |
| Entrez ID | Symbol | Replicates | Species | Organ | Tissue | Adj P-value | Log2FC | Malignancy |
| 55764 | IFT122 | LZE24T | Human | Esophagus | ESCC | 8.76e-06 | 2.35e-01 | 0.0596 |
| 55764 | IFT122 | LZE6T | Human | Esophagus | ESCC | 2.20e-02 | 1.77e-01 | 0.0845 |
| 55764 | IFT122 | P1T-E | Human | Esophagus | ESCC | 1.43e-03 | 2.85e-01 | 0.0875 |
| 55764 | IFT122 | P2T-E | Human | Esophagus | ESCC | 1.82e-35 | 6.91e-01 | 0.1177 |
| 55764 | IFT122 | P4T-E | Human | Esophagus | ESCC | 2.99e-03 | 9.77e-02 | 0.1323 |
| 55764 | IFT122 | P5T-E | Human | Esophagus | ESCC | 4.97e-07 | 1.03e-01 | 0.1327 |
| 55764 | IFT122 | P8T-E | Human | Esophagus | ESCC | 7.22e-08 | 1.60e-01 | 0.0889 |
| 55764 | IFT122 | P9T-E | Human | Esophagus | ESCC | 4.85e-04 | 1.11e-01 | 0.1131 |
| 55764 | IFT122 | P10T-E | Human | Esophagus | ESCC | 7.60e-08 | 1.95e-01 | 0.116 |
| 55764 | IFT122 | P11T-E | Human | Esophagus | ESCC | 5.71e-03 | 1.82e-01 | 0.1426 |
| 55764 | IFT122 | P12T-E | Human | Esophagus | ESCC | 1.34e-03 | 8.84e-02 | 0.1122 |
| 55764 | IFT122 | P15T-E | Human | Esophagus | ESCC | 2.99e-05 | 1.98e-01 | 0.1149 |
| 55764 | IFT122 | P16T-E | Human | Esophagus | ESCC | 2.75e-20 | 4.83e-01 | 0.1153 |
| 55764 | IFT122 | P17T-E | Human | Esophagus | ESCC | 9.08e-06 | 3.04e-01 | 0.1278 |
| 55764 | IFT122 | P20T-E | Human | Esophagus | ESCC | 1.01e-06 | 1.97e-01 | 0.1124 |
| 55764 | IFT122 | P21T-E | Human | Esophagus | ESCC | 1.14e-10 | 1.96e-01 | 0.1617 |
| 55764 | IFT122 | P22T-E | Human | Esophagus | ESCC | 3.08e-07 | 1.91e-01 | 0.1236 |
| 55764 | IFT122 | P23T-E | Human | Esophagus | ESCC | 1.64e-06 | 2.03e-01 | 0.108 |
| 55764 | IFT122 | P24T-E | Human | Esophagus | ESCC | 3.37e-07 | 1.48e-01 | 0.1287 |
| 55764 | IFT122 | P26T-E | Human | Esophagus | ESCC | 1.39e-09 | 1.68e-01 | 0.1276 |
| Page: 1 2 3 |
| Tissue | Expression Dynamics | Abbreviation |
| Esophagus | 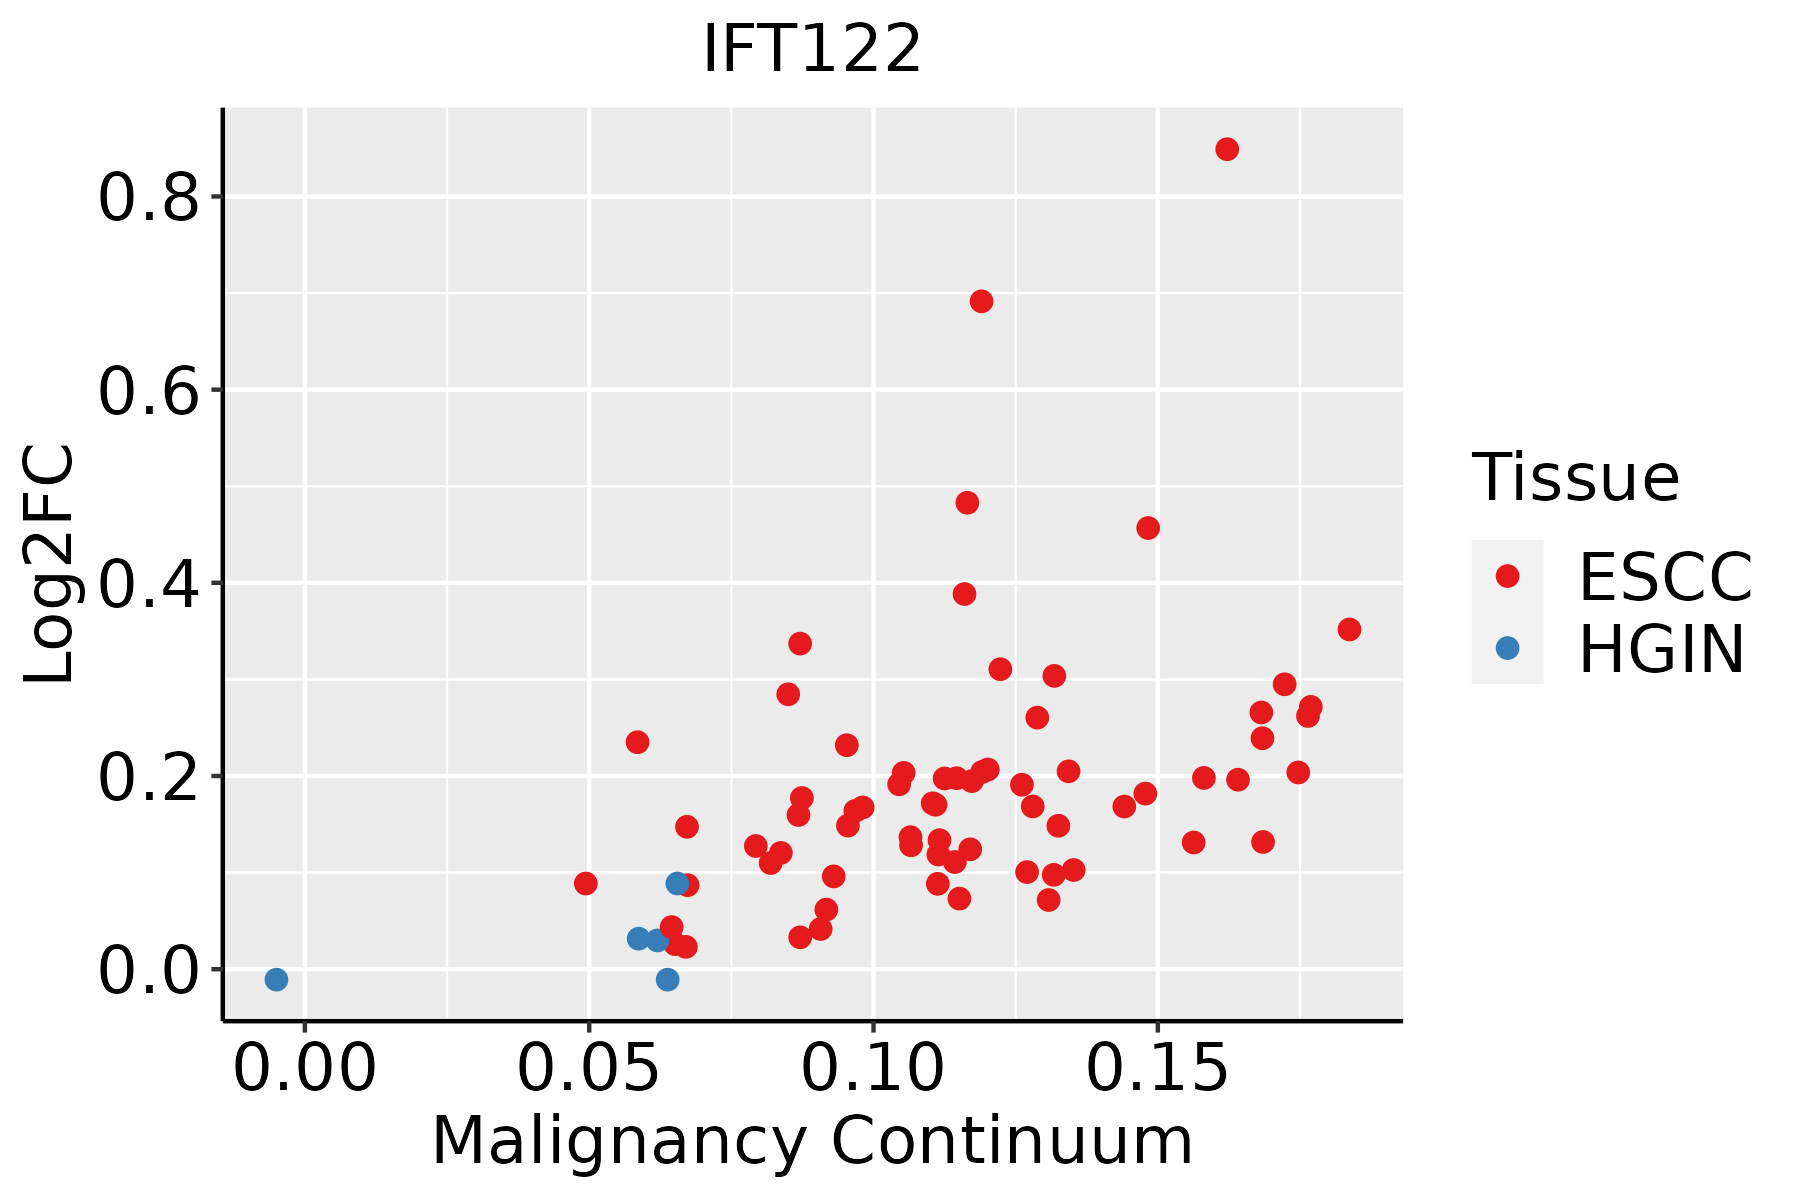 | ESCC: Esophageal squamous cell carcinoma |
| HGIN: High-grade intraepithelial neoplasias | ||
| LGIN: Low-grade intraepithelial neoplasias |
| ∗log2FC in expression of this searched gene in stem-like cells from each diseased tissue sample relative to stem-like cells in normal samples in each tissue plotted against the malignancy continuum. Samples are colored based on if they are from different disease stage. |
Top |
Malignant transformation related pathway analysis |
| Find out the enriched GO biological processes and KEGG pathways involved in transition from healthy to precancer to cancer |
| Tissue | Disease Stage | Enriched GO biological Processes |
| Colorectum | AD |  |
| Colorectum | SER |  |
| Colorectum | MSS |  |
| Colorectum | MSI-H |  |
| Colorectum | FAP |  |
| ∗Top 15 enriched GO BP terms are showed in the bar plot of each disease state in each tissue. Each row represents a significant GO biological process which is colored according to the -log10(p.adjust). |
| Page: 1 2 3 4 5 6 7 8 9 |
| GO ID | Tissue | Disease Stage | Description | Gene Ratio | Bg Ratio | pvalue | p.adjust | Count |
| GO:003070518 | Esophagus | ESCC | cytoskeleton-dependent intracellular transport | 133/8552 | 195/18723 | 1.48e-10 | 4.27e-09 | 133 |
| GO:001097013 | Esophagus | ESCC | transport along microtubule | 107/8552 | 155/18723 | 3.17e-09 | 6.80e-08 | 107 |
| GO:000184115 | Esophagus | ESCC | neural tube formation | 75/8552 | 102/18723 | 9.68e-09 | 1.95e-07 | 75 |
| GO:000184314 | Esophagus | ESCC | neural tube closure | 66/8552 | 88/18723 | 1.98e-08 | 3.82e-07 | 66 |
| GO:001402014 | Esophagus | ESCC | primary neural tube formation | 69/8552 | 94/18723 | 4.22e-08 | 7.76e-07 | 69 |
| GO:006060614 | Esophagus | ESCC | tube closure | 66/8552 | 89/18723 | 4.24e-08 | 7.76e-07 | 66 |
| GO:003150314 | Esophagus | ESCC | protein-containing complex localization | 139/8552 | 220/18723 | 1.14e-07 | 1.85e-06 | 139 |
| GO:00219159 | Esophagus | ESCC | neural tube development | 101/8552 | 152/18723 | 1.78e-07 | 2.79e-06 | 101 |
| GO:00163316 | Esophagus | ESCC | morphogenesis of embryonic epithelium | 98/8552 | 147/18723 | 2.12e-07 | 3.27e-06 | 98 |
| GO:000183814 | Esophagus | ESCC | embryonic epithelial tube formation | 83/8552 | 121/18723 | 2.78e-07 | 4.08e-06 | 83 |
| GO:003514815 | Esophagus | ESCC | tube formation | 96/8552 | 148/18723 | 1.86e-06 | 2.16e-05 | 96 |
| GO:00721759 | Esophagus | ESCC | epithelial tube formation | 86/8552 | 132/18723 | 4.81e-06 | 5.10e-05 | 86 |
| GO:006056210 | Esophagus | ESCC | epithelial tube morphogenesis | 187/8552 | 325/18723 | 9.95e-06 | 9.44e-05 | 187 |
| GO:00991114 | Esophagus | ESCC | microtubule-based transport | 115/8552 | 190/18723 | 2.54e-05 | 2.15e-04 | 115 |
| GO:00485687 | Esophagus | ESCC | embryonic organ development | 228/8552 | 427/18723 | 7.28e-04 | 3.79e-03 | 228 |
| GO:00101711 | Esophagus | ESCC | body morphogenesis | 30/8552 | 43/18723 | 1.21e-03 | 5.88e-03 | 30 |
| GO:00487367 | Esophagus | ESCC | appendage development | 98/8552 | 172/18723 | 1.83e-03 | 8.37e-03 | 98 |
| GO:00601737 | Esophagus | ESCC | limb development | 98/8552 | 172/18723 | 1.83e-03 | 8.37e-03 | 98 |
| GO:19055153 | Esophagus | ESCC | non-motile cilium assembly | 39/8552 | 61/18723 | 3.08e-03 | 1.28e-02 | 39 |
| Page: 1 |
| Pathway ID | Tissue | Disease Stage | Description | Gene Ratio | Bg Ratio | pvalue | p.adjust | qvalue | Count |
| Page: 1 |
Top |
Cell-cell communication analysis |
| Identification of potential cell-cell interactions between two cell types and their ligand-receptor pairs for different disease states |
| Ligand | Receptor | LRpair | Pathway | Tissue | Disease Stage |
| Page: 1 |
Top |
Single-cell gene regulatory network inference analysis |
| Find out the significant the regulons (TFs) and the target genes of each regulon across cell types for different disease states |
| TF | Cell Type | Tissue | Disease Stage | Target Gene | RSS | Regulon Activity |
| ∗The dot plots of a searched regulon are shown for all cell subpopulations in each disease state of each tissue based on the regulon specific score inferred using pySCENIC and by calculating the average expression. |
| Page: 1 |
Top |
Somatic mutation of malignant transformation related genes |
| Annotation of somatic variants for genes involved in malignant transformation |
| Hugo Symbol | Variant Class | Variant Classification | dbSNP RS | HGVSc | HGVSp | HGVSp Short | SWISSPROT | BIOTYPE | SIFT | PolyPhen | Tumor Sample Barcode | Tissue | Histology | Sex | Age | Stage | Therapy Types | Drugs | Outcome |
| IFT122 | SNV | Missense_Mutation | novel | c.2853N>T | p.Gln951His | p.Q951H | Q9HBG6 | protein_coding | tolerated(0.06) | probably_damaging(0.935) | TCGA-AC-A62V-01 | Breast | breast invasive carcinoma | Male | <65 | III/IV | Targeted Molecular therapy | denosumab | PD |
| IFT122 | SNV | Missense_Mutation | novel | c.3556N>A | p.Leu1186Met | p.L1186M | Q9HBG6 | protein_coding | tolerated(0.37) | benign(0.177) | TCGA-AN-A046-01 | Breast | breast invasive carcinoma | Female | >=65 | I/II | Unknown | Unknown | SD |
| IFT122 | SNV | Missense_Mutation | c.2873N>G | p.Ala958Gly | p.A958G | Q9HBG6 | protein_coding | tolerated(0.33) | benign(0.3) | TCGA-B6-A0RE-01 | Breast | breast invasive carcinoma | Female | <65 | I/II | Unknown | Unknown | SD | |
| IFT122 | SNV | Missense_Mutation | rs769736492 | c.719N>A | p.Arg240Gln | p.R240Q | Q9HBG6 | protein_coding | tolerated(0.6) | benign(0.007) | TCGA-D8-A1JA-01 | Breast | breast invasive carcinoma | Female | <65 | III/IV | Chemotherapy | adriamycin | PD |
| IFT122 | SNV | Missense_Mutation | c.1262C>G | p.Thr421Ser | p.T421S | Q9HBG6 | protein_coding | deleterious(0.03) | probably_damaging(0.987) | TCGA-D8-A1XL-01 | Breast | breast invasive carcinoma | Female | <65 | I/II | Chemotherapy | doxorubicine+cyclophosphamide+tamoxifen | SD | |
| IFT122 | SNV | Missense_Mutation | novel | c.2245N>C | p.Asp749His | p.D749H | Q9HBG6 | protein_coding | deleterious(0) | probably_damaging(0.967) | TCGA-OL-A5RW-01 | Breast | breast invasive carcinoma | Female | <65 | I/II | Chemotherapy | adriamycin | CR |
| IFT122 | insertion | Frame_Shift_Ins | novel | c.1867_1868insCGTTGTTCAGTGGAGTCATCCAGCCCTGTGGCCT | p.Gly623AlafsTer67 | p.G623Afs*67 | Q9HBG6 | protein_coding | TCGA-A8-A0A4-01 | Breast | breast invasive carcinoma | Female | >=65 | I/II | Hormone Therapy | tamoxiphen | CR | ||
| IFT122 | insertion | Frame_Shift_Ins | novel | c.2593_2594insCCTTTGTCCAG | p.Tyr865SerfsTer20 | p.Y865Sfs*20 | Q9HBG6 | protein_coding | TCGA-AN-A0FN-01 | Breast | breast invasive carcinoma | Female | <65 | I/II | Unknown | Unknown | SD | ||
| IFT122 | insertion | Frame_Shift_Ins | novel | c.709_710insAT | p.Pro237HisfsTer11 | p.P237Hfs*11 | Q9HBG6 | protein_coding | TCGA-AO-A0JB-01 | Breast | breast invasive carcinoma | Female | <65 | III/IV | Chemotherapy | cyclophosphamide | SD | ||
| IFT122 | insertion | In_Frame_Ins | novel | c.711_712insAAGTTGTTGTATGTTTCAATTATTTGT | p.Pro237_Ser238insLysLeuLeuTyrValSerIleIleCys | p.P237_S238insKLLYVSIIC | Q9HBG6 | protein_coding | TCGA-AO-A0JB-01 | Breast | breast invasive carcinoma | Female | <65 | III/IV | Chemotherapy | cyclophosphamide | SD |
| Page: 1 2 3 4 5 6 7 8 9 10 11 12 13 |
Top |
Related drugs of malignant transformation related genes |
| Identification of chemicals and drugs interact with genes involved in malignant transfromation |
| (DGIdb 4.0) |
| Entrez ID | Symbol | Category | Interaction Types | Drug Claim Name | Drug Name | PMIDs |
| Page: 1 |

Copyright 2023-Present -The University of Texas Health Science Center at Houston |