
|
|||||
|
 | |
| |
| |
| |
| |
| |
|
Gene: IFRD1 |
Gene summary for IFRD1 |
| Gene information | Species | Human | Gene symbol | IFRD1 | Gene ID | 3475 |
| Gene name | interferon related developmental regulator 1 | |
| Gene Alias | PC4 | |
| Cytomap | 7q31.1 | |
| Gene Type | protein-coding | GO ID | GO:0001709 | UniProtAcc | A4D0U1 |
Top |
Malignant transformation analysis |
| Identification of the aberrant gene expression in precancerous and cancerous lesions by comparing the gene expression of stem-like cells in diseased tissues with normal stem cells |
| Entrez ID | Symbol | Replicates | Species | Organ | Tissue | Adj P-value | Log2FC | Malignancy |
| 3475 | IFRD1 | GSM4909277 | Human | Breast | Precancer | 1.01e-02 | 7.03e-01 | 0.0177 |
| 3475 | IFRD1 | GSM4909282 | Human | Breast | IDC | 4.23e-03 | -2.70e-01 | -0.0288 |
| 3475 | IFRD1 | GSM4909285 | Human | Breast | IDC | 8.82e-03 | -2.30e-01 | 0.21 |
| 3475 | IFRD1 | GSM4909290 | Human | Breast | IDC | 1.86e-09 | -4.75e-01 | 0.2096 |
| 3475 | IFRD1 | GSM4909294 | Human | Breast | IDC | 1.81e-18 | -5.29e-01 | 0.2022 |
| 3475 | IFRD1 | GSM4909296 | Human | Breast | IDC | 8.73e-14 | -3.92e-01 | 0.1524 |
| 3475 | IFRD1 | GSM4909297 | Human | Breast | IDC | 1.10e-11 | -3.28e-01 | 0.1517 |
| 3475 | IFRD1 | GSM4909301 | Human | Breast | IDC | 4.14e-20 | -5.29e-01 | 0.1577 |
| 3475 | IFRD1 | GSM4909302 | Human | Breast | IDC | 4.75e-11 | -4.11e-01 | 0.1545 |
| 3475 | IFRD1 | GSM4909304 | Human | Breast | IDC | 9.94e-13 | -4.27e-01 | 0.1636 |
| 3475 | IFRD1 | GSM4909306 | Human | Breast | IDC | 7.11e-04 | -3.51e-01 | 0.1564 |
| 3475 | IFRD1 | GSM4909307 | Human | Breast | IDC | 2.80e-12 | -4.68e-01 | 0.1569 |
| 3475 | IFRD1 | GSM4909308 | Human | Breast | IDC | 5.06e-05 | -2.86e-01 | 0.158 |
| 3475 | IFRD1 | GSM4909311 | Human | Breast | IDC | 8.28e-35 | -6.19e-01 | 0.1534 |
| 3475 | IFRD1 | GSM4909312 | Human | Breast | IDC | 1.34e-22 | -5.30e-01 | 0.1552 |
| 3475 | IFRD1 | GSM4909315 | Human | Breast | IDC | 1.16e-05 | -3.71e-01 | 0.21 |
| 3475 | IFRD1 | GSM4909316 | Human | Breast | IDC | 2.56e-03 | -4.64e-01 | 0.21 |
| 3475 | IFRD1 | GSM4909319 | Human | Breast | IDC | 1.56e-33 | -6.03e-01 | 0.1563 |
| 3475 | IFRD1 | GSM4909320 | Human | Breast | IDC | 1.23e-09 | -5.94e-01 | 0.1575 |
| 3475 | IFRD1 | GSM4909321 | Human | Breast | IDC | 7.86e-23 | -5.07e-01 | 0.1559 |
| Page: 1 2 3 4 5 6 7 8 9 |
| Tissue | Expression Dynamics | Abbreviation |
| Breast | 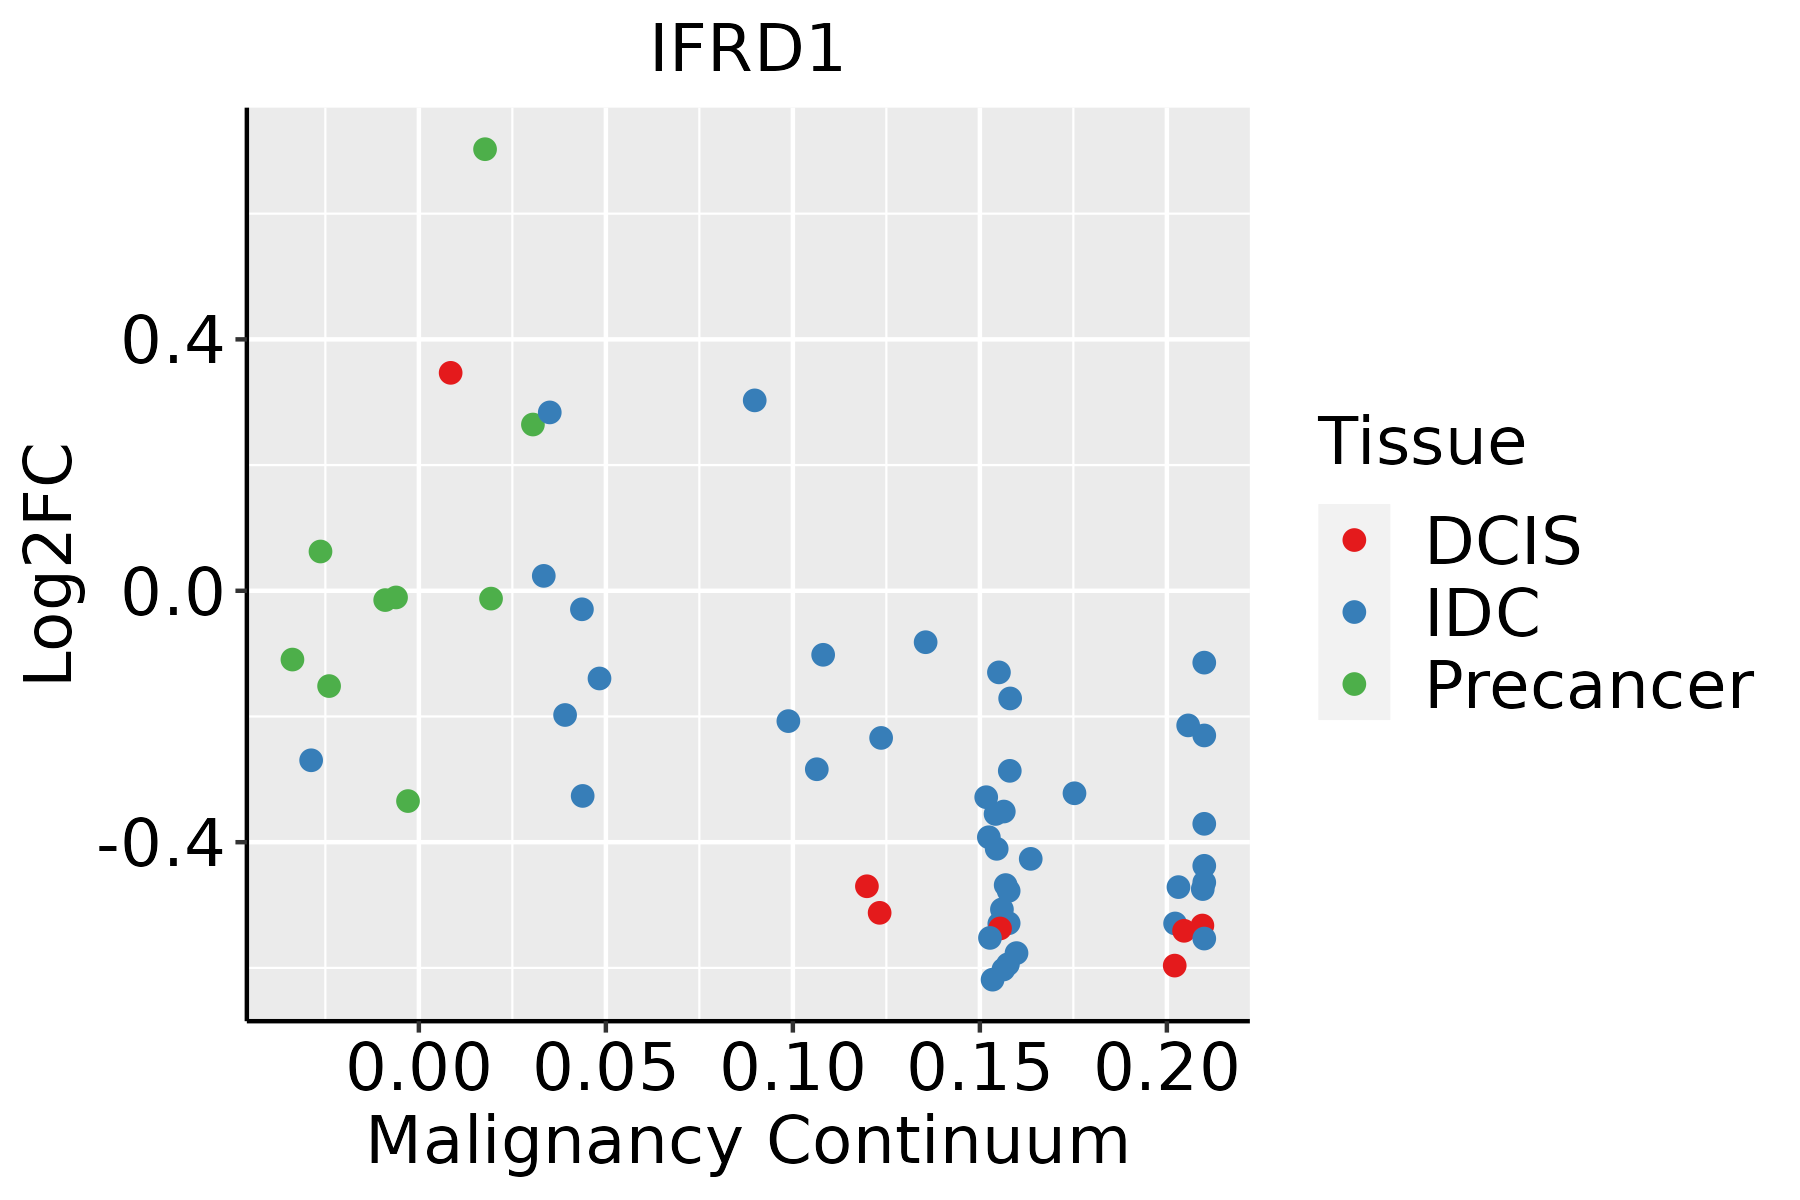 | IDC: Invasive ductal carcinoma |
| DCIS: Ductal carcinoma in situ | ||
| Precancer(BRCA1-mut): Precancerous lesion from BRCA1 mutation carriers | ||
| Cervix | 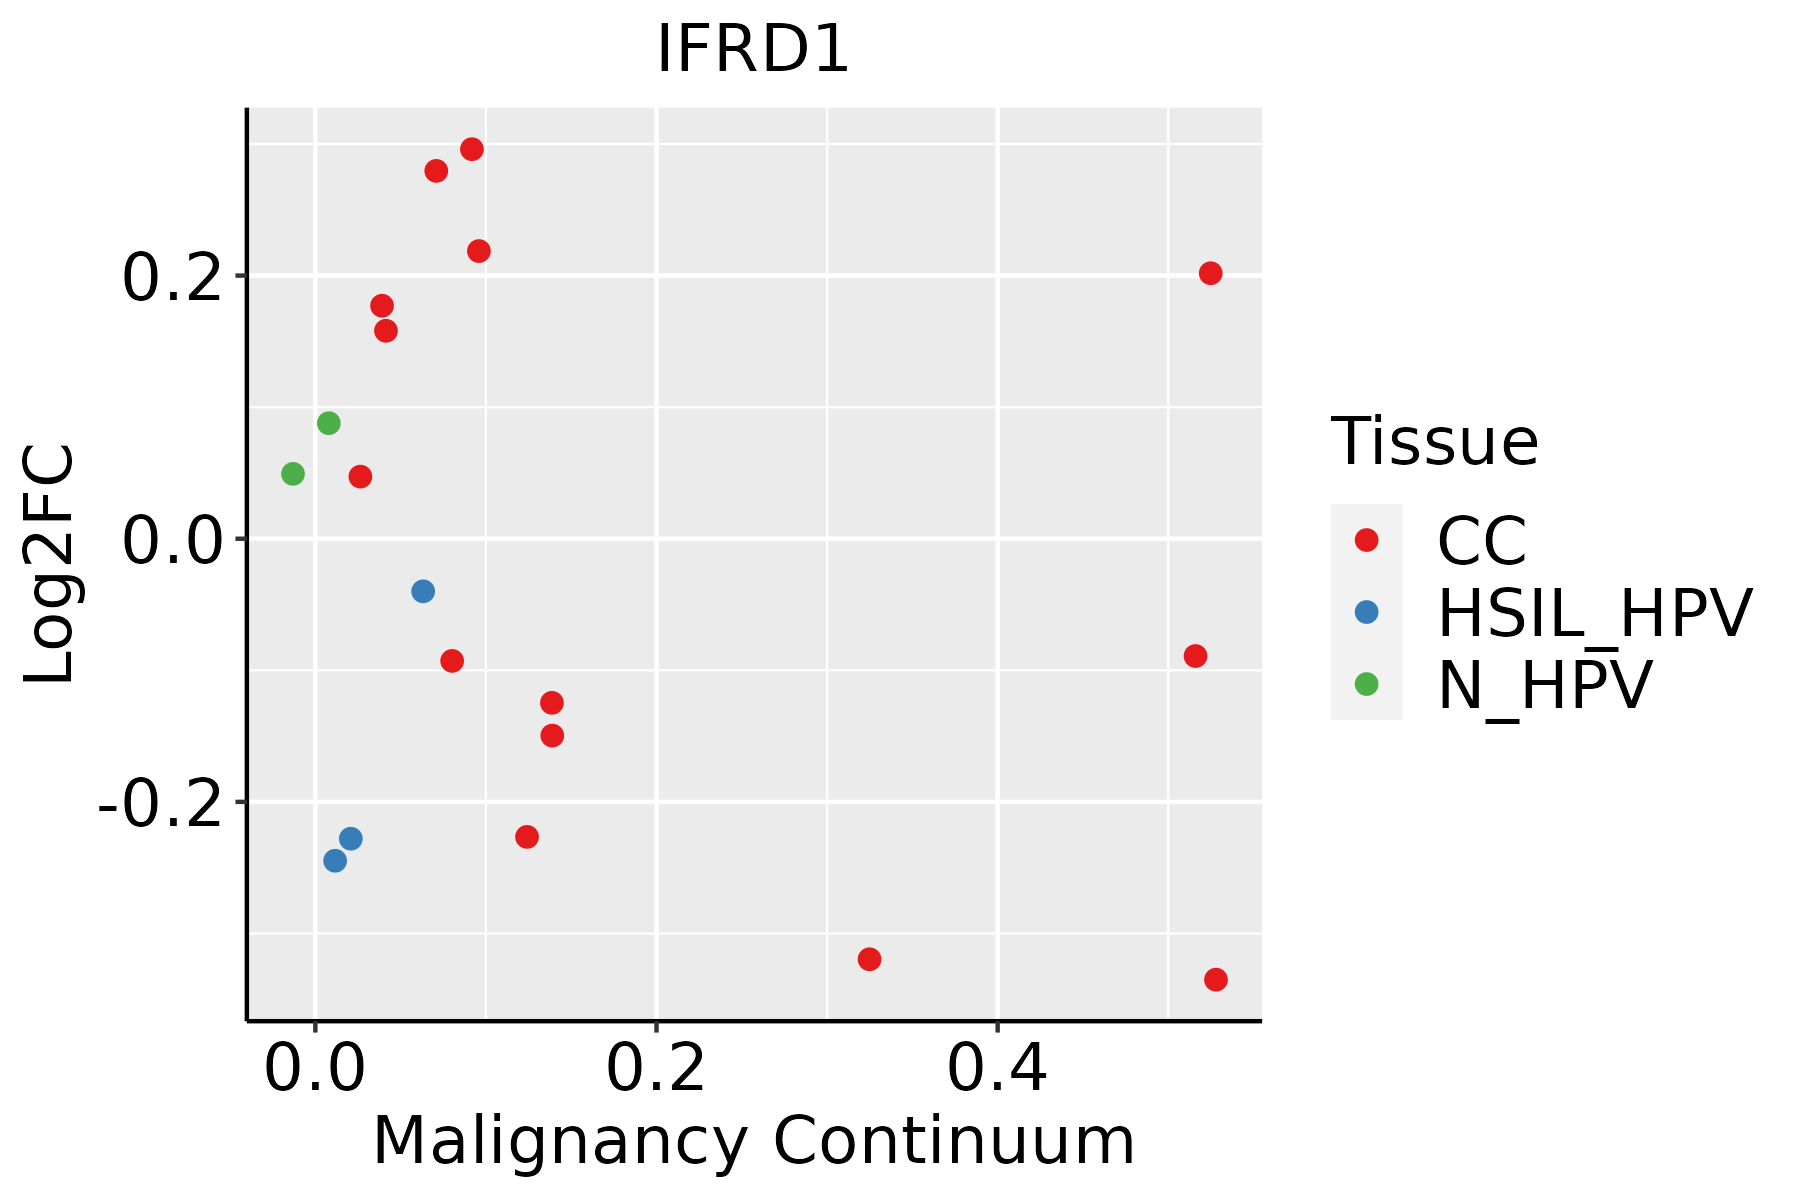 | CC: Cervix cancer |
| HSIL_HPV: HPV-infected high-grade squamous intraepithelial lesions | ||
| N_HPV: HPV-infected normal cervix | ||
| Esophagus |  | ESCC: Esophageal squamous cell carcinoma |
| HGIN: High-grade intraepithelial neoplasias | ||
| LGIN: Low-grade intraepithelial neoplasias | ||
| Liver | 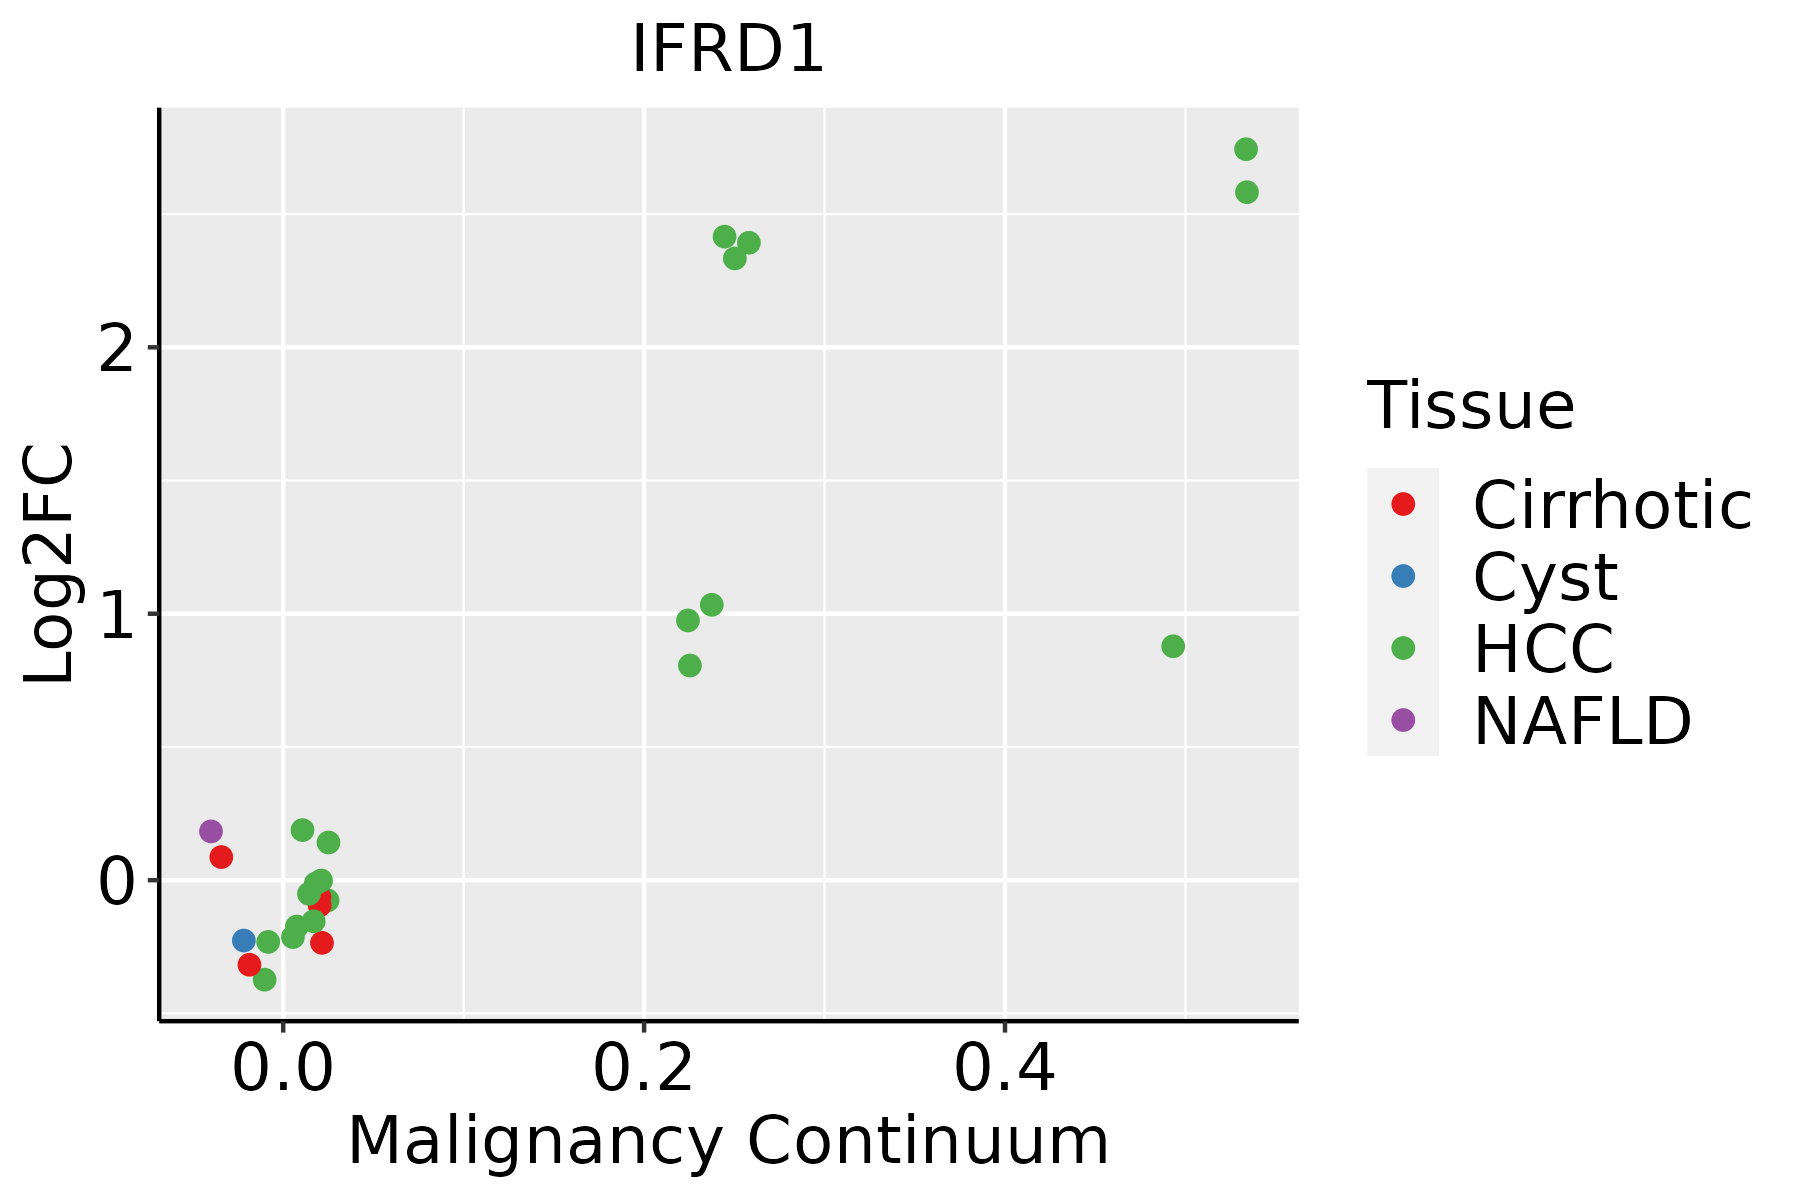 | HCC: Hepatocellular carcinoma |
| NAFLD: Non-alcoholic fatty liver disease | ||
| Lung |  | AAH: Atypical adenomatous hyperplasia |
| AIS: Adenocarcinoma in situ | ||
| IAC: Invasive lung adenocarcinoma | ||
| MIA: Minimally invasive adenocarcinoma | ||
| Oral Cavity |  | EOLP: Erosive Oral lichen planus |
| LP: leukoplakia | ||
| NEOLP: Non-erosive oral lichen planus | ||
| OSCC: Oral squamous cell carcinoma | ||
| Prostate | 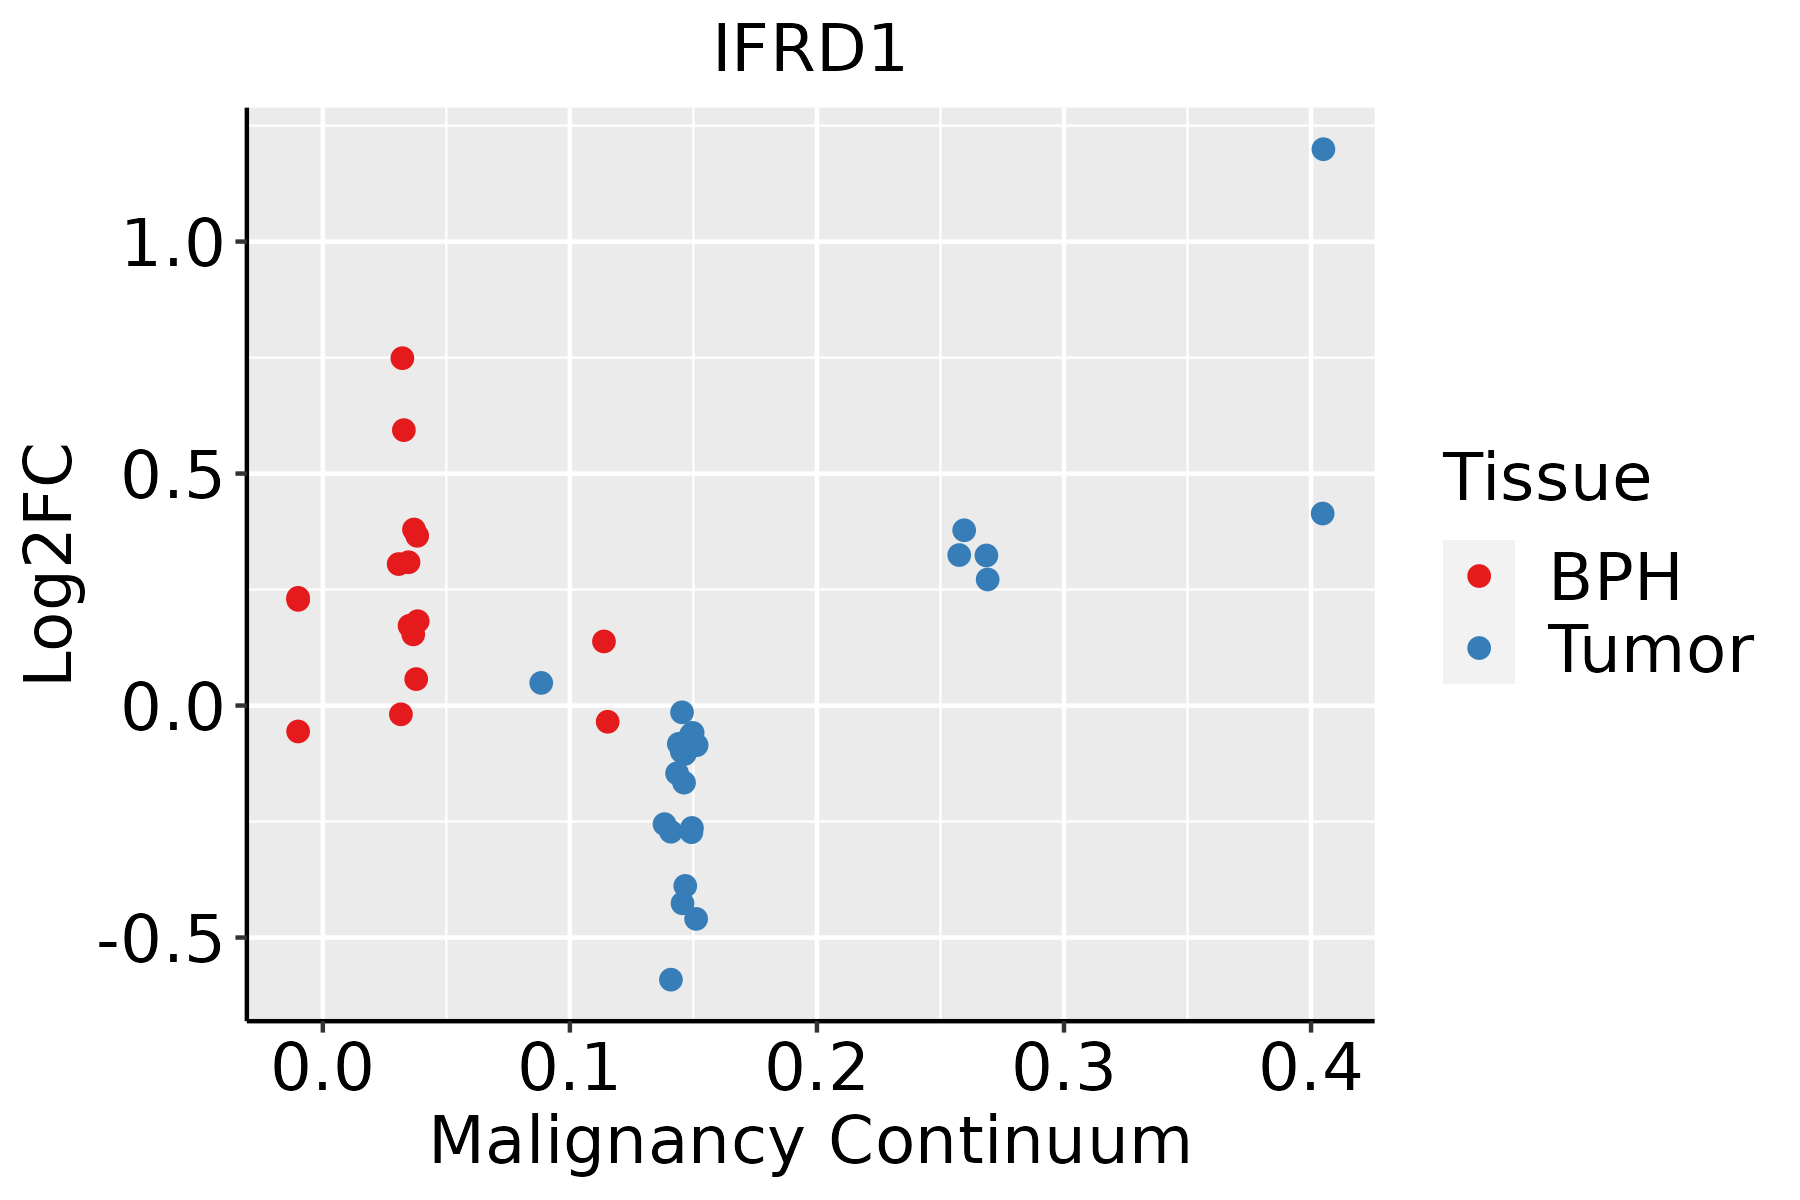 | BPH: Benign Prostatic Hyperplasia |
| Skin | 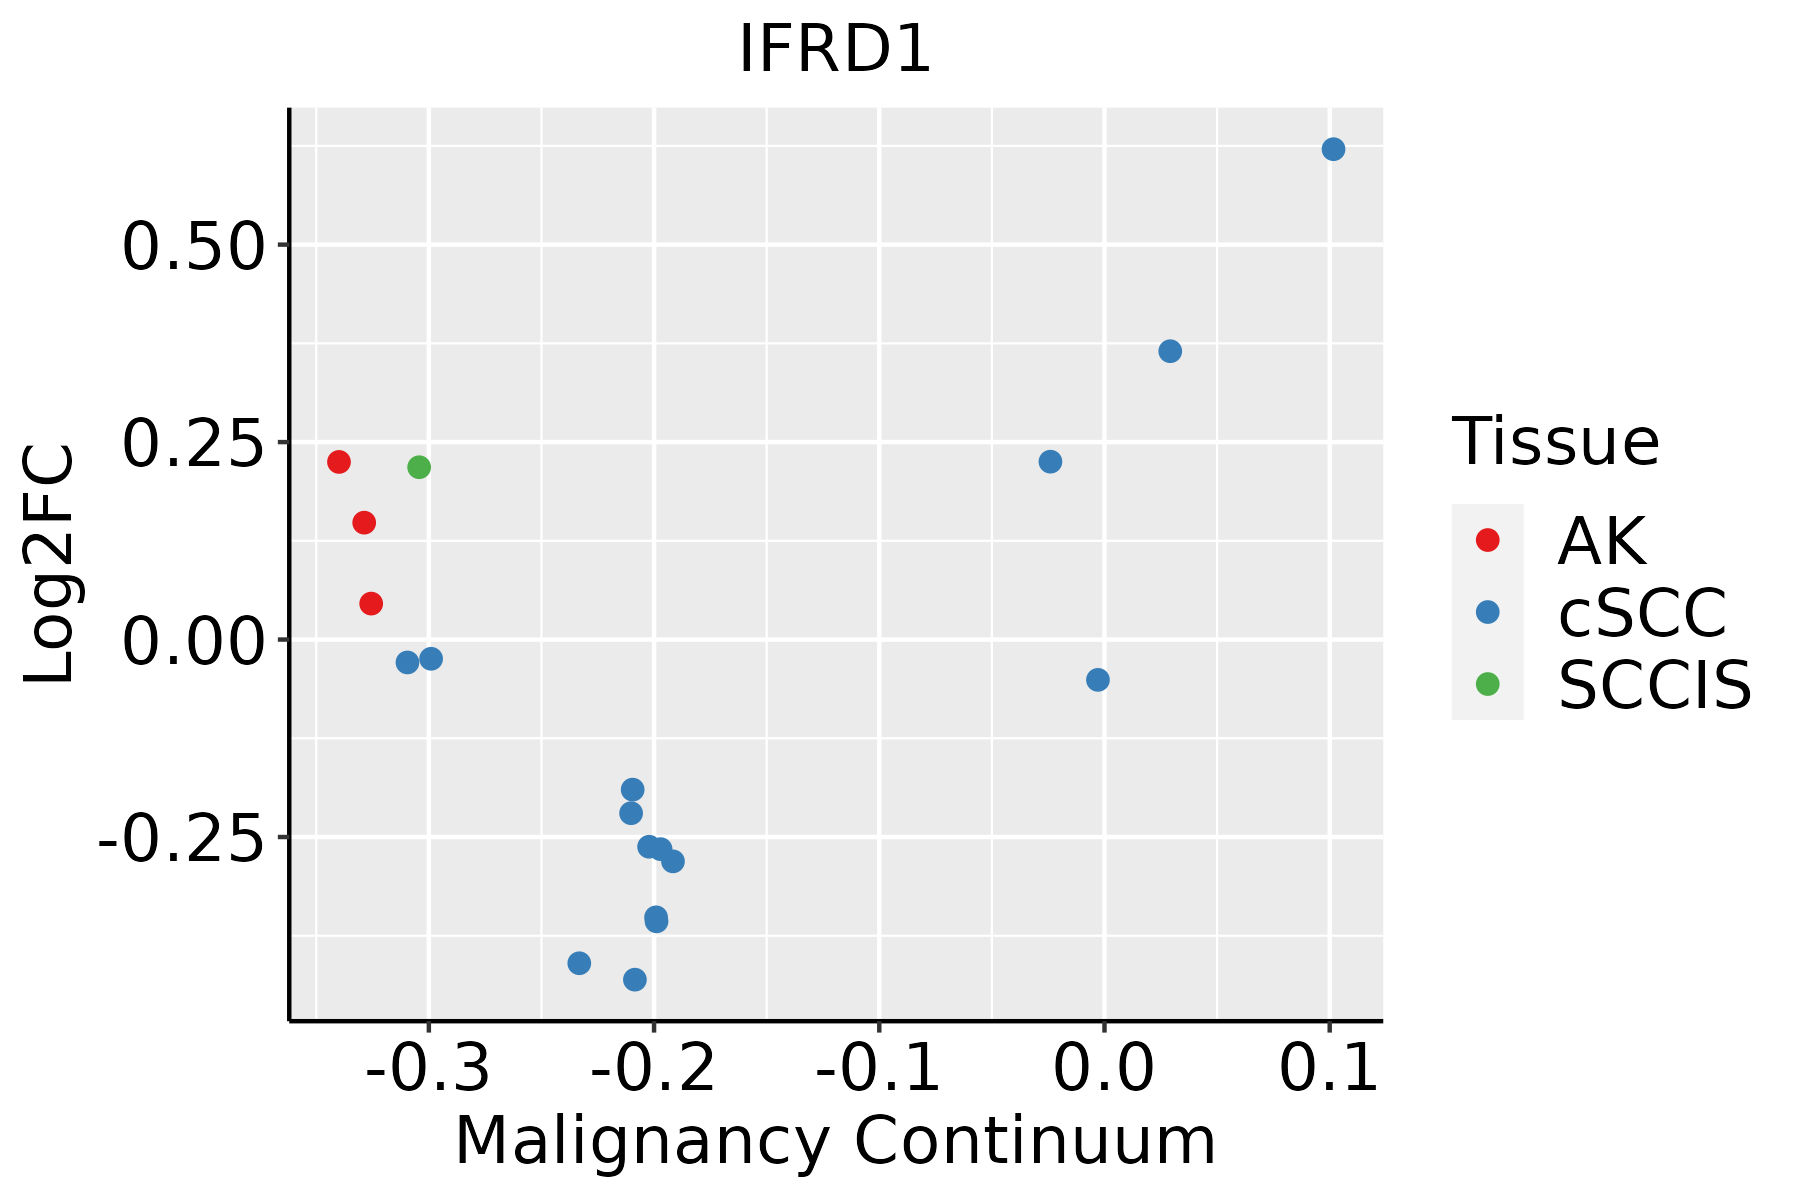 | AK: Actinic keratosis |
| cSCC: Cutaneous squamous cell carcinoma | ||
| SCCIS:squamous cell carcinoma in situ | ||
| Thyroid | 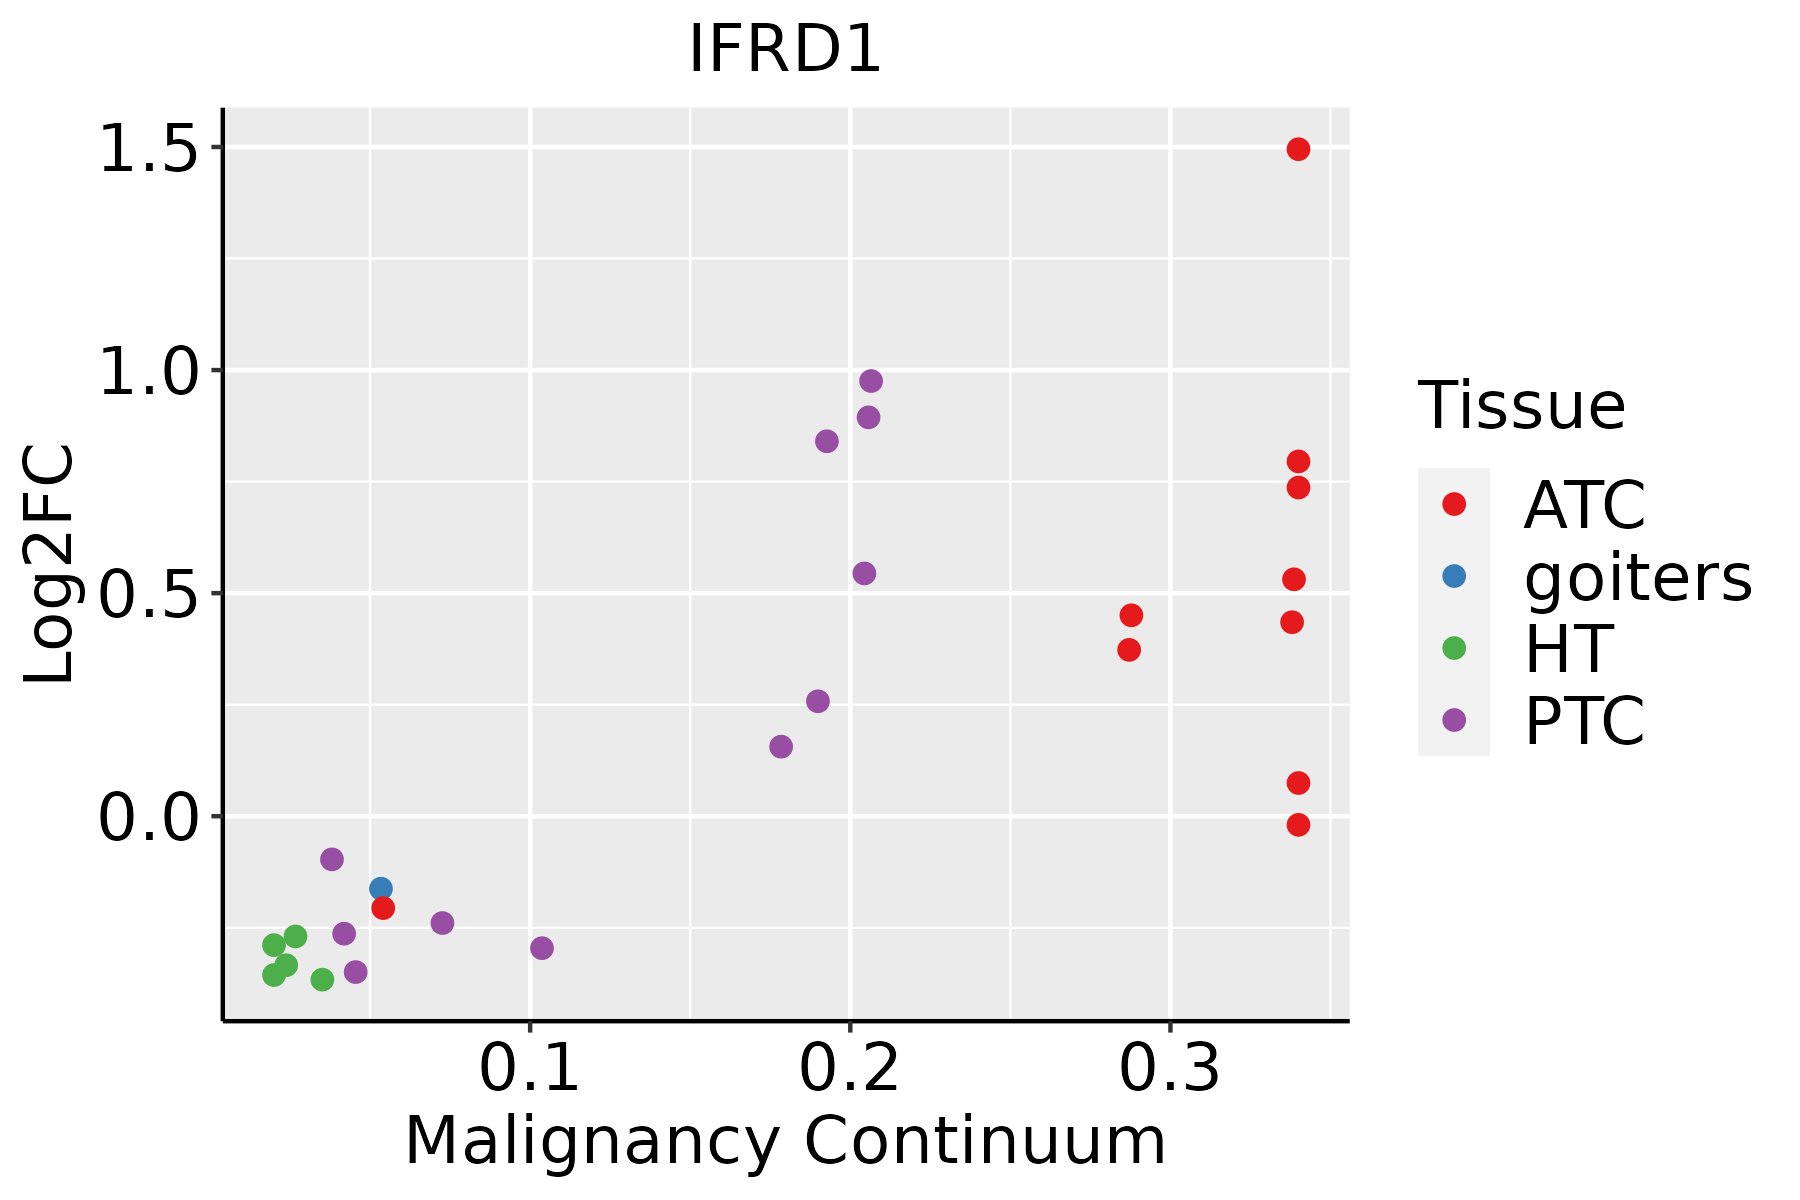 | ATC: Anaplastic thyroid cancer |
| HT: Hashimoto's thyroiditis | ||
| PTC: Papillary thyroid cancer |
| ∗log2FC in expression of this searched gene in stem-like cells from each diseased tissue sample relative to stem-like cells in normal samples in each tissue plotted against the malignancy continuum. Samples are colored based on if they are from different disease stage. |
Top |
Malignant transformation related pathway analysis |
| Find out the enriched GO biological processes and KEGG pathways involved in transition from healthy to precancer to cancer |
| Tissue | Disease Stage | Enriched GO biological Processes |
| Colorectum | AD |  |
| Colorectum | SER |  |
| Colorectum | MSS |  |
| Colorectum | MSI-H |  |
| Colorectum | FAP |  |
| ∗Top 15 enriched GO BP terms are showed in the bar plot of each disease state in each tissue. Each row represents a significant GO biological process which is colored according to the -log10(p.adjust). |
| Page: 1 2 3 4 5 6 7 8 9 |
| GO ID | Tissue | Disease Stage | Description | Gene Ratio | Bg Ratio | pvalue | p.adjust | Count |
| GO:0045445 | Cervix | CC | myoblast differentiation | 21/2311 | 84/18723 | 1.08e-03 | 8.94e-03 | 21 |
| GO:00454451 | Cervix | HSIL_HPV | myoblast differentiation | 10/737 | 84/18723 | 1.67e-03 | 1.80e-02 | 10 |
| GO:00454454 | Esophagus | ESCC | myoblast differentiation | 52/8552 | 84/18723 | 1.98e-03 | 8.90e-03 | 52 |
| GO:00454453 | Oral cavity | OSCC | myoblast differentiation | 46/7305 | 84/18723 | 2.43e-03 | 1.07e-02 | 46 |
| GO:004544512 | Oral cavity | LP | myoblast differentiation | 35/4623 | 84/18723 | 4.56e-04 | 4.33e-03 | 35 |
| GO:004544521 | Oral cavity | NEOLP | myoblast differentiation | 19/2005 | 84/18723 | 1.20e-03 | 8.85e-03 | 19 |
| GO:00454452 | Prostate | BPH | myoblast differentiation | 24/3107 | 84/18723 | 4.13e-03 | 2.04e-02 | 24 |
| GO:004544511 | Prostate | Tumor | myoblast differentiation | 24/3246 | 84/18723 | 7.23e-03 | 3.24e-02 | 24 |
| GO:00454455 | Skin | AK | myoblast differentiation | 16/1910 | 84/18723 | 1.01e-02 | 4.84e-02 | 16 |
| GO:004544513 | Skin | cSCC | myoblast differentiation | 35/4864 | 84/18723 | 1.23e-03 | 7.97e-03 | 35 |
| Page: 1 |
| Pathway ID | Tissue | Disease Stage | Description | Gene Ratio | Bg Ratio | pvalue | p.adjust | qvalue | Count |
| Page: 1 |
Top |
Cell-cell communication analysis |
| Identification of potential cell-cell interactions between two cell types and their ligand-receptor pairs for different disease states |
| Ligand | Receptor | LRpair | Pathway | Tissue | Disease Stage |
| Page: 1 |
Top |
Single-cell gene regulatory network inference analysis |
| Find out the significant the regulons (TFs) and the target genes of each regulon across cell types for different disease states |
| TF | Cell Type | Tissue | Disease Stage | Target Gene | RSS | Regulon Activity |
| ∗The dot plots of a searched regulon are shown for all cell subpopulations in each disease state of each tissue based on the regulon specific score inferred using pySCENIC and by calculating the average expression. |
| Page: 1 |
Top |
Somatic mutation of malignant transformation related genes |
| Annotation of somatic variants for genes involved in malignant transformation |
| Hugo Symbol | Variant Class | Variant Classification | dbSNP RS | HGVSc | HGVSp | HGVSp Short | SWISSPROT | BIOTYPE | SIFT | PolyPhen | Tumor Sample Barcode | Tissue | Histology | Sex | Age | Stage | Therapy Types | Drugs | Outcome |
| IFRD1 | SNV | Missense_Mutation | novel | c.980N>T | p.Arg327Leu | p.R327L | O00458 | protein_coding | deleterious(0) | probably_damaging(0.949) | TCGA-A7-A0DB-01 | Breast | breast invasive carcinoma | Female | <65 | I/II | Hormone Therapy | arimidex | SD |
| IFRD1 | SNV | Missense_Mutation | rs771235895 | c.1187G>A | p.Arg396Gln | p.R396Q | O00458 | protein_coding | deleterious(0) | probably_damaging(0.998) | TCGA-AN-A046-01 | Breast | breast invasive carcinoma | Female | >=65 | I/II | Unknown | Unknown | SD |
| IFRD1 | SNV | Missense_Mutation | novel | c.1345G>A | p.Glu449Lys | p.E449K | O00458 | protein_coding | deleterious_low_confidence(0.01) | benign(0.158) | TCGA-AN-A046-01 | Breast | breast invasive carcinoma | Female | >=65 | I/II | Unknown | Unknown | SD |
| IFRD1 | SNV | Missense_Mutation | c.1057N>G | p.Thr353Ala | p.T353A | O00458 | protein_coding | tolerated(0.23) | benign(0.07) | TCGA-B6-A0WT-01 | Breast | breast invasive carcinoma | Female | <65 | I/II | Unknown | Unknown | PD | |
| IFRD1 | SNV | Missense_Mutation | novel | c.491N>T | p.Glu164Val | p.E164V | O00458 | protein_coding | deleterious(0) | probably_damaging(0.983) | TCGA-E9-A2JS-01 | Breast | breast invasive carcinoma | Female | >=65 | I/II | Chemotherapy | cyclophosphamide | PD |
| IFRD1 | SNV | Missense_Mutation | novel | c.1340T>C | p.Val447Ala | p.V447A | O00458 | protein_coding | tolerated(0.06) | probably_damaging(0.983) | TCGA-2W-A8YY-01 | Cervix | cervical & endocervical cancer | Female | <65 | I/II | Chemotherapy | cisplatin | CR |
| IFRD1 | SNV | Missense_Mutation | c.795N>T | p.Glu265Asp | p.E265D | O00458 | protein_coding | tolerated(1) | benign(0.015) | TCGA-AA-3663-01 | Colorectum | colon adenocarcinoma | Male | <65 | I/II | Unknown | Unknown | SD | |
| IFRD1 | SNV | Missense_Mutation | c.107N>A | p.Arg36Gln | p.R36Q | O00458 | protein_coding | tolerated(0.31) | benign(0.011) | TCGA-AA-3851-01 | Colorectum | colon adenocarcinoma | Male | >=65 | I/II | Unknown | Unknown | SD | |
| IFRD1 | SNV | Missense_Mutation | c.1298N>A | p.Arg433Gln | p.R433Q | O00458 | protein_coding | deleterious(0) | probably_damaging(0.968) | TCGA-AA-A010-01 | Colorectum | colon adenocarcinoma | Female | <65 | I/II | Chemotherapy | folinic | CR | |
| IFRD1 | SNV | Missense_Mutation | c.1007G>A | p.Arg336Gln | p.R336Q | O00458 | protein_coding | deleterious(0.01) | probably_damaging(0.997) | TCGA-CM-6162-01 | Colorectum | colon adenocarcinoma | Female | <65 | III/IV | Chemotherapy | oxaliplatin | SD |
| Page: 1 2 3 4 5 6 |
Top |
Related drugs of malignant transformation related genes |
| Identification of chemicals and drugs interact with genes involved in malignant transfromation |
| (DGIdb 4.0) |
| Entrez ID | Symbol | Category | Interaction Types | Drug Claim Name | Drug Name | PMIDs |
| Page: 1 |

Copyright 2023-Present -The University of Texas Health Science Center at Houston |