
|
|||||
|
 | |
| |
| |
| |
| |
| |
|
Gene: IFNGR2 |
Gene summary for IFNGR2 |
| Gene information | Species | Human | Gene symbol | IFNGR2 | Gene ID | 3460 |
| Gene name | interferon gamma receptor 2 | |
| Gene Alias | AF-1 | |
| Cytomap | 21q22.11 | |
| Gene Type | protein-coding | GO ID | GO:0001774 | UniProtAcc | E7EUY1 |
Top |
Malignant transformation analysis |
| Identification of the aberrant gene expression in precancerous and cancerous lesions by comparing the gene expression of stem-like cells in diseased tissues with normal stem cells |
| Entrez ID | Symbol | Replicates | Species | Organ | Tissue | Adj P-value | Log2FC | Malignancy |
| 3460 | IFNGR2 | HTA11_2487_2000001011 | Human | Colorectum | SER | 6.02e-09 | 6.68e-01 | -0.1808 |
| 3460 | IFNGR2 | HTA11_1938_2000001011 | Human | Colorectum | AD | 8.35e-04 | 5.04e-01 | -0.0811 |
| 3460 | IFNGR2 | HTA11_347_2000001011 | Human | Colorectum | AD | 2.86e-11 | 5.50e-01 | -0.1954 |
| 3460 | IFNGR2 | HTA11_411_2000001011 | Human | Colorectum | SER | 4.23e-09 | 1.11e+00 | -0.2602 |
| 3460 | IFNGR2 | HTA11_2112_2000001011 | Human | Colorectum | SER | 2.06e-07 | 1.09e+00 | -0.2196 |
| 3460 | IFNGR2 | HTA11_866_3004761011 | Human | Colorectum | AD | 1.97e-07 | 2.97e-01 | 0.096 |
| 3460 | IFNGR2 | HTA11_6818_2000001021 | Human | Colorectum | AD | 3.63e-05 | 3.78e-01 | 0.0588 |
| 3460 | IFNGR2 | HTA11_99999970781_79442 | Human | Colorectum | MSS | 9.46e-03 | 3.61e-01 | 0.294 |
| 3460 | IFNGR2 | HTA11_99999965104_69814 | Human | Colorectum | MSS | 2.02e-05 | 4.60e-01 | 0.281 |
| 3460 | IFNGR2 | HTA11_99999971662_82457 | Human | Colorectum | MSS | 1.43e-08 | 5.06e-01 | 0.3859 |
| 3460 | IFNGR2 | HTA11_99999974143_84620 | Human | Colorectum | MSS | 4.04e-06 | 3.41e-01 | 0.3005 |
| 3460 | IFNGR2 | A015-C-203 | Human | Colorectum | FAP | 2.85e-04 | -1.33e-01 | -0.1294 |
| 3460 | IFNGR2 | A002-C-114 | Human | Colorectum | FAP | 7.62e-04 | -2.08e-01 | -0.1561 |
| 3460 | IFNGR2 | A015-C-104 | Human | Colorectum | FAP | 3.57e-04 | -8.10e-02 | -0.1899 |
| 3460 | IFNGR2 | A002-C-016 | Human | Colorectum | FAP | 7.20e-03 | -1.08e-01 | 0.0521 |
| 3460 | IFNGR2 | A002-C-116 | Human | Colorectum | FAP | 1.55e-06 | -1.60e-02 | -0.0452 |
| 3460 | IFNGR2 | A018-E-020 | Human | Colorectum | FAP | 2.51e-02 | -1.51e-01 | -0.2034 |
| 3460 | IFNGR2 | LZE4T | Human | Esophagus | ESCC | 2.11e-07 | -7.81e-02 | 0.0811 |
| 3460 | IFNGR2 | LZE5T | Human | Esophagus | ESCC | 3.85e-03 | -1.44e-02 | 0.0514 |
| 3460 | IFNGR2 | LZE8T | Human | Esophagus | ESCC | 3.34e-02 | -2.79e-01 | 0.067 |
| Page: 1 2 3 4 5 6 7 8 9 |
| Tissue | Expression Dynamics | Abbreviation |
| Colorectum (GSE201348) |  | FAP: Familial adenomatous polyposis |
| CRC: Colorectal cancer | ||
| Colorectum (HTA11) |  | AD: Adenomas |
| SER: Sessile serrated lesions | ||
| MSI-H: Microsatellite-high colorectal cancer | ||
| MSS: Microsatellite stable colorectal cancer | ||
| Esophagus | 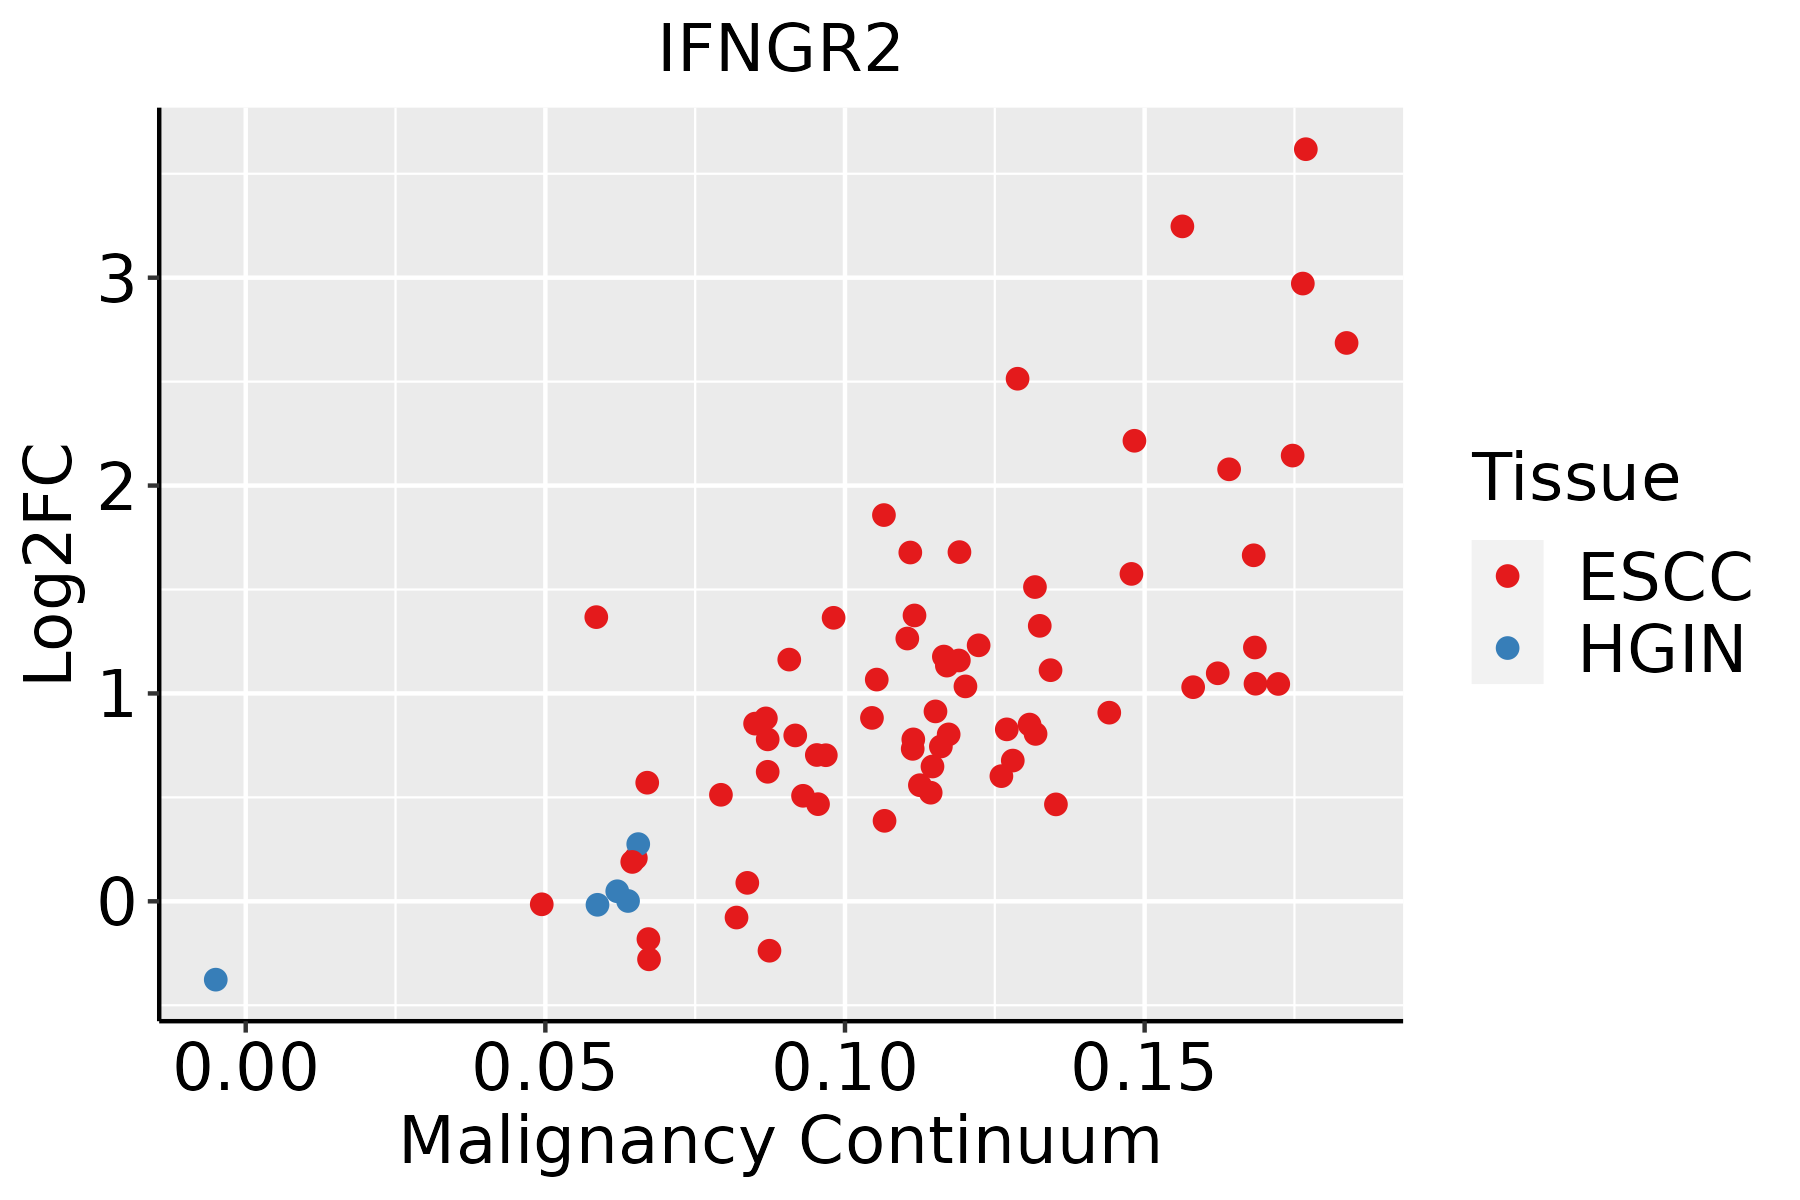 | ESCC: Esophageal squamous cell carcinoma |
| HGIN: High-grade intraepithelial neoplasias | ||
| LGIN: Low-grade intraepithelial neoplasias | ||
| Liver |  | HCC: Hepatocellular carcinoma |
| NAFLD: Non-alcoholic fatty liver disease | ||
| Lung | 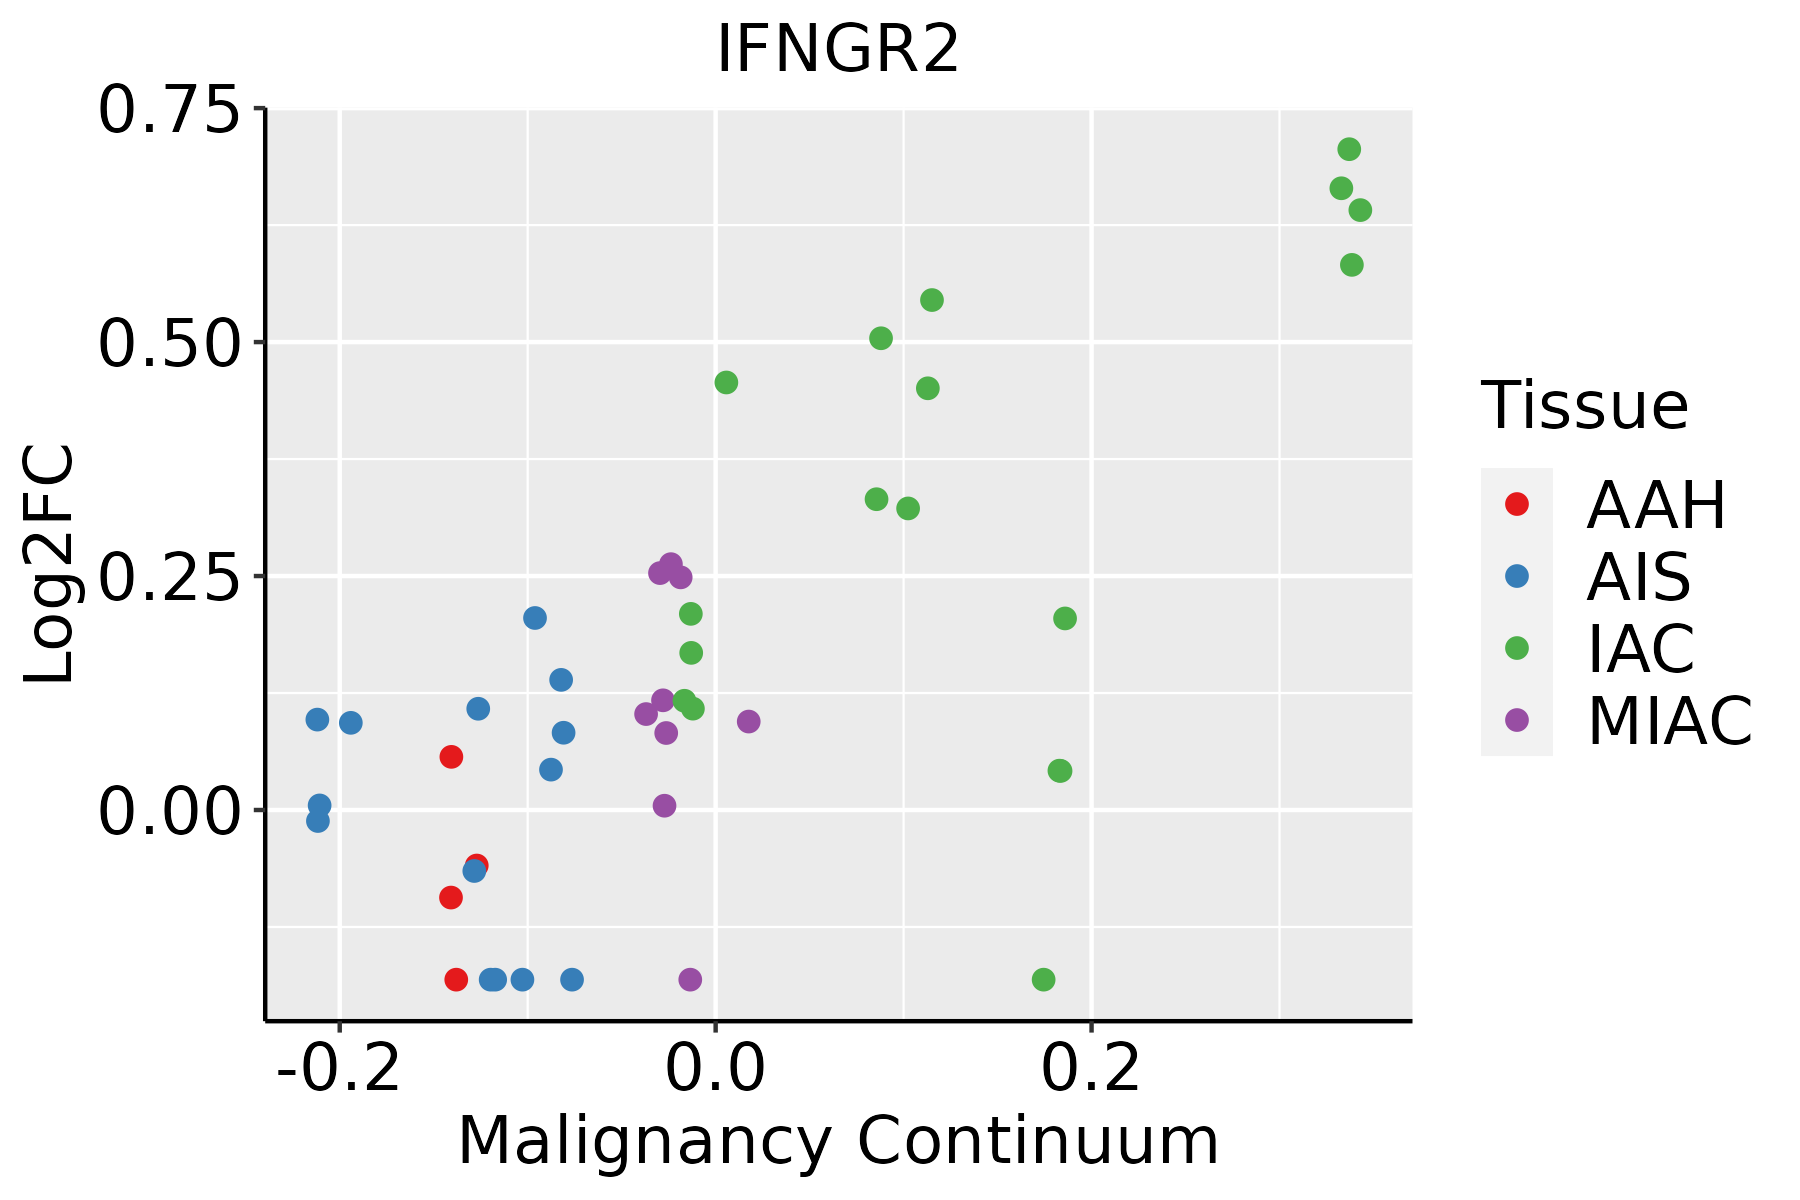 | AAH: Atypical adenomatous hyperplasia |
| AIS: Adenocarcinoma in situ | ||
| IAC: Invasive lung adenocarcinoma | ||
| MIA: Minimally invasive adenocarcinoma | ||
| Oral Cavity |  | EOLP: Erosive Oral lichen planus |
| LP: leukoplakia | ||
| NEOLP: Non-erosive oral lichen planus | ||
| OSCC: Oral squamous cell carcinoma | ||
| Prostate | 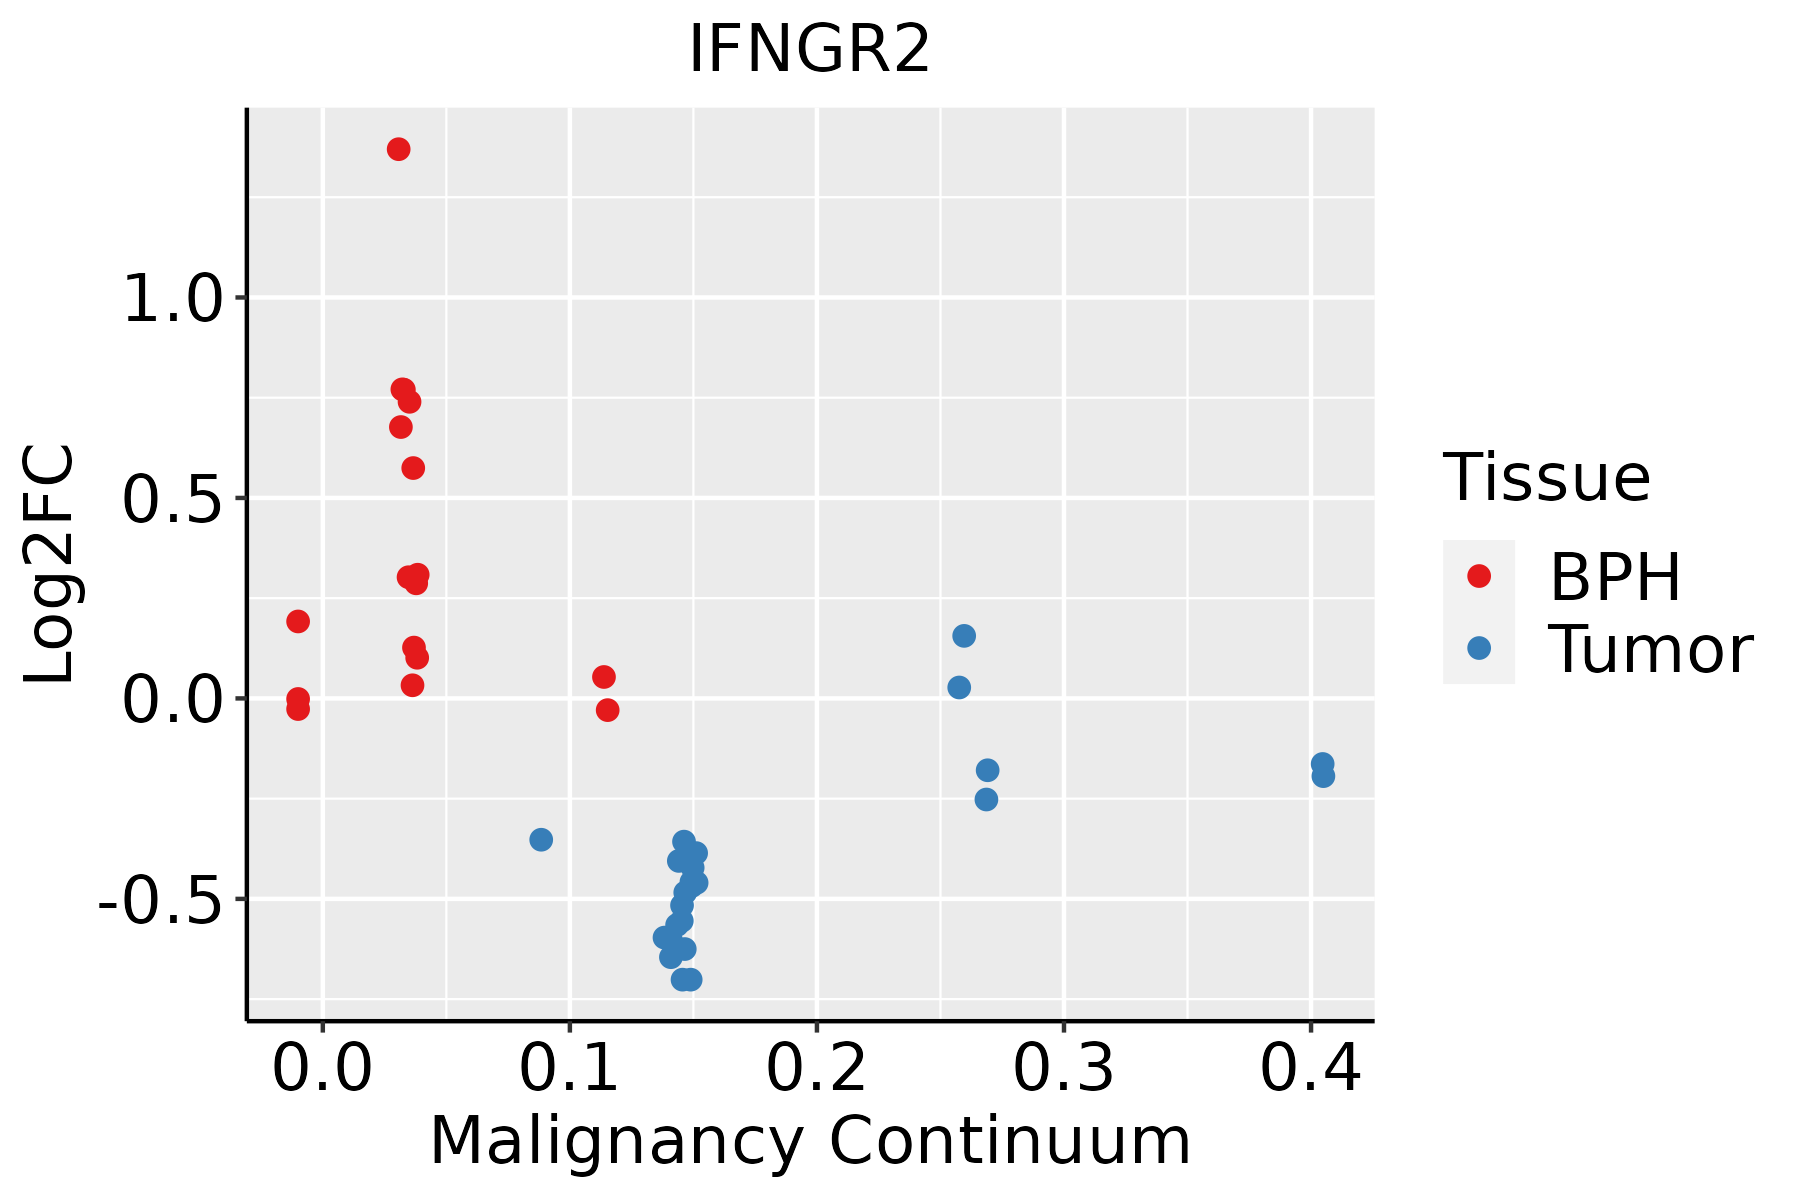 | BPH: Benign Prostatic Hyperplasia |
| Skin | 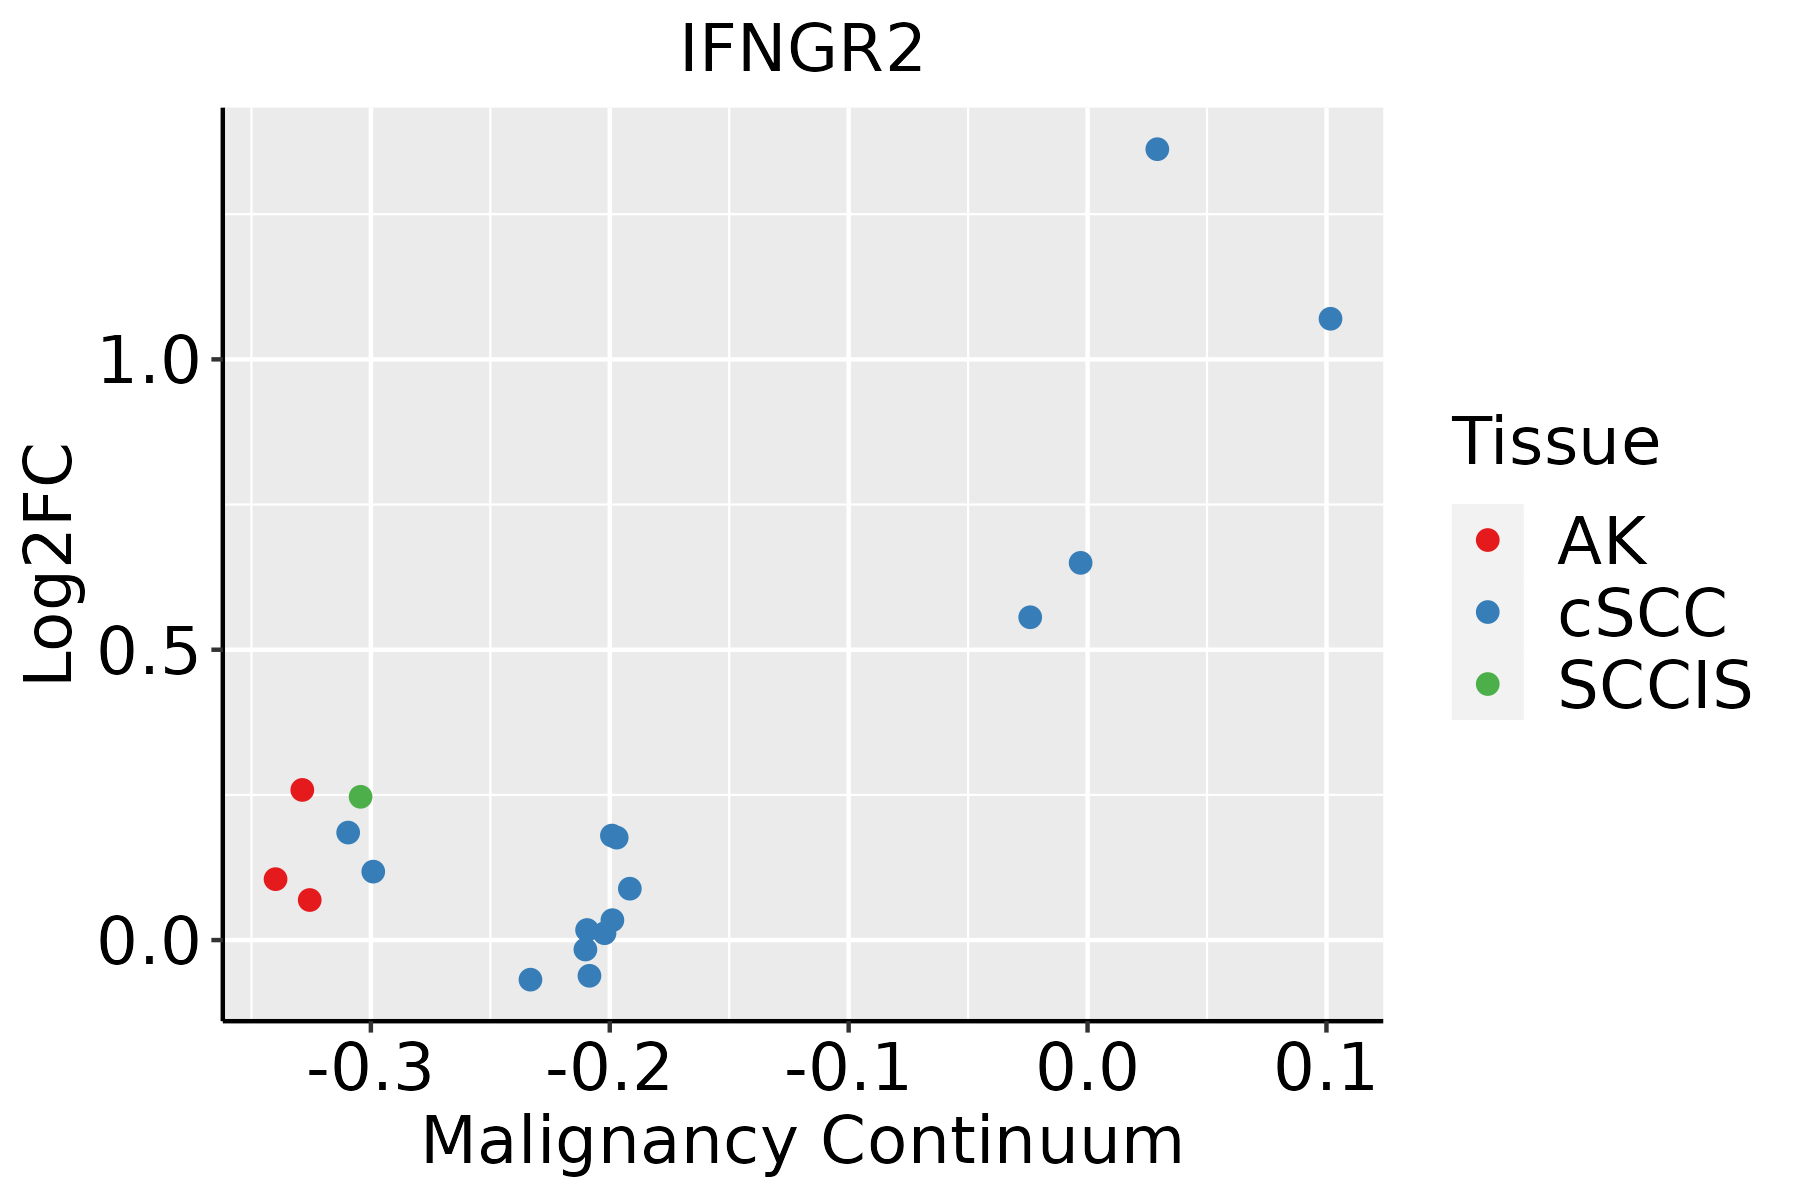 | AK: Actinic keratosis |
| cSCC: Cutaneous squamous cell carcinoma | ||
| SCCIS:squamous cell carcinoma in situ | ||
| Thyroid |  | ATC: Anaplastic thyroid cancer |
| HT: Hashimoto's thyroiditis | ||
| PTC: Papillary thyroid cancer |
| ∗log2FC in expression of this searched gene in stem-like cells from each diseased tissue sample relative to stem-like cells in normal samples in each tissue plotted against the malignancy continuum. Samples are colored based on if they are from different disease stage. |
Top |
Malignant transformation related pathway analysis |
| Find out the enriched GO biological processes and KEGG pathways involved in transition from healthy to precancer to cancer |
| Tissue | Disease Stage | Enriched GO biological Processes |
| Colorectum | AD |  |
| Colorectum | SER |  |
| Colorectum | MSS |  |
| Colorectum | MSI-H |  |
| Colorectum | FAP |  |
| ∗Top 15 enriched GO BP terms are showed in the bar plot of each disease state in each tissue. Each row represents a significant GO biological process which is colored according to the -log10(p.adjust). |
| Page: 1 2 3 4 5 6 7 8 9 |
| GO ID | Tissue | Disease Stage | Description | Gene Ratio | Bg Ratio | pvalue | p.adjust | Count |
| GO:0032411 | Colorectum | AD | positive regulation of transporter activity | 37/3918 | 120/18723 | 6.82e-03 | 4.22e-02 | 37 |
| GO:00324111 | Colorectum | SER | positive regulation of transporter activity | 31/2897 | 120/18723 | 2.25e-03 | 2.16e-02 | 31 |
| GO:0032409 | Colorectum | SER | regulation of transporter activity | 65/2897 | 310/18723 | 5.71e-03 | 4.19e-02 | 65 |
| GO:00324091 | Colorectum | MSS | regulation of transporter activity | 78/3467 | 310/18723 | 2.09e-03 | 1.78e-02 | 78 |
| GO:0034764 | Colorectum | MSS | positive regulation of transmembrane transport | 58/3467 | 219/18723 | 2.19e-03 | 1.83e-02 | 58 |
| GO:00324112 | Colorectum | MSS | positive regulation of transporter activity | 35/3467 | 120/18723 | 2.95e-03 | 2.28e-02 | 35 |
| GO:0022898 | Colorectum | MSS | regulation of transmembrane transporter activity | 70/3467 | 278/18723 | 3.36e-03 | 2.54e-02 | 70 |
| GO:0060333 | Colorectum | MSS | interferon-gamma-mediated signaling pathway | 11/3467 | 27/18723 | 6.03e-03 | 4.04e-02 | 11 |
| GO:0032412 | Colorectum | MSS | regulation of ion transmembrane transporter activity | 66/3467 | 267/18723 | 6.72e-03 | 4.38e-02 | 66 |
| GO:00347641 | Colorectum | FAP | positive regulation of transmembrane transport | 53/2622 | 219/18723 | 3.54e-05 | 7.75e-04 | 53 |
| GO:00228981 | Colorectum | FAP | regulation of transmembrane transporter activity | 62/2622 | 278/18723 | 1.09e-04 | 1.80e-03 | 62 |
| GO:00324121 | Colorectum | FAP | regulation of ion transmembrane transporter activity | 60/2622 | 267/18723 | 1.12e-04 | 1.84e-03 | 60 |
| GO:00324092 | Colorectum | FAP | regulation of transporter activity | 67/2622 | 310/18723 | 1.59e-04 | 2.43e-03 | 67 |
| GO:0043270 | Colorectum | FAP | positive regulation of ion transport | 58/2622 | 275/18723 | 7.98e-04 | 8.36e-03 | 58 |
| GO:0032414 | Colorectum | FAP | positive regulation of ion transmembrane transporter activity | 28/2622 | 109/18723 | 8.64e-04 | 8.87e-03 | 28 |
| GO:00324113 | Colorectum | FAP | positive regulation of transporter activity | 29/2622 | 120/18723 | 1.97e-03 | 1.65e-02 | 29 |
| GO:0034767 | Colorectum | FAP | positive regulation of ion transmembrane transport | 37/2622 | 167/18723 | 2.74e-03 | 2.12e-02 | 37 |
| GO:1904062 | Colorectum | FAP | regulation of cation transmembrane transport | 69/2622 | 357/18723 | 3.06e-03 | 2.30e-02 | 69 |
| GO:000961518 | Esophagus | ESCC | response to virus | 238/8552 | 367/18723 | 6.65e-14 | 3.32e-12 | 238 |
| GO:00516075 | Esophagus | ESCC | defense response to virus | 171/8552 | 265/18723 | 3.91e-10 | 1.05e-08 | 171 |
| Page: 1 2 3 4 5 |
| Pathway ID | Tissue | Disease Stage | Description | Gene Ratio | Bg Ratio | pvalue | p.adjust | qvalue | Count |
| hsa04066 | Colorectum | AD | HIF-1 signaling pathway | 48/2092 | 109/8465 | 7.25e-06 | 7.84e-05 | 5.00e-05 | 48 |
| hsa040661 | Colorectum | AD | HIF-1 signaling pathway | 48/2092 | 109/8465 | 7.25e-06 | 7.84e-05 | 5.00e-05 | 48 |
| hsa040662 | Colorectum | SER | HIF-1 signaling pathway | 36/1580 | 109/8465 | 2.27e-04 | 2.15e-03 | 1.56e-03 | 36 |
| hsa04217 | Colorectum | SER | Necroptosis | 47/1580 | 159/8465 | 5.21e-04 | 4.44e-03 | 3.22e-03 | 47 |
| hsa040663 | Colorectum | SER | HIF-1 signaling pathway | 36/1580 | 109/8465 | 2.27e-04 | 2.15e-03 | 1.56e-03 | 36 |
| hsa042171 | Colorectum | SER | Necroptosis | 47/1580 | 159/8465 | 5.21e-04 | 4.44e-03 | 3.22e-03 | 47 |
| hsa040664 | Colorectum | MSS | HIF-1 signaling pathway | 39/1875 | 109/8465 | 7.61e-04 | 5.00e-03 | 3.06e-03 | 39 |
| hsa040665 | Colorectum | MSS | HIF-1 signaling pathway | 39/1875 | 109/8465 | 7.61e-04 | 5.00e-03 | 3.06e-03 | 39 |
| hsa040666 | Colorectum | FAP | HIF-1 signaling pathway | 38/1404 | 109/8465 | 2.43e-06 | 4.28e-05 | 2.60e-05 | 38 |
| hsa040667 | Colorectum | FAP | HIF-1 signaling pathway | 38/1404 | 109/8465 | 2.43e-06 | 4.28e-05 | 2.60e-05 | 38 |
| hsa0516425 | Esophagus | ESCC | Influenza A | 122/4205 | 171/8465 | 5.01e-09 | 4.79e-08 | 2.45e-08 | 122 |
| hsa0406629 | Esophagus | ESCC | HIF-1 signaling pathway | 75/4205 | 109/8465 | 3.66e-05 | 1.68e-04 | 8.60e-05 | 75 |
| hsa0514525 | Esophagus | ESCC | Toxoplasmosis | 76/4205 | 112/8465 | 6.83e-05 | 2.90e-04 | 1.48e-04 | 76 |
| hsa051527 | Esophagus | ESCC | Tuberculosis | 111/4205 | 180/8465 | 7.14e-04 | 2.32e-03 | 1.19e-03 | 111 |
| hsa052356 | Esophagus | ESCC | PD-L1 expression and PD-1 checkpoint pathway in cancer | 58/4205 | 89/8465 | 2.19e-03 | 6.16e-03 | 3.16e-03 | 58 |
| hsa051425 | Esophagus | ESCC | Chagas disease | 65/4205 | 102/8465 | 2.81e-03 | 7.59e-03 | 3.89e-03 | 65 |
| hsa046599 | Esophagus | ESCC | Th17 cell differentiation | 68/4205 | 108/8465 | 3.53e-03 | 9.30e-03 | 4.76e-03 | 68 |
| hsa046585 | Esophagus | ESCC | Th1 and Th2 cell differentiation | 58/4205 | 92/8465 | 6.49e-03 | 1.60e-02 | 8.19e-03 | 58 |
| hsa0516435 | Esophagus | ESCC | Influenza A | 122/4205 | 171/8465 | 5.01e-09 | 4.79e-08 | 2.45e-08 | 122 |
| hsa04066113 | Esophagus | ESCC | HIF-1 signaling pathway | 75/4205 | 109/8465 | 3.66e-05 | 1.68e-04 | 8.60e-05 | 75 |
| Page: 1 2 3 4 5 6 7 |
Top |
Cell-cell communication analysis |
| Identification of potential cell-cell interactions between two cell types and their ligand-receptor pairs for different disease states |
| Ligand | Receptor | LRpair | Pathway | Tissue | Disease Stage |
| IFNG | IFNGR1_IFNGR2 | IFNG_IFNGR1_IFNGR2 | IFN-II | Breast | DCIS |
| IFNG | IFNGR1_IFNGR2 | IFNG_IFNGR1_IFNGR2 | IFN-II | Breast | Healthy |
| IFNG | IFNGR1_IFNGR2 | IFNG_IFNGR1_IFNGR2 | IFN-II | Breast | IDC |
| IFNG | IFNGR1_IFNGR2 | IFNG_IFNGR1_IFNGR2 | IFN-II | Cervix | ADJ |
| IFNG | IFNGR1_IFNGR2 | IFNG_IFNGR1_IFNGR2 | IFN-II | Cervix | CC |
| IFNG | IFNGR1_IFNGR2 | IFNG_IFNGR1_IFNGR2 | IFN-II | Cervix | Healthy |
| IFNG | IFNGR1_IFNGR2 | IFNG_IFNGR1_IFNGR2 | IFN-II | Cervix | Precancer |
| IFNG | IFNGR1_IFNGR2 | IFNG_IFNGR1_IFNGR2 | IFN-II | Endometrium | ADJ |
| IFNG | IFNGR1_IFNGR2 | IFNG_IFNGR1_IFNGR2 | IFN-II | Endometrium | AEH |
| IFNG | IFNGR1_IFNGR2 | IFNG_IFNGR1_IFNGR2 | IFN-II | Endometrium | EEC |
| IFNG | IFNGR1_IFNGR2 | IFNG_IFNGR1_IFNGR2 | IFN-II | Endometrium | Healthy |
| IFNG | IFNGR1_IFNGR2 | IFNG_IFNGR1_IFNGR2 | IFN-II | GC | ADJ |
| IFNG | IFNGR1_IFNGR2 | IFNG_IFNGR1_IFNGR2 | IFN-II | GC | GC |
| IFNG | IFNGR1_IFNGR2 | IFNG_IFNGR1_IFNGR2 | IFN-II | HNSCC | ADJ |
| IFNG | IFNGR1_IFNGR2 | IFNG_IFNGR1_IFNGR2 | IFN-II | HNSCC | Healthy |
| IFNG | IFNGR1_IFNGR2 | IFNG_IFNGR1_IFNGR2 | IFN-II | HNSCC | OSCC |
| IFNG | IFNGR1_IFNGR2 | IFNG_IFNGR1_IFNGR2 | IFN-II | HNSCC | Precancer |
| IFNG | IFNGR1_IFNGR2 | IFNG_IFNGR1_IFNGR2 | IFN-II | Liver | Healthy |
| IFNG | IFNGR1_IFNGR2 | IFNG_IFNGR1_IFNGR2 | IFN-II | Liver | Precancer |
| IFNG | IFNGR1_IFNGR2 | IFNG_IFNGR1_IFNGR2 | IFN-II | Lung | AAH |
| Page: 1 |
Top |
Single-cell gene regulatory network inference analysis |
| Find out the significant the regulons (TFs) and the target genes of each regulon across cell types for different disease states |
| TF | Cell Type | Tissue | Disease Stage | Target Gene | RSS | Regulon Activity |
| ∗The dot plots of a searched regulon are shown for all cell subpopulations in each disease state of each tissue based on the regulon specific score inferred using pySCENIC and by calculating the average expression. |
| Page: 1 |
Top |
Somatic mutation of malignant transformation related genes |
| Annotation of somatic variants for genes involved in malignant transformation |
| Hugo Symbol | Variant Class | Variant Classification | dbSNP RS | HGVSc | HGVSp | HGVSp Short | SWISSPROT | BIOTYPE | SIFT | PolyPhen | Tumor Sample Barcode | Tissue | Histology | Sex | Age | Stage | Therapy Types | Drugs | Outcome |
| IFNGR2 | SNV | Missense_Mutation | novel | c.319N>A | p.Gln107Lys | p.Q107K | protein_coding | tolerated(0.57) | benign(0.006) | TCGA-AR-A0TU-01 | Breast | breast invasive carcinoma | Female | <65 | I/II | Unspecific | Doxorubicin | SD | |
| IFNGR2 | SNV | Missense_Mutation | rs142997921 | c.566C>T | p.Thr189Met | p.T189M | protein_coding | tolerated(0.12) | benign(0.025) | TCGA-E2-A15S-01 | Breast | breast invasive carcinoma | Female | <65 | I/II | Chemotherapy | doxorubicin | SD | |
| IFNGR2 | deletion | Frame_Shift_Del | novel | c.434delN | p.Val146Ter | p.V146* | protein_coding | TCGA-BH-A0BZ-01 | Breast | breast invasive carcinoma | Female | <65 | III/IV | Chemotherapy | doxorubicin | CR | |||
| IFNGR2 | SNV | Missense_Mutation | novel | c.946N>T | p.Asp316Tyr | p.D316Y | protein_coding | deleterious(0) | probably_damaging(0.988) | TCGA-2W-A8YY-01 | Cervix | cervical & endocervical cancer | Female | <65 | I/II | Chemotherapy | cisplatin | CR | |
| IFNGR2 | SNV | Missense_Mutation | c.605N>T | p.Gly202Val | p.G202V | protein_coding | deleterious(0.02) | benign(0.265) | TCGA-RA-A741-01 | Cervix | cervical & endocervical cancer | Female | <65 | I/II | Chemotherapy | cisplatin | SD | ||
| IFNGR2 | insertion | Frame_Shift_Ins | novel | c.665_666dupAA | p.Pro223AsnfsTer27 | p.P223Nfs*27 | protein_coding | TCGA-BI-A0VS-01 | Cervix | cervical & endocervical cancer | Female | <65 | I/II | Unknown | Unknown | SD | |||
| IFNGR2 | SNV | Missense_Mutation | c.534N>A | p.Phe178Leu | p.F178L | protein_coding | tolerated(0.27) | benign(0.111) | TCGA-AA-3510-01 | Colorectum | colon adenocarcinoma | Male | >=65 | I/II | Unknown | Unknown | SD | ||
| IFNGR2 | SNV | Missense_Mutation | rs760780330 | c.404N>A | p.Arg135Gln | p.R135Q | protein_coding | tolerated(0.09) | possibly_damaging(0.696) | TCGA-AA-A00N-01 | Colorectum | colon adenocarcinoma | Male | >=65 | I/II | Unknown | Unknown | PD | |
| IFNGR2 | SNV | Missense_Mutation | rs369753667 | c.775N>C | p.Asp259His | p.D259H | protein_coding | deleterious(0.01) | possibly_damaging(0.788) | TCGA-AD-5900-01 | Colorectum | colon adenocarcinoma | Male | >=65 | I/II | Unknown | Unknown | SD | |
| IFNGR2 | SNV | Missense_Mutation | rs750400339 | c.827N>T | p.Ser276Leu | p.S276L | protein_coding | tolerated(1) | benign(0) | TCGA-CA-6718-01 | Colorectum | colon adenocarcinoma | Male | <65 | I/II | Unknown | Unknown | PD |
| Page: 1 2 3 4 |
Top |
Related drugs of malignant transformation related genes |
| Identification of chemicals and drugs interact with genes involved in malignant transfromation |
| (DGIdb 4.0) |
| Entrez ID | Symbol | Category | Interaction Types | Drug Claim Name | Drug Name | PMIDs |
| 3460 | IFNGR2 | CLINICALLY ACTIONABLE, DRUGGABLE GENOME | agonist | CHEMBL1201564 | INTERFERON GAMMA-1B | |
| 3460 | IFNGR2 | CLINICALLY ACTIONABLE, DRUGGABLE GENOME | INTERFERON GAMMA-1B | |||
| 3460 | IFNGR2 | CLINICALLY ACTIONABLE, DRUGGABLE GENOME | IFN-GAMMA | INTERFERON GAMMA-1B | ||
| 3460 | IFNGR2 | CLINICALLY ACTIONABLE, DRUGGABLE GENOME | Interferon gamma-1b | |||
| 3460 | IFNGR2 | CLINICALLY ACTIONABLE, DRUGGABLE GENOME | INTERFERON GAMMA-1B |
| Page: 1 |

Copyright 2023-Present -The University of Texas Health Science Center at Houston |