
|
|||||
|
 | |
| |
| |
| |
| |
| |
|
Gene: IFNGR1 |
Gene summary for IFNGR1 |
| Gene information | Species | Human | Gene symbol | IFNGR1 | Gene ID | 3459 |
| Gene name | interferon gamma receptor 1 | |
| Gene Alias | CD119 | |
| Cytomap | 6q23.3 | |
| Gene Type | protein-coding | GO ID | GO:0001774 | UniProtAcc | A0A0S2Z3Y2 |
Top |
Malignant transformation analysis |
| Identification of the aberrant gene expression in precancerous and cancerous lesions by comparing the gene expression of stem-like cells in diseased tissues with normal stem cells |
| Entrez ID | Symbol | Replicates | Species | Organ | Tissue | Adj P-value | Log2FC | Malignancy |
| 3459 | IFNGR1 | LZE4T | Human | Esophagus | ESCC | 5.77e-09 | 6.05e-01 | 0.0811 |
| 3459 | IFNGR1 | LZE7T | Human | Esophagus | ESCC | 4.05e-04 | 1.72e-01 | 0.0667 |
| 3459 | IFNGR1 | LZE8T | Human | Esophagus | ESCC | 2.74e-09 | 7.32e-01 | 0.067 |
| 3459 | IFNGR1 | LZE22D1 | Human | Esophagus | HGIN | 6.22e-03 | -1.22e-01 | 0.0595 |
| 3459 | IFNGR1 | LZE24T | Human | Esophagus | ESCC | 8.00e-10 | 4.94e-01 | 0.0596 |
| 3459 | IFNGR1 | LZE21T | Human | Esophagus | ESCC | 3.97e-02 | 5.94e-01 | 0.0655 |
| 3459 | IFNGR1 | P1T-E | Human | Esophagus | ESCC | 4.58e-08 | 8.81e-01 | 0.0875 |
| 3459 | IFNGR1 | P2T-E | Human | Esophagus | ESCC | 8.74e-21 | 3.80e-01 | 0.1177 |
| 3459 | IFNGR1 | P4T-E | Human | Esophagus | ESCC | 1.27e-12 | 4.84e-01 | 0.1323 |
| 3459 | IFNGR1 | P5T-E | Human | Esophagus | ESCC | 3.92e-14 | 3.62e-01 | 0.1327 |
| 3459 | IFNGR1 | P8T-E | Human | Esophagus | ESCC | 2.22e-30 | 9.17e-01 | 0.0889 |
| 3459 | IFNGR1 | P9T-E | Human | Esophagus | ESCC | 4.08e-11 | 3.10e-01 | 0.1131 |
| 3459 | IFNGR1 | P10T-E | Human | Esophagus | ESCC | 9.14e-18 | 1.51e-01 | 0.116 |
| 3459 | IFNGR1 | P11T-E | Human | Esophagus | ESCC | 2.38e-11 | 1.21e+00 | 0.1426 |
| 3459 | IFNGR1 | P12T-E | Human | Esophagus | ESCC | 5.87e-27 | 6.80e-01 | 0.1122 |
| 3459 | IFNGR1 | P15T-E | Human | Esophagus | ESCC | 1.27e-11 | 5.22e-01 | 0.1149 |
| 3459 | IFNGR1 | P16T-E | Human | Esophagus | ESCC | 5.13e-26 | 7.39e-01 | 0.1153 |
| 3459 | IFNGR1 | P19T-E | Human | Esophagus | ESCC | 3.61e-05 | 4.13e-01 | 0.1662 |
| 3459 | IFNGR1 | P20T-E | Human | Esophagus | ESCC | 1.63e-10 | 4.79e-01 | 0.1124 |
| 3459 | IFNGR1 | P21T-E | Human | Esophagus | ESCC | 4.98e-26 | 6.46e-01 | 0.1617 |
| Page: 1 2 3 4 5 6 7 |
| Tissue | Expression Dynamics | Abbreviation |
| Esophagus |  | ESCC: Esophageal squamous cell carcinoma |
| HGIN: High-grade intraepithelial neoplasias | ||
| LGIN: Low-grade intraepithelial neoplasias | ||
| Liver | 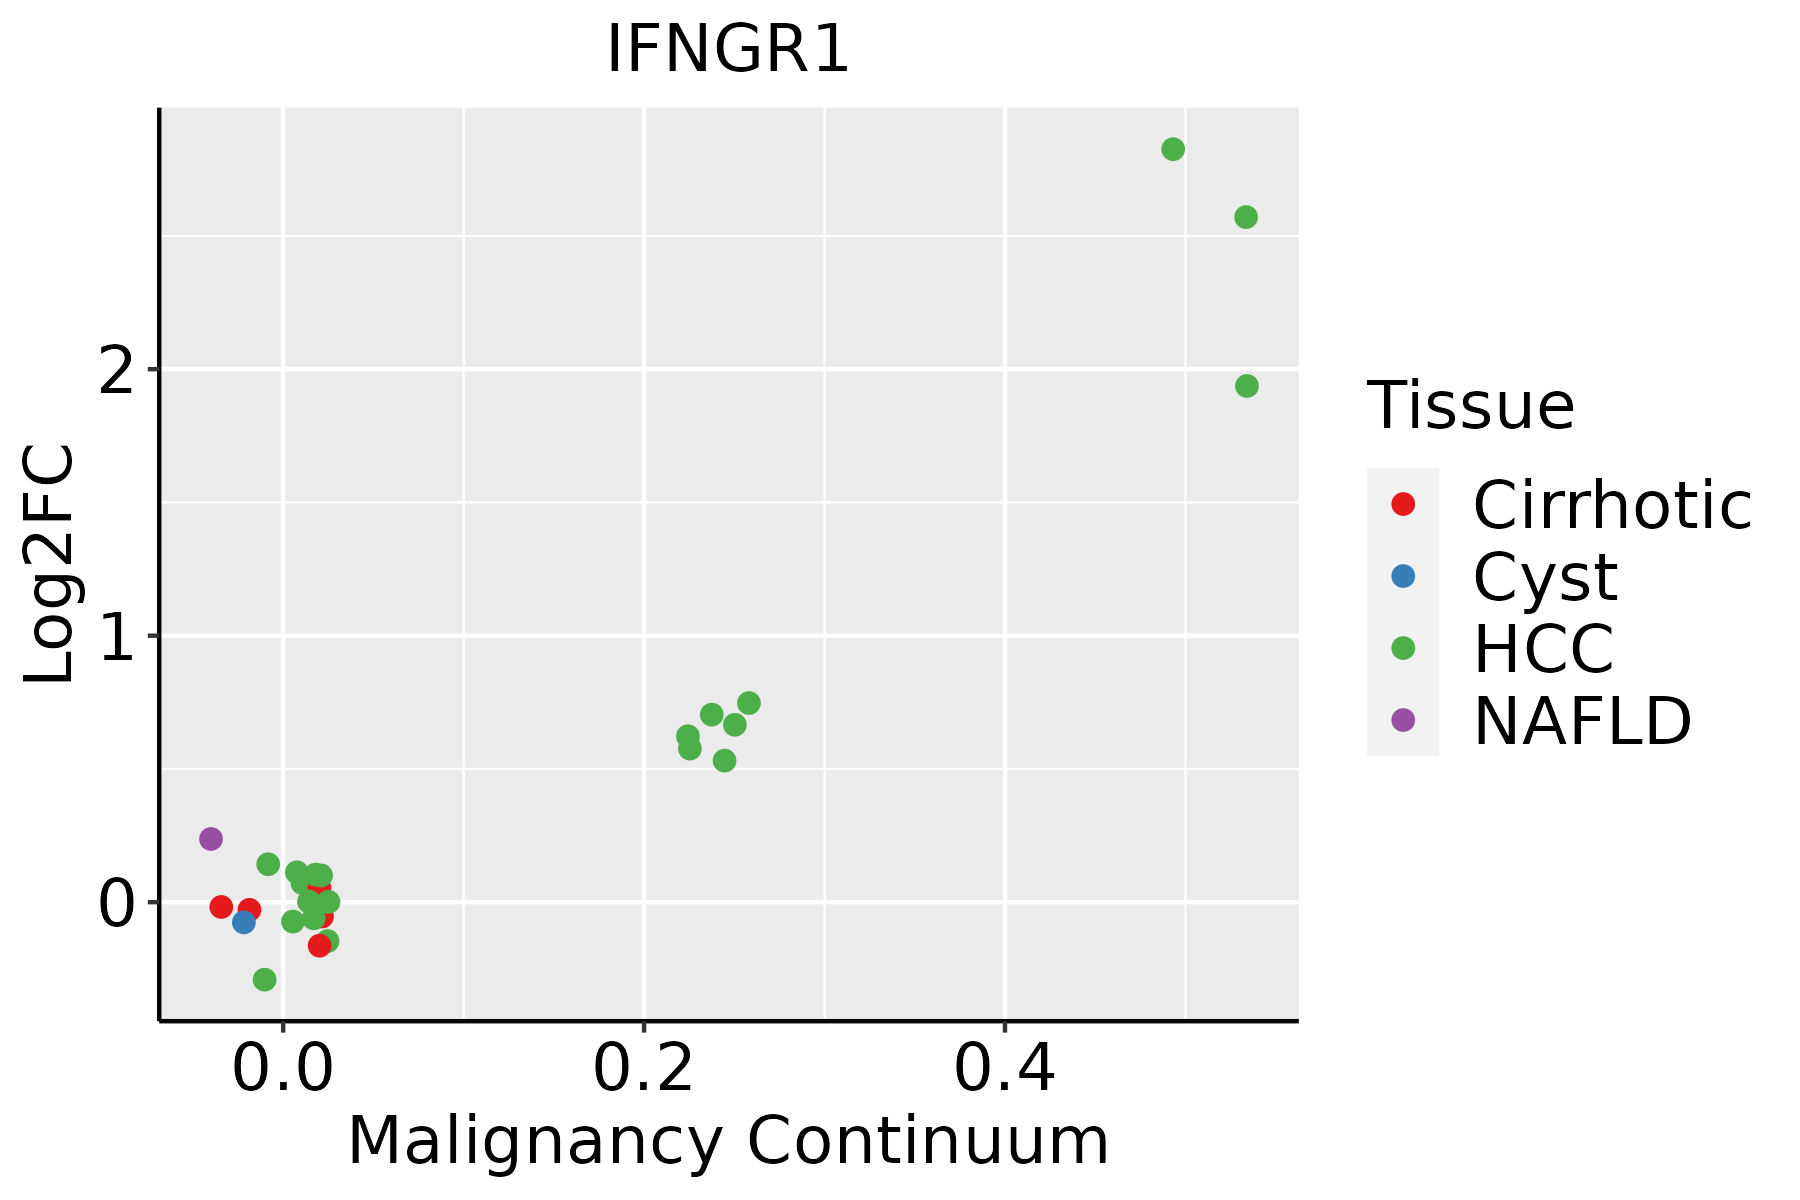 | HCC: Hepatocellular carcinoma |
| NAFLD: Non-alcoholic fatty liver disease | ||
| Oral Cavity | 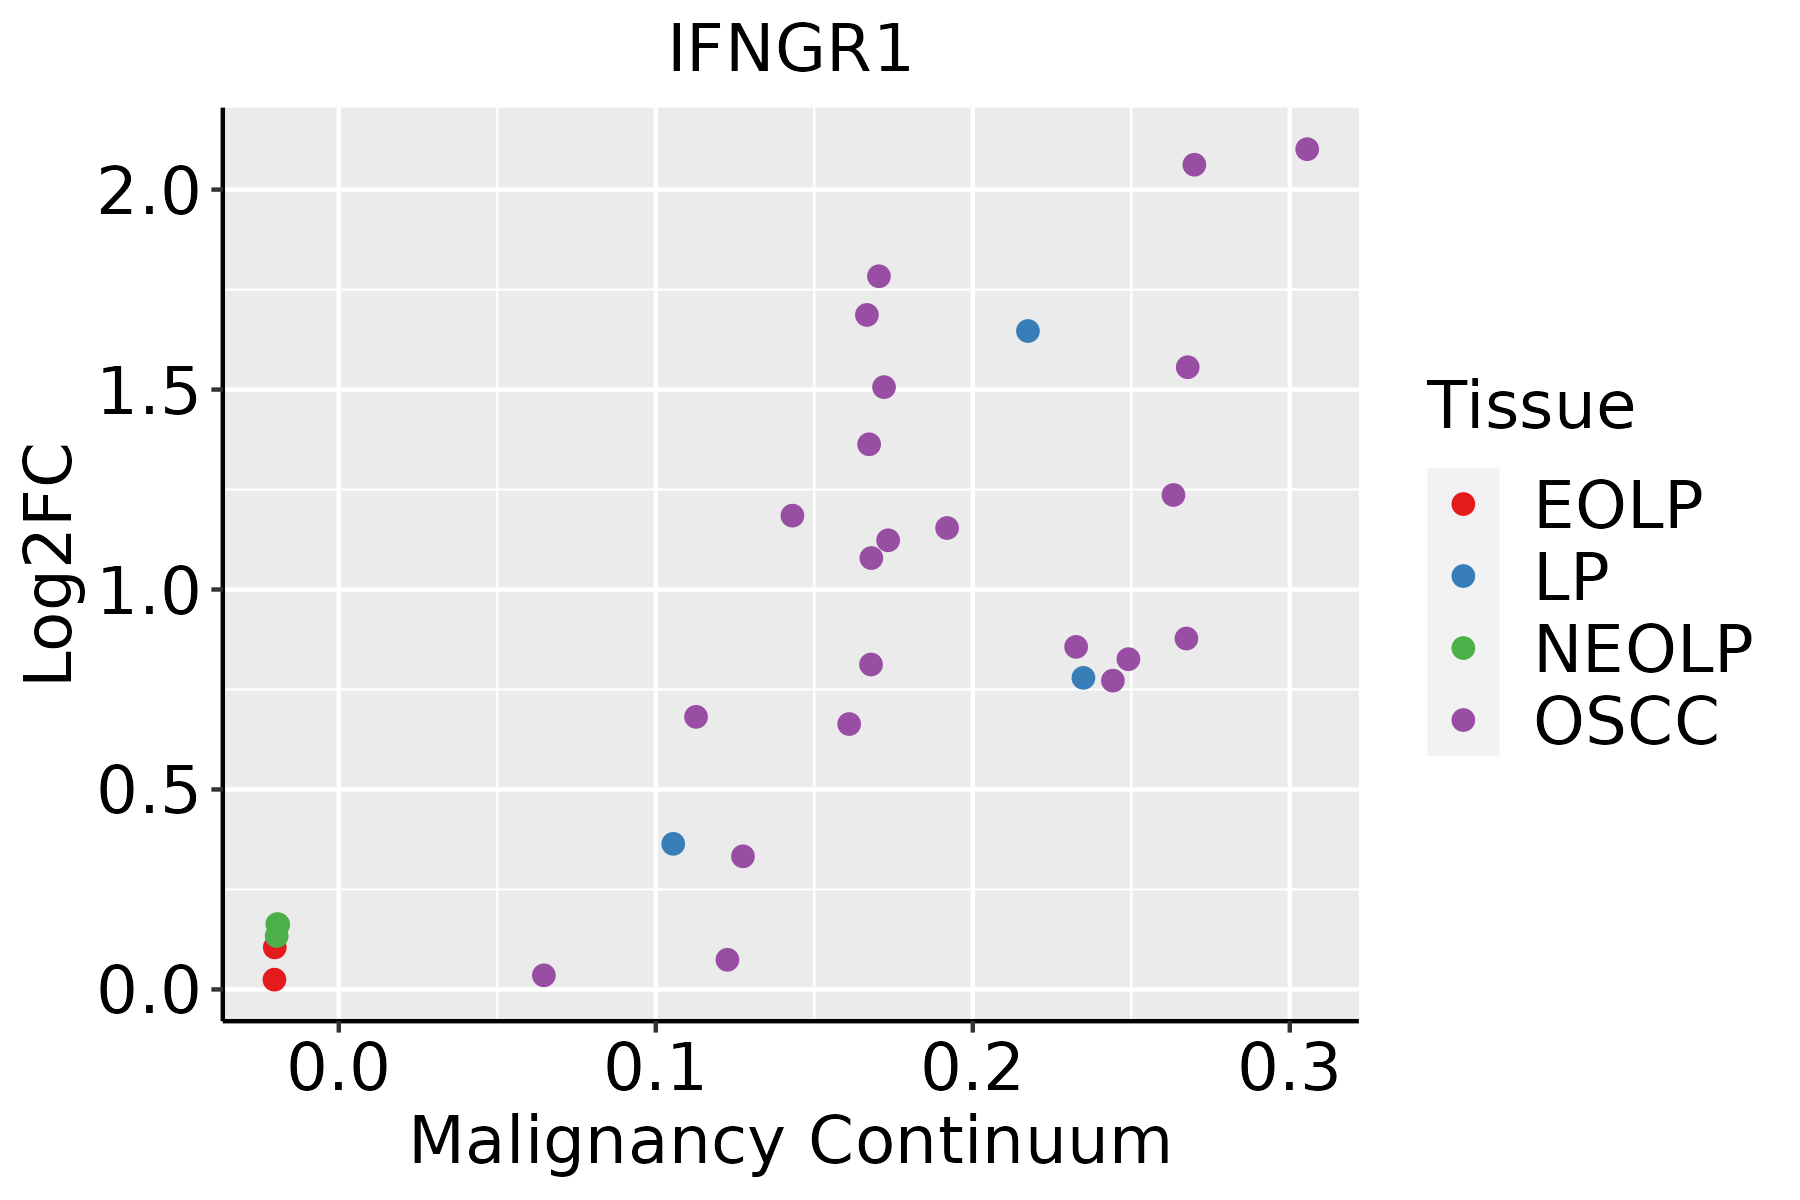 | EOLP: Erosive Oral lichen planus |
| LP: leukoplakia | ||
| NEOLP: Non-erosive oral lichen planus | ||
| OSCC: Oral squamous cell carcinoma | ||
| Prostate |  | BPH: Benign Prostatic Hyperplasia |
| Skin | 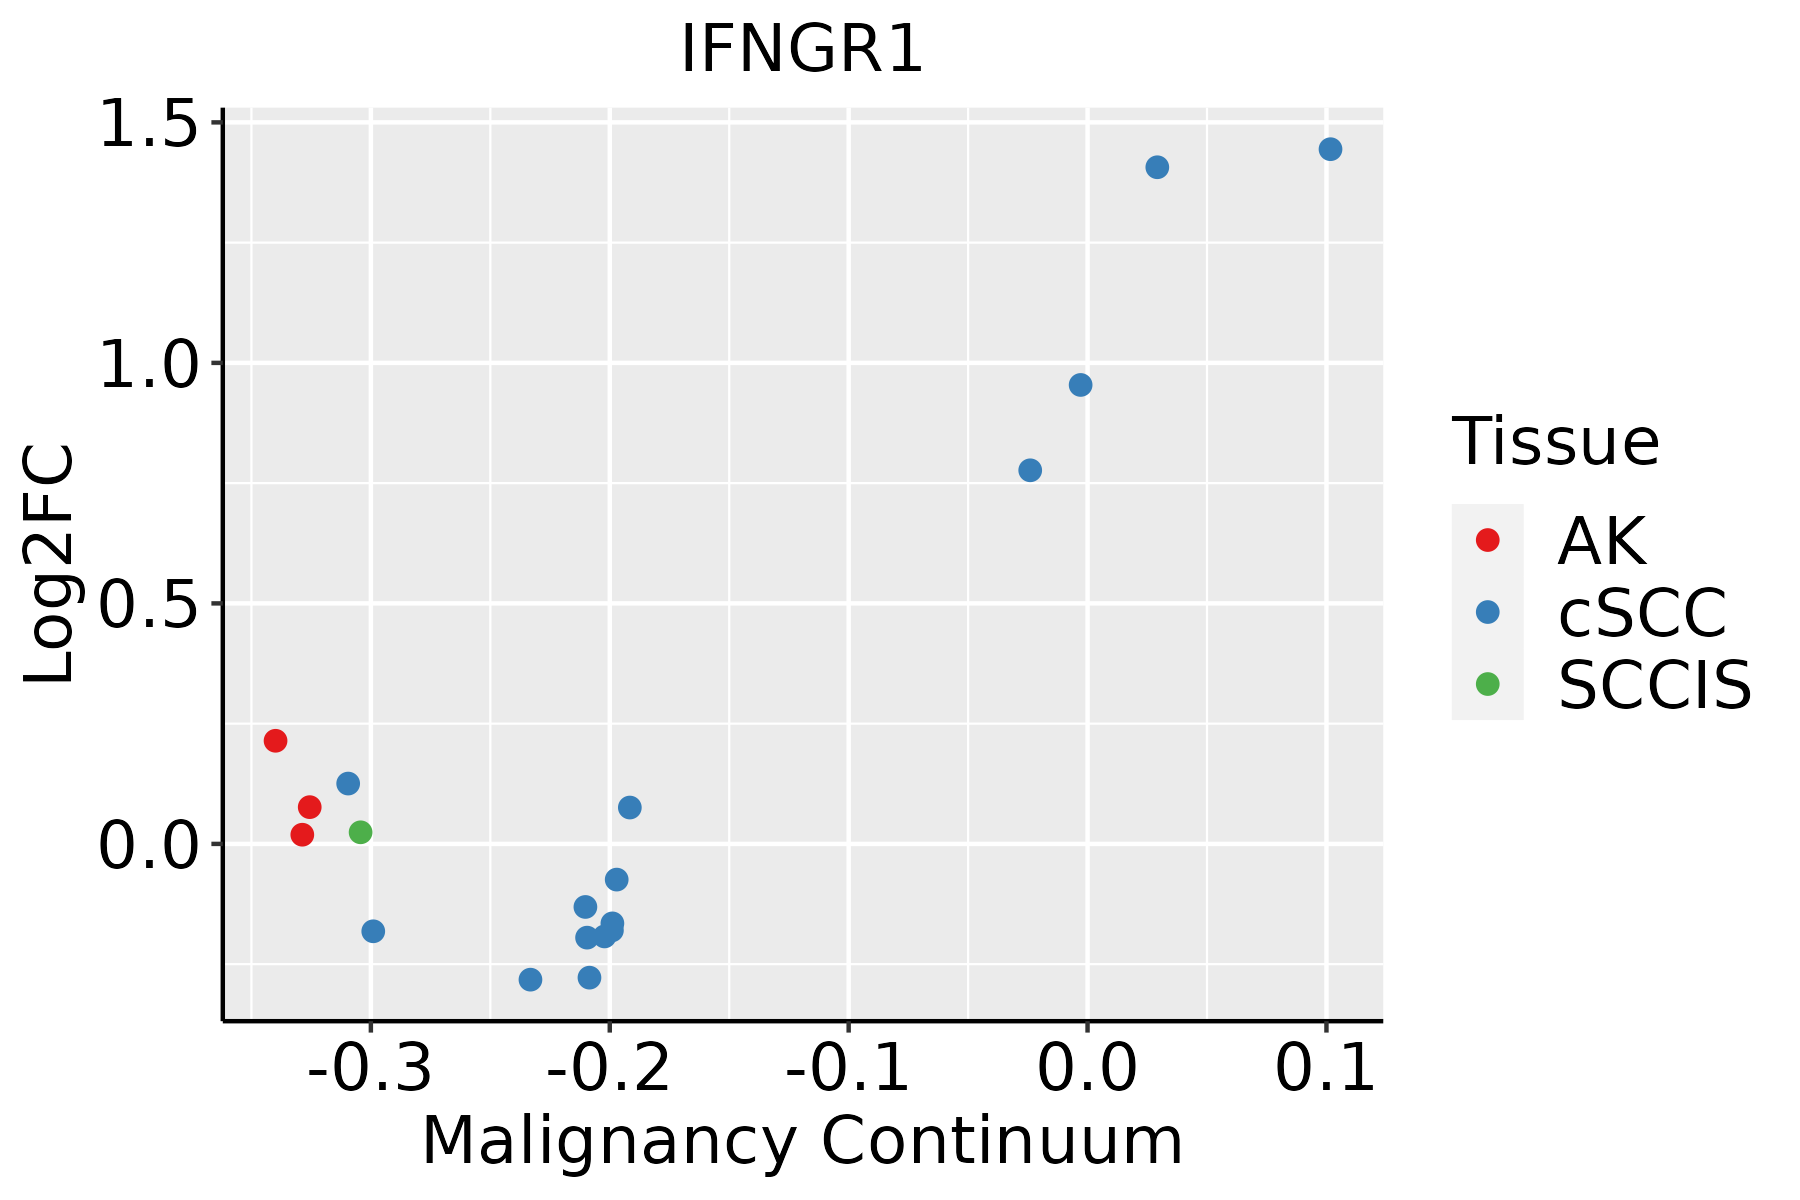 | AK: Actinic keratosis |
| cSCC: Cutaneous squamous cell carcinoma | ||
| SCCIS:squamous cell carcinoma in situ | ||
| Thyroid |  | ATC: Anaplastic thyroid cancer |
| HT: Hashimoto's thyroiditis | ||
| PTC: Papillary thyroid cancer |
| ∗log2FC in expression of this searched gene in stem-like cells from each diseased tissue sample relative to stem-like cells in normal samples in each tissue plotted against the malignancy continuum. Samples are colored based on if they are from different disease stage. |
Top |
Malignant transformation related pathway analysis |
| Find out the enriched GO biological processes and KEGG pathways involved in transition from healthy to precancer to cancer |
| Tissue | Disease Stage | Enriched GO biological Processes |
| Colorectum | AD |  |
| Colorectum | SER |  |
| Colorectum | MSS |  |
| Colorectum | MSI-H |  |
| Colorectum | FAP |  |
| ∗Top 15 enriched GO BP terms are showed in the bar plot of each disease state in each tissue. Each row represents a significant GO biological process which is colored according to the -log10(p.adjust). |
| Page: 1 2 3 4 5 6 7 8 9 |
| GO ID | Tissue | Disease Stage | Description | Gene Ratio | Bg Ratio | pvalue | p.adjust | Count |
| GO:003425020 | Esophagus | HGIN | positive regulation of cellular amide metabolic process | 53/2587 | 162/18723 | 6.01e-10 | 5.15e-08 | 53 |
| GO:000961517 | Esophagus | HGIN | response to virus | 69/2587 | 367/18723 | 4.39e-03 | 3.86e-02 | 69 |
| GO:0034250111 | Esophagus | ESCC | positive regulation of cellular amide metabolic process | 123/8552 | 162/18723 | 3.32e-15 | 1.93e-13 | 123 |
| GO:000961518 | Esophagus | ESCC | response to virus | 238/8552 | 367/18723 | 6.65e-14 | 3.32e-12 | 238 |
| GO:00420636 | Esophagus | ESCC | gliogenesis | 172/8552 | 301/18723 | 3.75e-05 | 3.04e-04 | 172 |
| GO:00603336 | Esophagus | ESCC | interferon-gamma-mediated signaling pathway | 22/8552 | 27/18723 | 1.49e-04 | 9.92e-04 | 22 |
| GO:00343418 | Esophagus | ESCC | response to interferon-gamma | 86/8552 | 141/18723 | 1.74e-04 | 1.14e-03 | 86 |
| GO:00100016 | Esophagus | ESCC | glial cell differentiation | 129/8552 | 225/18723 | 2.73e-04 | 1.65e-03 | 129 |
| GO:000181916 | Esophagus | ESCC | positive regulation of cytokine production | 244/8552 | 467/18723 | 2.29e-03 | 1.01e-02 | 244 |
| GO:00713466 | Esophagus | ESCC | cellular response to interferon-gamma | 69/8552 | 118/18723 | 3.44e-03 | 1.41e-02 | 69 |
| GO:003425012 | Liver | Cirrhotic | positive regulation of cellular amide metabolic process | 78/4634 | 162/18723 | 8.62e-11 | 4.66e-09 | 78 |
| GO:00343413 | Liver | Cirrhotic | response to interferon-gamma | 60/4634 | 141/18723 | 2.57e-06 | 4.63e-05 | 60 |
| GO:00096155 | Liver | Cirrhotic | response to virus | 126/4634 | 367/18723 | 2.10e-05 | 2.77e-04 | 126 |
| GO:0071346 | Liver | Cirrhotic | cellular response to interferon-gamma | 49/4634 | 118/18723 | 4.43e-05 | 5.22e-04 | 49 |
| GO:00603332 | Liver | Cirrhotic | interferon-gamma-mediated signaling pathway | 16/4634 | 27/18723 | 1.41e-04 | 1.36e-03 | 16 |
| GO:0042063 | Liver | Cirrhotic | gliogenesis | 98/4634 | 301/18723 | 1.28e-03 | 8.60e-03 | 98 |
| GO:0010001 | Liver | Cirrhotic | glial cell differentiation | 75/4634 | 225/18723 | 2.24e-03 | 1.36e-02 | 75 |
| GO:00972421 | Liver | Cirrhotic | amyloid-beta clearance | 17/4634 | 38/18723 | 5.62e-03 | 2.84e-02 | 17 |
| GO:003425022 | Liver | HCC | positive regulation of cellular amide metabolic process | 110/7958 | 162/18723 | 5.14e-11 | 1.92e-09 | 110 |
| GO:000961511 | Liver | HCC | response to virus | 210/7958 | 367/18723 | 7.32e-09 | 1.86e-07 | 210 |
| Page: 1 2 3 4 5 6 7 |
| Pathway ID | Tissue | Disease Stage | Description | Gene Ratio | Bg Ratio | pvalue | p.adjust | qvalue | Count |
| hsa0516730 | Esophagus | HGIN | Kaposi sarcoma-associated herpesvirus infection | 51/1383 | 194/8465 | 2.46e-04 | 2.69e-03 | 2.14e-03 | 51 |
| hsa0516420 | Esophagus | HGIN | Influenza A | 42/1383 | 171/8465 | 3.41e-03 | 2.54e-02 | 2.02e-02 | 42 |
| hsa05167114 | Esophagus | HGIN | Kaposi sarcoma-associated herpesvirus infection | 51/1383 | 194/8465 | 2.46e-04 | 2.69e-03 | 2.14e-03 | 51 |
| hsa05164110 | Esophagus | HGIN | Influenza A | 42/1383 | 171/8465 | 3.41e-03 | 2.54e-02 | 2.02e-02 | 42 |
| hsa05167211 | Esophagus | ESCC | Kaposi sarcoma-associated herpesvirus infection | 136/4205 | 194/8465 | 4.28e-09 | 4.22e-08 | 2.16e-08 | 136 |
| hsa0516425 | Esophagus | ESCC | Influenza A | 122/4205 | 171/8465 | 5.01e-09 | 4.79e-08 | 2.45e-08 | 122 |
| hsa0406629 | Esophagus | ESCC | HIF-1 signaling pathway | 75/4205 | 109/8465 | 3.66e-05 | 1.68e-04 | 8.60e-05 | 75 |
| hsa0514525 | Esophagus | ESCC | Toxoplasmosis | 76/4205 | 112/8465 | 6.83e-05 | 2.90e-04 | 1.48e-04 | 76 |
| hsa051527 | Esophagus | ESCC | Tuberculosis | 111/4205 | 180/8465 | 7.14e-04 | 2.32e-03 | 1.19e-03 | 111 |
| hsa052356 | Esophagus | ESCC | PD-L1 expression and PD-1 checkpoint pathway in cancer | 58/4205 | 89/8465 | 2.19e-03 | 6.16e-03 | 3.16e-03 | 58 |
| hsa051425 | Esophagus | ESCC | Chagas disease | 65/4205 | 102/8465 | 2.81e-03 | 7.59e-03 | 3.89e-03 | 65 |
| hsa046599 | Esophagus | ESCC | Th17 cell differentiation | 68/4205 | 108/8465 | 3.53e-03 | 9.30e-03 | 4.76e-03 | 68 |
| hsa046585 | Esophagus | ESCC | Th1 and Th2 cell differentiation | 58/4205 | 92/8465 | 6.49e-03 | 1.60e-02 | 8.19e-03 | 58 |
| hsa0516738 | Esophagus | ESCC | Kaposi sarcoma-associated herpesvirus infection | 136/4205 | 194/8465 | 4.28e-09 | 4.22e-08 | 2.16e-08 | 136 |
| hsa0516435 | Esophagus | ESCC | Influenza A | 122/4205 | 171/8465 | 5.01e-09 | 4.79e-08 | 2.45e-08 | 122 |
| hsa04066113 | Esophagus | ESCC | HIF-1 signaling pathway | 75/4205 | 109/8465 | 3.66e-05 | 1.68e-04 | 8.60e-05 | 75 |
| hsa05145111 | Esophagus | ESCC | Toxoplasmosis | 76/4205 | 112/8465 | 6.83e-05 | 2.90e-04 | 1.48e-04 | 76 |
| hsa0515212 | Esophagus | ESCC | Tuberculosis | 111/4205 | 180/8465 | 7.14e-04 | 2.32e-03 | 1.19e-03 | 111 |
| hsa0523511 | Esophagus | ESCC | PD-L1 expression and PD-1 checkpoint pathway in cancer | 58/4205 | 89/8465 | 2.19e-03 | 6.16e-03 | 3.16e-03 | 58 |
| hsa0514213 | Esophagus | ESCC | Chagas disease | 65/4205 | 102/8465 | 2.81e-03 | 7.59e-03 | 3.89e-03 | 65 |
| Page: 1 2 3 4 5 6 7 |
Top |
Cell-cell communication analysis |
| Identification of potential cell-cell interactions between two cell types and their ligand-receptor pairs for different disease states |
| Ligand | Receptor | LRpair | Pathway | Tissue | Disease Stage |
| IFNG | IFNGR1_IFNGR2 | IFNG_IFNGR1_IFNGR2 | IFN-II | Breast | DCIS |
| IFNG | IFNGR1_IFNGR2 | IFNG_IFNGR1_IFNGR2 | IFN-II | Breast | Healthy |
| IFNG | IFNGR1_IFNGR2 | IFNG_IFNGR1_IFNGR2 | IFN-II | Breast | IDC |
| IFNG | IFNGR1_IFNGR2 | IFNG_IFNGR1_IFNGR2 | IFN-II | Cervix | ADJ |
| IFNG | IFNGR1_IFNGR2 | IFNG_IFNGR1_IFNGR2 | IFN-II | Cervix | CC |
| IFNG | IFNGR1_IFNGR2 | IFNG_IFNGR1_IFNGR2 | IFN-II | Cervix | Healthy |
| IFNG | IFNGR1_IFNGR2 | IFNG_IFNGR1_IFNGR2 | IFN-II | Cervix | Precancer |
| IFNG | IFNGR1_IFNGR2 | IFNG_IFNGR1_IFNGR2 | IFN-II | Endometrium | ADJ |
| IFNG | IFNGR1_IFNGR2 | IFNG_IFNGR1_IFNGR2 | IFN-II | Endometrium | AEH |
| IFNG | IFNGR1_IFNGR2 | IFNG_IFNGR1_IFNGR2 | IFN-II | Endometrium | EEC |
| IFNG | IFNGR1_IFNGR2 | IFNG_IFNGR1_IFNGR2 | IFN-II | Endometrium | Healthy |
| IFNG | IFNGR1_IFNGR2 | IFNG_IFNGR1_IFNGR2 | IFN-II | GC | ADJ |
| IFNG | IFNGR1_IFNGR2 | IFNG_IFNGR1_IFNGR2 | IFN-II | GC | GC |
| IFNG | IFNGR1_IFNGR2 | IFNG_IFNGR1_IFNGR2 | IFN-II | HNSCC | ADJ |
| IFNG | IFNGR1_IFNGR2 | IFNG_IFNGR1_IFNGR2 | IFN-II | HNSCC | Healthy |
| IFNG | IFNGR1_IFNGR2 | IFNG_IFNGR1_IFNGR2 | IFN-II | HNSCC | OSCC |
| IFNG | IFNGR1_IFNGR2 | IFNG_IFNGR1_IFNGR2 | IFN-II | HNSCC | Precancer |
| IFNG | IFNGR1_IFNGR2 | IFNG_IFNGR1_IFNGR2 | IFN-II | Liver | Healthy |
| IFNG | IFNGR1_IFNGR2 | IFNG_IFNGR1_IFNGR2 | IFN-II | Liver | Precancer |
| IFNG | IFNGR1_IFNGR2 | IFNG_IFNGR1_IFNGR2 | IFN-II | Lung | AAH |
| Page: 1 |
Top |
Single-cell gene regulatory network inference analysis |
| Find out the significant the regulons (TFs) and the target genes of each regulon across cell types for different disease states |
| TF | Cell Type | Tissue | Disease Stage | Target Gene | RSS | Regulon Activity |
| ∗The dot plots of a searched regulon are shown for all cell subpopulations in each disease state of each tissue based on the regulon specific score inferred using pySCENIC and by calculating the average expression. |
| Page: 1 |
Top |
Somatic mutation of malignant transformation related genes |
| Annotation of somatic variants for genes involved in malignant transformation |
| Hugo Symbol | Variant Class | Variant Classification | dbSNP RS | HGVSc | HGVSp | HGVSp Short | SWISSPROT | BIOTYPE | SIFT | PolyPhen | Tumor Sample Barcode | Tissue | Histology | Sex | Age | Stage | Therapy Types | Drugs | Outcome |
| IFNGR1 | SNV | Missense_Mutation | novel | c.534G>T | p.Met178Ile | p.M178I | P15260 | protein_coding | tolerated(1) | benign(0) | TCGA-AN-A046-01 | Breast | breast invasive carcinoma | Female | >=65 | I/II | Unknown | Unknown | SD |
| IFNGR1 | insertion | Frame_Shift_Ins | novel | c.1217_1218insG | p.Asp406GlufsTer8 | p.D406Efs*8 | P15260 | protein_coding | TCGA-AO-A128-01 | Breast | breast invasive carcinoma | Female | <65 | I/II | Chemotherapy | doxorubicin | SD | ||
| IFNGR1 | insertion | Nonsense_Mutation | novel | c.1216_1217insTACACTA | p.Asp406ValfsTer3 | p.D406Vfs*3 | P15260 | protein_coding | TCGA-AO-A128-01 | Breast | breast invasive carcinoma | Female | <65 | I/II | Chemotherapy | doxorubicin | SD | ||
| IFNGR1 | SNV | Missense_Mutation | novel | c.122A>G | p.Asn41Ser | p.N41S | P15260 | protein_coding | deleterious(0.01) | probably_damaging(0.975) | TCGA-2W-A8YY-01 | Cervix | cervical & endocervical cancer | Female | <65 | I/II | Chemotherapy | cisplatin | CR |
| IFNGR1 | SNV | Missense_Mutation | novel | c.1439N>C | p.Arg480Thr | p.R480T | P15260 | protein_coding | deleterious(0) | probably_damaging(0.997) | TCGA-C5-A1MH-01 | Cervix | cervical & endocervical cancer | Female | >=65 | III/IV | Chemotherapy | cisplatin | PD |
| IFNGR1 | SNV | Missense_Mutation | c.332N>G | p.Ser111Cys | p.S111C | P15260 | protein_coding | deleterious(0) | probably_damaging(0.999) | TCGA-JW-A5VJ-01 | Cervix | cervical & endocervical cancer | Female | <65 | I/II | Unknown | Unknown | PD | |
| IFNGR1 | SNV | Missense_Mutation | c.439N>T | p.His147Tyr | p.H147Y | P15260 | protein_coding | deleterious(0.03) | possibly_damaging(0.731) | TCGA-LP-A5U2-01 | Cervix | cervical & endocervical cancer | Female | <65 | III/IV | Unknown | Unknown | SD | |
| IFNGR1 | SNV | Missense_Mutation | novel | c.1121N>G | p.Ile374Arg | p.I374R | P15260 | protein_coding | tolerated(0.07) | benign(0.04) | TCGA-AA-3877-01 | Colorectum | colon adenocarcinoma | Female | >=65 | I/II | Unknown | Unknown | SD |
| IFNGR1 | SNV | Missense_Mutation | c.813G>T | p.Lys271Asn | p.K271N | P15260 | protein_coding | deleterious(0) | probably_damaging(0.989) | TCGA-AA-3977-01 | Colorectum | colon adenocarcinoma | Male | >=65 | I/II | Unknown | Unknown | SD | |
| IFNGR1 | SNV | Missense_Mutation | novel | c.1267N>G | p.Ser423Gly | p.S423G | P15260 | protein_coding | tolerated(0.19) | benign(0.012) | TCGA-CA-6717-01 | Colorectum | colon adenocarcinoma | Male | <65 | I/II | Chemotherapy | oxaliplatin | CR |
| Page: 1 2 3 4 5 6 |
Top |
Related drugs of malignant transformation related genes |
| Identification of chemicals and drugs interact with genes involved in malignant transfromation |
| (DGIdb 4.0) |
| Entrez ID | Symbol | Category | Interaction Types | Drug Claim Name | Drug Name | PMIDs |
| 3459 | IFNGR1 | DRUGGABLE GENOME, CLINICALLY ACTIONABLE | INDOLE-3-CARBINOL | INDOLE-3-CARBINOL | 14988219 | |
| 3459 | IFNGR1 | DRUGGABLE GENOME, CLINICALLY ACTIONABLE | INTERFERON GAMMA-1B | |||
| 3459 | IFNGR1 | DRUGGABLE GENOME, CLINICALLY ACTIONABLE | agonist | CHEMBL1201564 | INTERFERON GAMMA-1B | |
| 3459 | IFNGR1 | DRUGGABLE GENOME, CLINICALLY ACTIONABLE | IFN-GAMMA | INTERFERON GAMMA-1B | ||
| 3459 | IFNGR1 | DRUGGABLE GENOME, CLINICALLY ACTIONABLE | INTERFERON GAMMA-1B |
| Page: 1 |

Copyright 2023-Present -The University of Texas Health Science Center at Houston |