
|
|||||
|
 | |
| |
| |
| |
| |
| |
|
Gene: IFNAR2 |
Gene summary for IFNAR2 |
| Gene information | Species | Human | Gene symbol | IFNAR2 | Gene ID | 3455 |
| Gene name | interferon alpha and beta receptor subunit 2 | |
| Gene Alias | IFN-R | |
| Cytomap | 21q22.11 | |
| Gene Type | protein-coding | GO ID | GO:0002376 | UniProtAcc | P48551 |
Top |
Malignant transformation analysis |
| Identification of the aberrant gene expression in precancerous and cancerous lesions by comparing the gene expression of stem-like cells in diseased tissues with normal stem cells |
| Entrez ID | Symbol | Replicates | Species | Organ | Tissue | Adj P-value | Log2FC | Malignancy |
| 3455 | IFNAR2 | LZE2T | Human | Esophagus | ESCC | 7.21e-03 | 3.45e-01 | 0.082 |
| 3455 | IFNAR2 | LZE4T | Human | Esophagus | ESCC | 1.22e-04 | 1.65e-01 | 0.0811 |
| 3455 | IFNAR2 | LZE5T | Human | Esophagus | ESCC | 4.09e-03 | 2.34e-01 | 0.0514 |
| 3455 | IFNAR2 | LZE7T | Human | Esophagus | ESCC | 6.75e-03 | 2.66e-01 | 0.0667 |
| 3455 | IFNAR2 | LZE22T | Human | Esophagus | ESCC | 2.96e-02 | 2.90e-01 | 0.068 |
| 3455 | IFNAR2 | LZE24T | Human | Esophagus | ESCC | 4.36e-10 | 2.15e-01 | 0.0596 |
| 3455 | IFNAR2 | LZE21T | Human | Esophagus | ESCC | 1.52e-04 | 2.36e-01 | 0.0655 |
| 3455 | IFNAR2 | P1T-E | Human | Esophagus | ESCC | 1.46e-04 | 3.13e-01 | 0.0875 |
| 3455 | IFNAR2 | P2T-E | Human | Esophagus | ESCC | 4.12e-32 | 5.81e-01 | 0.1177 |
| 3455 | IFNAR2 | P4T-E | Human | Esophagus | ESCC | 1.62e-19 | 4.95e-01 | 0.1323 |
| 3455 | IFNAR2 | P5T-E | Human | Esophagus | ESCC | 5.60e-14 | 2.35e-01 | 0.1327 |
| 3455 | IFNAR2 | P8T-E | Human | Esophagus | ESCC | 2.63e-13 | 2.55e-01 | 0.0889 |
| 3455 | IFNAR2 | P9T-E | Human | Esophagus | ESCC | 5.68e-12 | 3.26e-01 | 0.1131 |
| 3455 | IFNAR2 | P10T-E | Human | Esophagus | ESCC | 1.44e-23 | 3.39e-01 | 0.116 |
| 3455 | IFNAR2 | P11T-E | Human | Esophagus | ESCC | 1.31e-15 | 5.67e-01 | 0.1426 |
| 3455 | IFNAR2 | P12T-E | Human | Esophagus | ESCC | 2.77e-15 | 3.00e-01 | 0.1122 |
| 3455 | IFNAR2 | P15T-E | Human | Esophagus | ESCC | 1.37e-08 | 2.02e-01 | 0.1149 |
| 3455 | IFNAR2 | P16T-E | Human | Esophagus | ESCC | 3.65e-20 | 3.65e-01 | 0.1153 |
| 3455 | IFNAR2 | P17T-E | Human | Esophagus | ESCC | 2.35e-07 | 2.67e-01 | 0.1278 |
| 3455 | IFNAR2 | P19T-E | Human | Esophagus | ESCC | 1.23e-08 | 6.06e-01 | 0.1662 |
| Page: 1 2 3 4 5 6 |
| Tissue | Expression Dynamics | Abbreviation |
| Esophagus |  | ESCC: Esophageal squamous cell carcinoma |
| HGIN: High-grade intraepithelial neoplasias | ||
| LGIN: Low-grade intraepithelial neoplasias | ||
| Liver |  | HCC: Hepatocellular carcinoma |
| NAFLD: Non-alcoholic fatty liver disease | ||
| Lung | 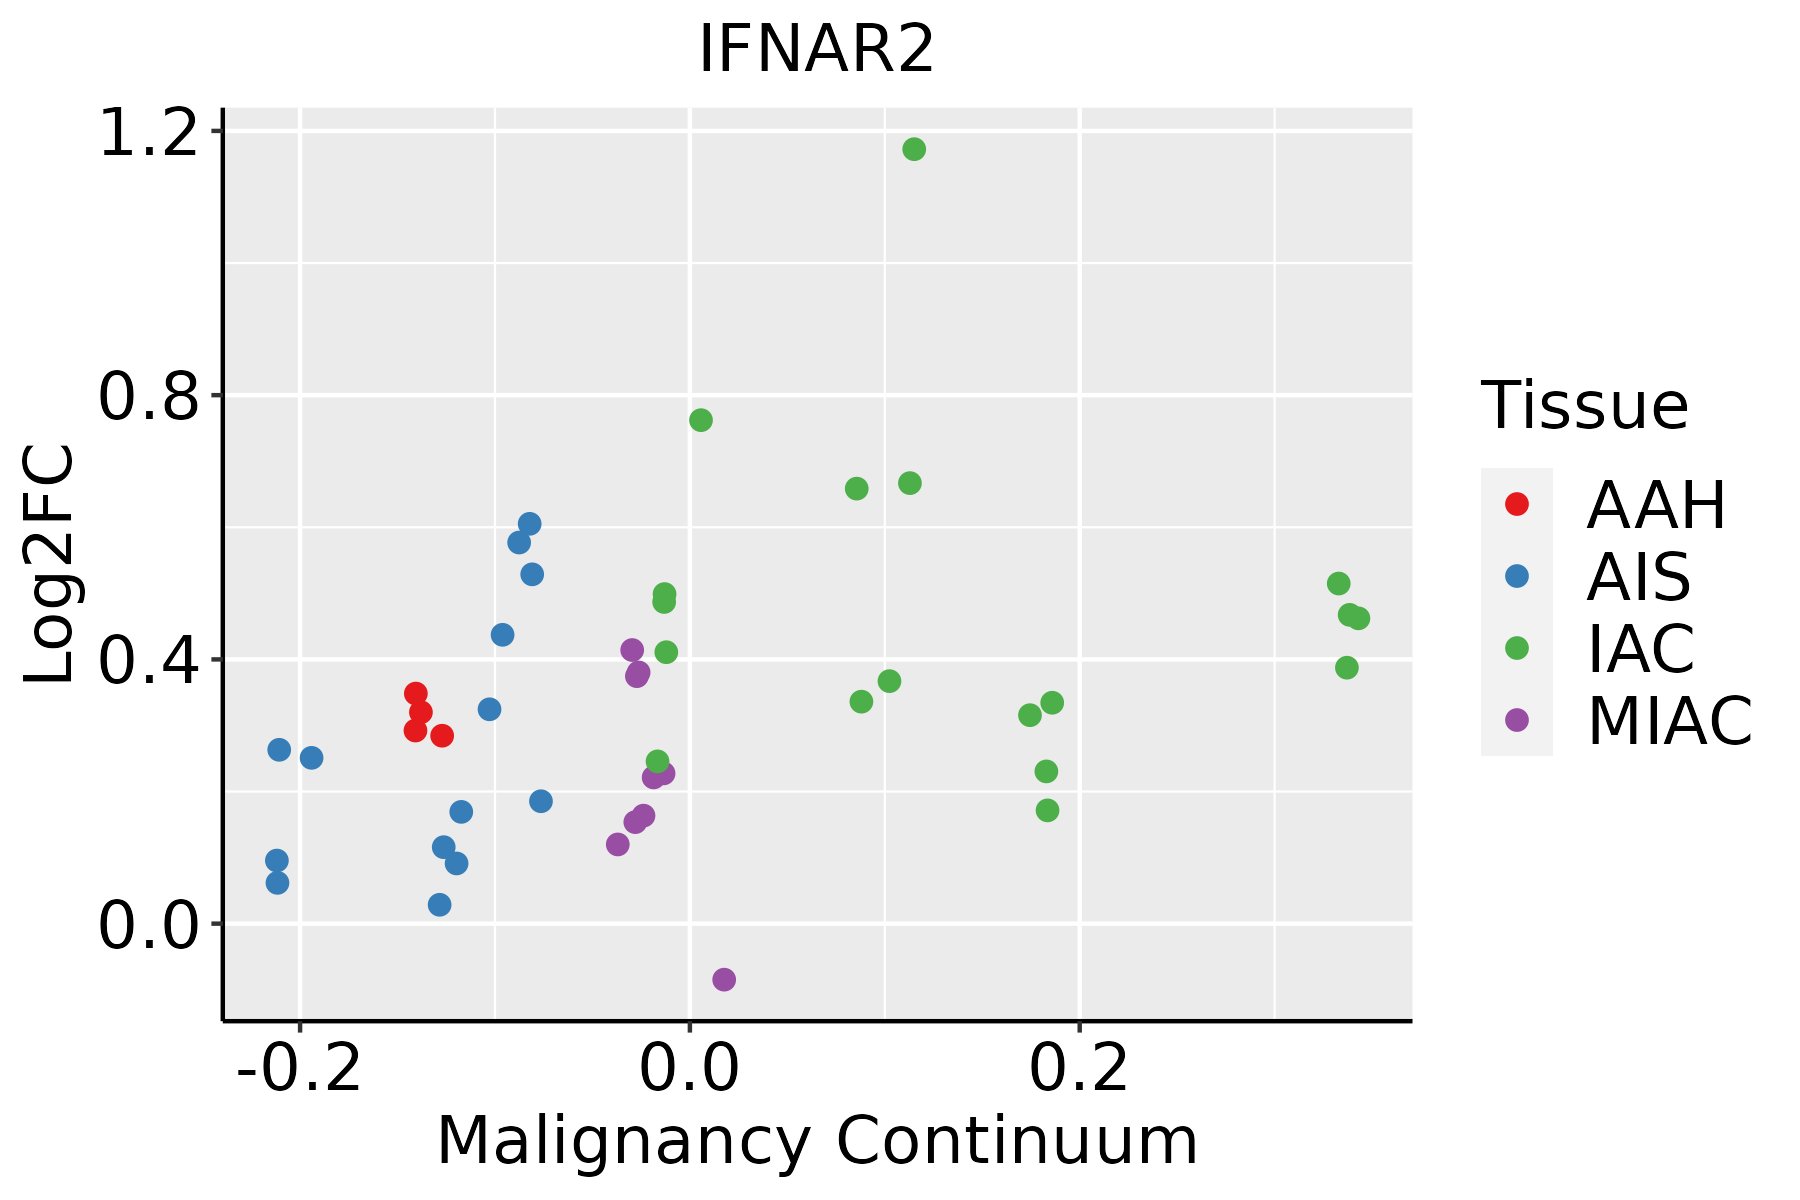 | AAH: Atypical adenomatous hyperplasia |
| AIS: Adenocarcinoma in situ | ||
| IAC: Invasive lung adenocarcinoma | ||
| MIA: Minimally invasive adenocarcinoma | ||
| Oral Cavity | 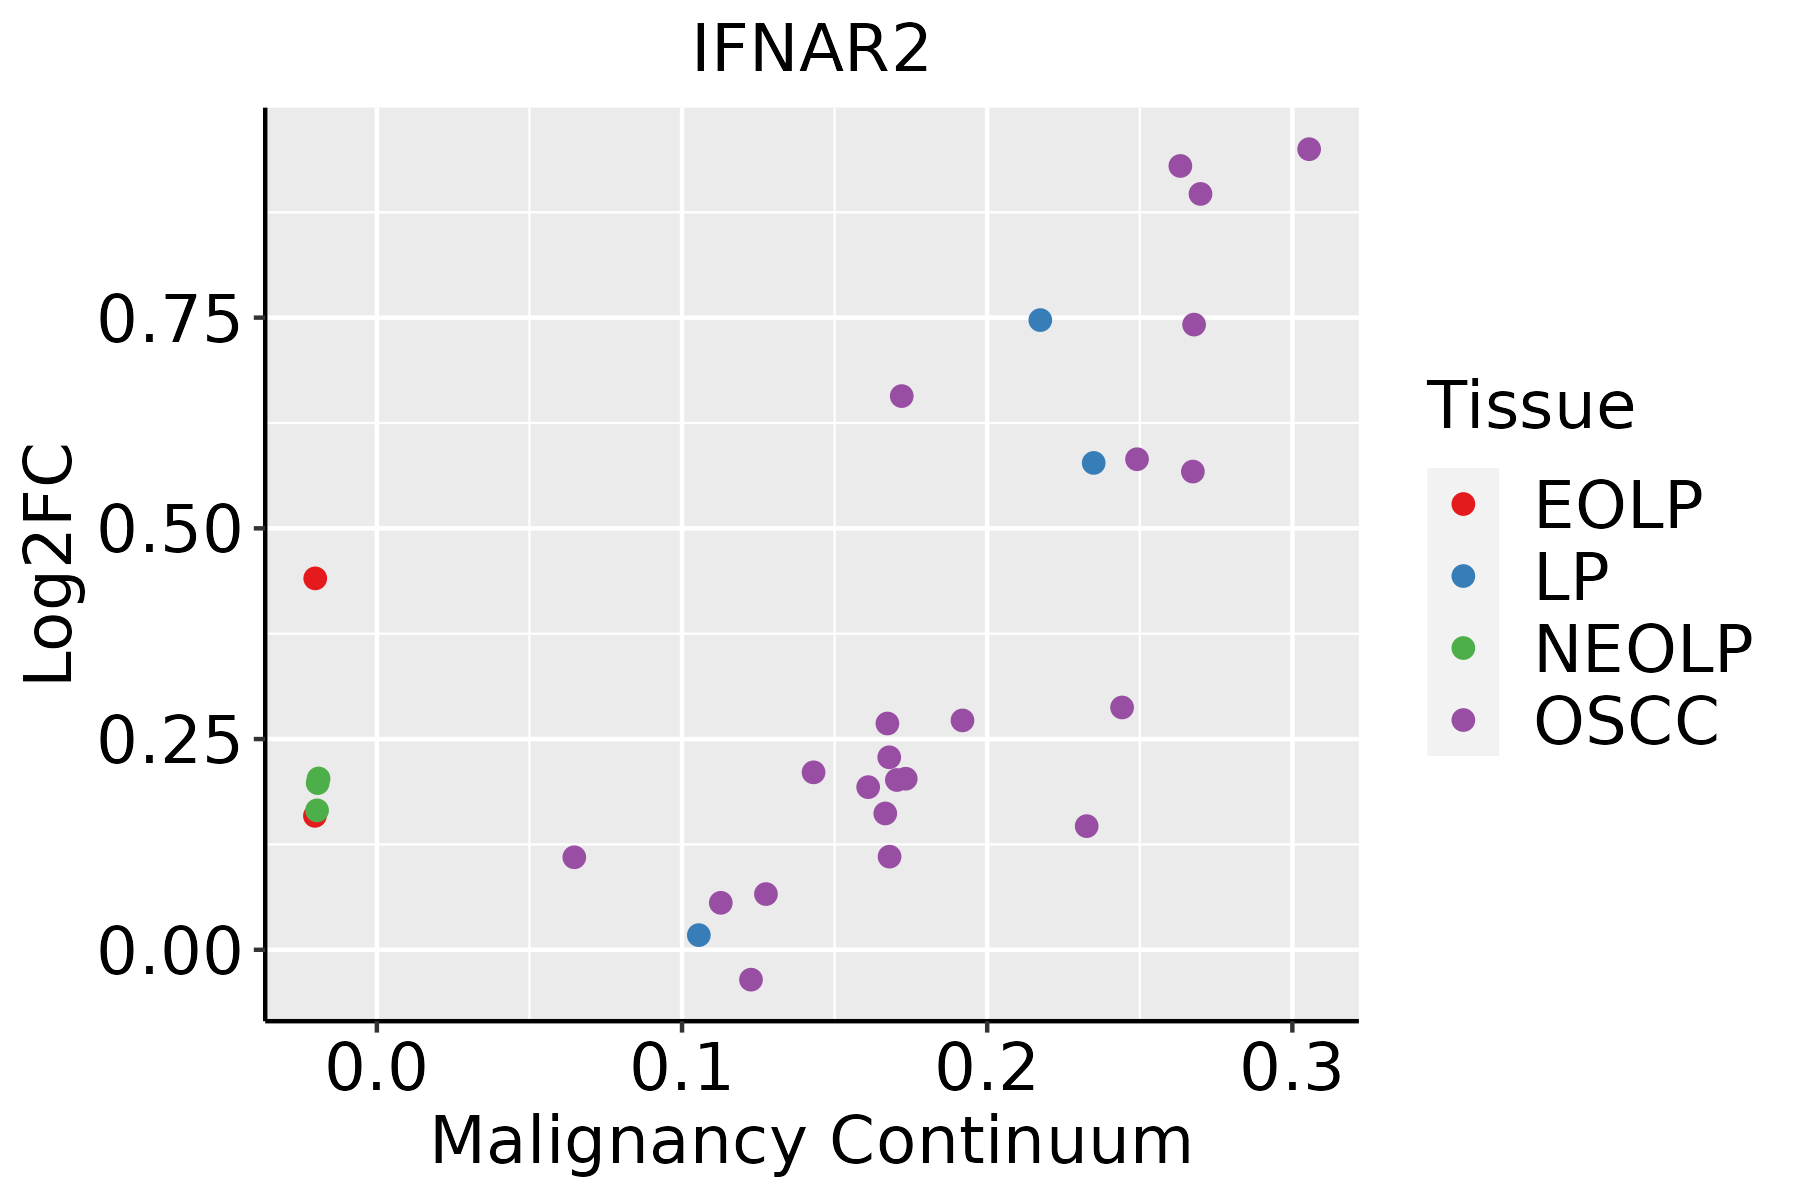 | EOLP: Erosive Oral lichen planus |
| LP: leukoplakia | ||
| NEOLP: Non-erosive oral lichen planus | ||
| OSCC: Oral squamous cell carcinoma | ||
| Prostate | 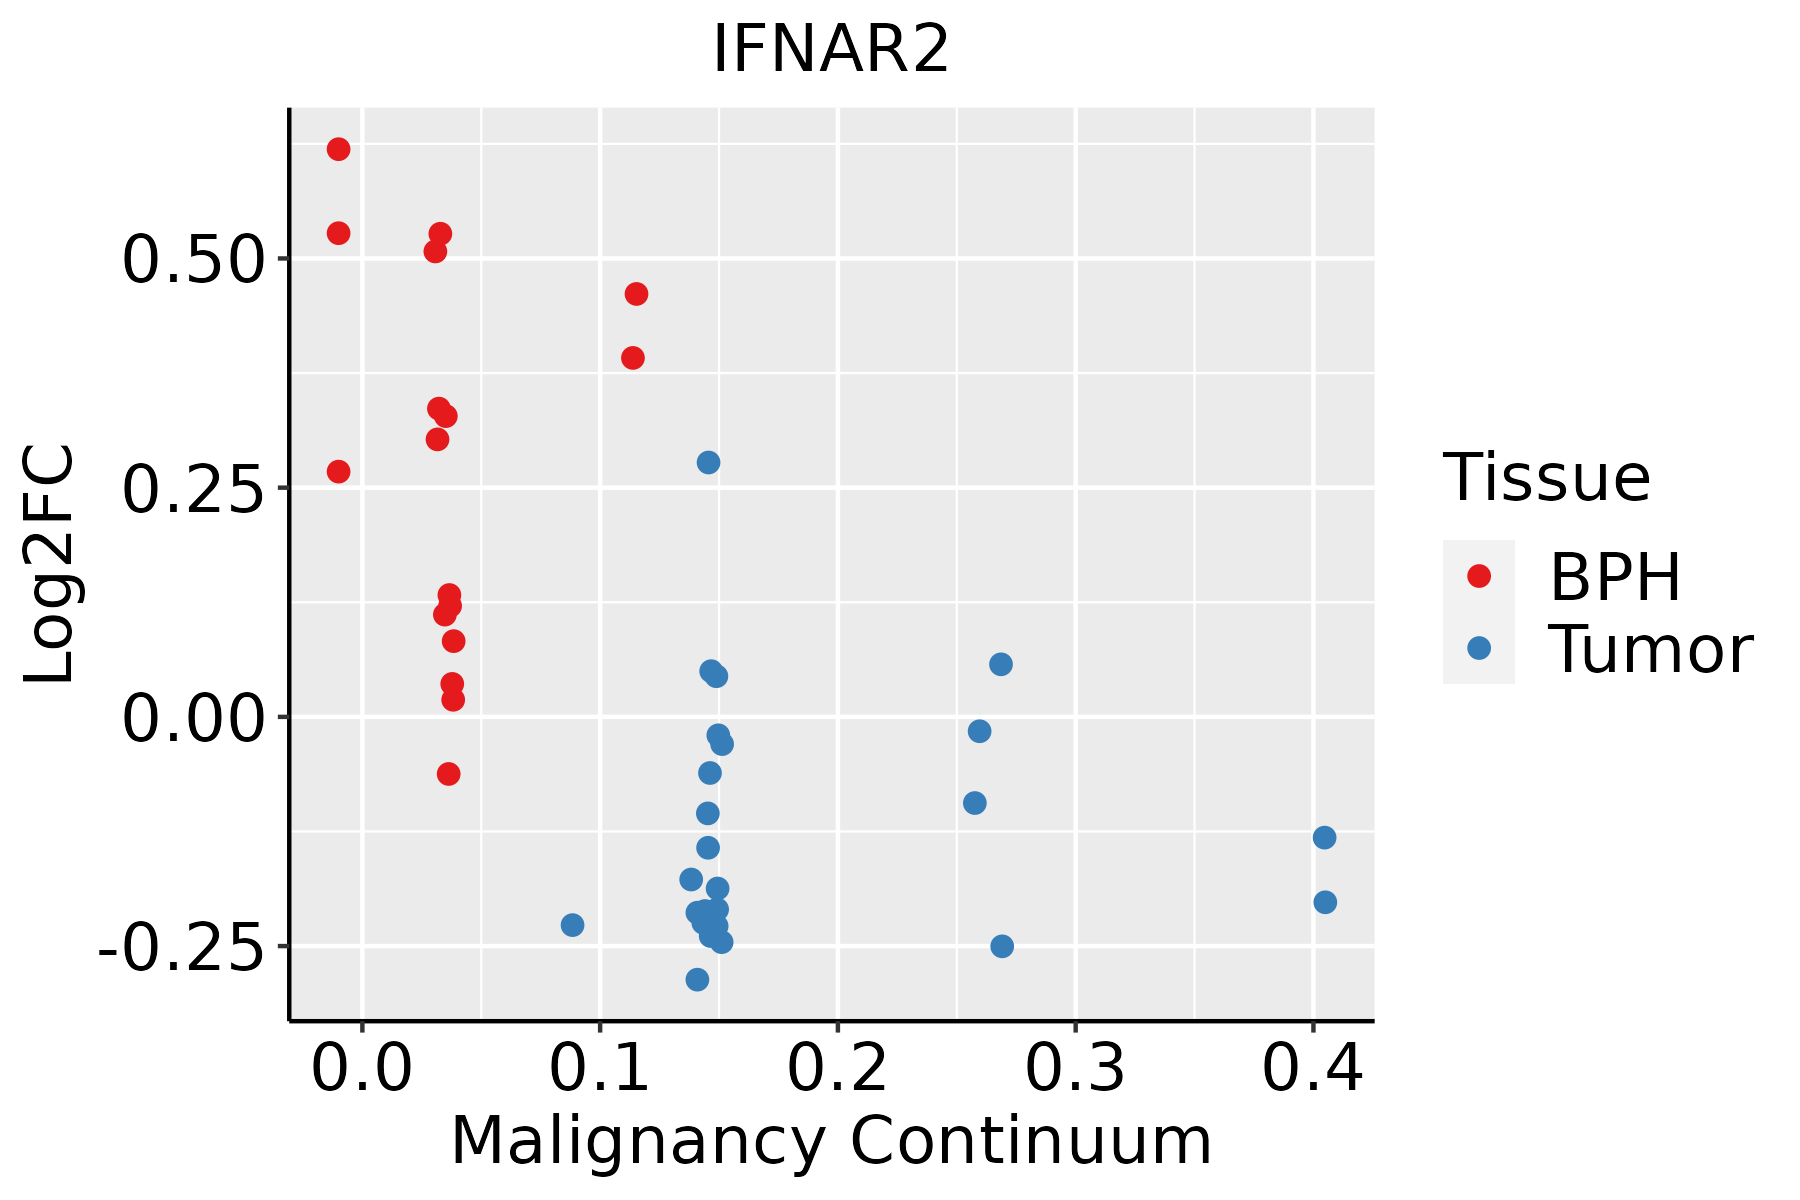 | BPH: Benign Prostatic Hyperplasia |
| ∗log2FC in expression of this searched gene in stem-like cells from each diseased tissue sample relative to stem-like cells in normal samples in each tissue plotted against the malignancy continuum. Samples are colored based on if they are from different disease stage. |
Top |
Malignant transformation related pathway analysis |
| Find out the enriched GO biological processes and KEGG pathways involved in transition from healthy to precancer to cancer |
| Tissue | Disease Stage | Enriched GO biological Processes |
| Colorectum | AD |  |
| Colorectum | SER |  |
| Colorectum | MSS |  |
| Colorectum | MSI-H |  |
| Colorectum | FAP |  |
| ∗Top 15 enriched GO BP terms are showed in the bar plot of each disease state in each tissue. Each row represents a significant GO biological process which is colored according to the -log10(p.adjust). |
| Page: 1 2 3 4 5 6 7 8 9 |
| GO ID | Tissue | Disease Stage | Description | Gene Ratio | Bg Ratio | pvalue | p.adjust | Count |
| GO:000961518 | Esophagus | ESCC | response to virus | 238/8552 | 367/18723 | 6.65e-14 | 3.32e-12 | 238 |
| GO:00516075 | Esophagus | ESCC | defense response to virus | 171/8552 | 265/18723 | 3.91e-10 | 1.05e-08 | 171 |
| GO:01405465 | Esophagus | ESCC | defense response to symbiont | 171/8552 | 265/18723 | 3.91e-10 | 1.05e-08 | 171 |
| GO:003434013 | Esophagus | ESCC | response to type I interferon | 48/8552 | 58/18723 | 6.18e-09 | 1.26e-07 | 48 |
| GO:00603375 | Esophagus | ESCC | type I interferon signaling pathway | 41/8552 | 50/18723 | 1.35e-07 | 2.17e-06 | 41 |
| GO:00713575 | Esophagus | ESCC | cellular response to type I interferon | 42/8552 | 52/18723 | 2.15e-07 | 3.30e-06 | 42 |
| GO:00354555 | Esophagus | ESCC | response to interferon-alpha | 17/8552 | 21/18723 | 1.03e-03 | 5.19e-03 | 17 |
| GO:00096155 | Liver | Cirrhotic | response to virus | 126/4634 | 367/18723 | 2.10e-05 | 2.77e-04 | 126 |
| GO:00343404 | Liver | Cirrhotic | response to type I interferon | 29/4634 | 58/18723 | 2.87e-05 | 3.64e-04 | 29 |
| GO:00713572 | Liver | Cirrhotic | cellular response to type I interferon | 24/4634 | 52/18723 | 6.32e-04 | 4.83e-03 | 24 |
| GO:00603372 | Liver | Cirrhotic | type I interferon signaling pathway | 23/4634 | 50/18723 | 8.62e-04 | 6.22e-03 | 23 |
| GO:0035456 | Liver | Cirrhotic | response to interferon-beta | 15/4634 | 32/18723 | 5.36e-03 | 2.73e-02 | 15 |
| GO:0035455 | Liver | Cirrhotic | response to interferon-alpha | 11/4634 | 21/18723 | 5.89e-03 | 2.95e-02 | 11 |
| GO:0051607 | Liver | Cirrhotic | defense response to virus | 84/4634 | 265/18723 | 6.02e-03 | 3.00e-02 | 84 |
| GO:0140546 | Liver | Cirrhotic | defense response to symbiont | 84/4634 | 265/18723 | 6.02e-03 | 3.00e-02 | 84 |
| GO:000961511 | Liver | HCC | response to virus | 210/7958 | 367/18723 | 7.32e-09 | 1.86e-07 | 210 |
| GO:003434011 | Liver | HCC | response to type I interferon | 43/7958 | 58/18723 | 9.93e-07 | 1.50e-05 | 43 |
| GO:00516071 | Liver | HCC | defense response to virus | 151/7958 | 265/18723 | 1.27e-06 | 1.85e-05 | 151 |
| GO:01405461 | Liver | HCC | defense response to symbiont | 151/7958 | 265/18723 | 1.27e-06 | 1.85e-05 | 151 |
| GO:006033711 | Liver | HCC | type I interferon signaling pathway | 37/7958 | 50/18723 | 6.13e-06 | 7.52e-05 | 37 |
| Page: 1 2 3 4 |
| Pathway ID | Tissue | Disease Stage | Description | Gene Ratio | Bg Ratio | pvalue | p.adjust | qvalue | Count |
| hsa05169210 | Esophagus | ESCC | Epstein-Barr virus infection | 151/4205 | 202/8465 | 1.55e-13 | 3.45e-12 | 1.77e-12 | 151 |
| hsa05167211 | Esophagus | ESCC | Kaposi sarcoma-associated herpesvirus infection | 136/4205 | 194/8465 | 4.28e-09 | 4.22e-08 | 2.16e-08 | 136 |
| hsa0516425 | Esophagus | ESCC | Influenza A | 122/4205 | 171/8465 | 5.01e-09 | 4.79e-08 | 2.45e-08 | 122 |
| hsa0516510 | Esophagus | ESCC | Human papillomavirus infection | 215/4205 | 331/8465 | 7.86e-09 | 7.12e-08 | 3.65e-08 | 215 |
| hsa05171211 | Esophagus | ESCC | Coronavirus disease - COVID-19 | 156/4205 | 232/8465 | 3.18e-08 | 2.68e-07 | 1.37e-07 | 156 |
| hsa051609 | Esophagus | ESCC | Hepatitis C | 107/4205 | 157/8465 | 1.75e-06 | 1.08e-05 | 5.55e-06 | 107 |
| hsa051629 | Esophagus | ESCC | Measles | 90/4205 | 139/8465 | 2.16e-04 | 7.87e-04 | 4.03e-04 | 90 |
| hsa0462122 | Esophagus | ESCC | NOD-like receptor signaling pathway | 116/4205 | 186/8465 | 2.90e-04 | 1.03e-03 | 5.30e-04 | 116 |
| hsa041517 | Esophagus | ESCC | PI3K-Akt signaling pathway | 197/4205 | 354/8465 | 1.24e-02 | 2.83e-02 | 1.45e-02 | 197 |
| hsa0516937 | Esophagus | ESCC | Epstein-Barr virus infection | 151/4205 | 202/8465 | 1.55e-13 | 3.45e-12 | 1.77e-12 | 151 |
| hsa0516738 | Esophagus | ESCC | Kaposi sarcoma-associated herpesvirus infection | 136/4205 | 194/8465 | 4.28e-09 | 4.22e-08 | 2.16e-08 | 136 |
| hsa0516435 | Esophagus | ESCC | Influenza A | 122/4205 | 171/8465 | 5.01e-09 | 4.79e-08 | 2.45e-08 | 122 |
| hsa0516515 | Esophagus | ESCC | Human papillomavirus infection | 215/4205 | 331/8465 | 7.86e-09 | 7.12e-08 | 3.65e-08 | 215 |
| hsa05171310 | Esophagus | ESCC | Coronavirus disease - COVID-19 | 156/4205 | 232/8465 | 3.18e-08 | 2.68e-07 | 1.37e-07 | 156 |
| hsa0516016 | Esophagus | ESCC | Hepatitis C | 107/4205 | 157/8465 | 1.75e-06 | 1.08e-05 | 5.55e-06 | 107 |
| hsa0516213 | Esophagus | ESCC | Measles | 90/4205 | 139/8465 | 2.16e-04 | 7.87e-04 | 4.03e-04 | 90 |
| hsa0462132 | Esophagus | ESCC | NOD-like receptor signaling pathway | 116/4205 | 186/8465 | 2.90e-04 | 1.03e-03 | 5.30e-04 | 116 |
| hsa0415114 | Esophagus | ESCC | PI3K-Akt signaling pathway | 197/4205 | 354/8465 | 1.24e-02 | 2.83e-02 | 1.45e-02 | 197 |
| hsa0517122 | Liver | Cirrhotic | Coronavirus disease - COVID-19 | 136/2530 | 232/8465 | 3.28e-20 | 1.82e-18 | 1.12e-18 | 136 |
| hsa05165 | Liver | Cirrhotic | Human papillomavirus infection | 124/2530 | 331/8465 | 1.55e-03 | 7.83e-03 | 4.83e-03 | 124 |
| Page: 1 2 3 4 5 6 7 8 9 10 |
Top |
Cell-cell communication analysis |
| Identification of potential cell-cell interactions between two cell types and their ligand-receptor pairs for different disease states |
| Ligand | Receptor | LRpair | Pathway | Tissue | Disease Stage |
| Page: 1 |
Top |
Single-cell gene regulatory network inference analysis |
| Find out the significant the regulons (TFs) and the target genes of each regulon across cell types for different disease states |
| TF | Cell Type | Tissue | Disease Stage | Target Gene | RSS | Regulon Activity |
| ∗The dot plots of a searched regulon are shown for all cell subpopulations in each disease state of each tissue based on the regulon specific score inferred using pySCENIC and by calculating the average expression. |
| Page: 1 |
Top |
Somatic mutation of malignant transformation related genes |
| Annotation of somatic variants for genes involved in malignant transformation |
| Hugo Symbol | Variant Class | Variant Classification | dbSNP RS | HGVSc | HGVSp | HGVSp Short | SWISSPROT | BIOTYPE | SIFT | PolyPhen | Tumor Sample Barcode | Tissue | Histology | Sex | Age | Stage | Therapy Types | Drugs | Outcome |
| IFNAR2 | SNV | Missense_Mutation | novel | c.756N>C | p.Leu252Phe | p.L252F | P48551 | protein_coding | tolerated(0.13) | benign(0.003) | TCGA-5L-AAT1-01 | Breast | breast invasive carcinoma | Female | <65 | III/IV | Hormone Therapy | letrozol | SD |
| IFNAR2 | SNV | Missense_Mutation | novel | c.1112N>A | p.Pro371His | p.P371H | P48551 | protein_coding | deleterious(0) | possibly_damaging(0.888) | TCGA-B6-A402-01 | Breast | breast invasive carcinoma | Female | <65 | I/II | Chemotherapy | cyclophosphamide | PD |
| IFNAR2 | SNV | Missense_Mutation | c.240N>T | p.Lys80Asn | p.K80N | P48551 | protein_coding | deleterious(0.03) | possibly_damaging(0.882) | TCGA-C5-A2LV-01 | Cervix | cervical & endocervical cancer | Female | <65 | I/II | Unknown | Unknown | SD | |
| IFNAR2 | SNV | Missense_Mutation | c.1225N>C | p.Glu409Gln | p.E409Q | P48551 | protein_coding | deleterious(0.04) | possibly_damaging(0.505) | TCGA-DR-A0ZM-01 | Cervix | cervical & endocervical cancer | Female | <65 | III/IV | Unspecific | Cisplatin | SD | |
| IFNAR2 | SNV | Missense_Mutation | novel | c.1173N>C | p.Leu391Phe | p.L391F | P48551 | protein_coding | tolerated(0.12) | benign(0.107) | TCGA-EA-A3HU-01 | Cervix | cervical & endocervical cancer | Female | <65 | I/II | Unknown | Unknown | SD |
| IFNAR2 | SNV | Missense_Mutation | novel | c.1296N>C | p.Leu432Phe | p.L432F | P48551 | protein_coding | deleterious(0.04) | benign(0.326) | TCGA-EA-A3HU-01 | Cervix | cervical & endocervical cancer | Female | <65 | I/II | Unknown | Unknown | SD |
| IFNAR2 | SNV | Missense_Mutation | c.1363N>C | p.Glu455Gln | p.E455Q | P48551 | protein_coding | deleterious(0.04) | possibly_damaging(0.656) | TCGA-VS-A953-01 | Cervix | cervical & endocervical cancer | Female | <65 | I/II | Unknown | Unknown | PD | |
| IFNAR2 | SNV | Missense_Mutation | novel | c.1163N>G | p.Leu388Trp | p.L388W | P48551 | protein_coding | deleterious(0.04) | possibly_damaging(0.744) | TCGA-VS-A9UB-01 | Cervix | cervical & endocervical cancer | Female | <65 | I/II | Chemotherapy | cisplatin | CR |
| IFNAR2 | SNV | Missense_Mutation | novel | c.799N>G | p.Ile267Val | p.I267V | P48551 | protein_coding | tolerated(0.5) | benign(0.003) | TCGA-A6-2672-01 | Colorectum | colon adenocarcinoma | Female | >=65 | III/IV | Unknown | Unknown | SD |
| IFNAR2 | SNV | Missense_Mutation | c.917N>C | p.Tyr306Ser | p.Y306S | P48551 | protein_coding | tolerated(0.44) | benign(0.003) | TCGA-AA-3510-01 | Colorectum | colon adenocarcinoma | Male | >=65 | I/II | Unknown | Unknown | SD |
| Page: 1 2 3 4 5 6 |
Top |
Related drugs of malignant transformation related genes |
| Identification of chemicals and drugs interact with genes involved in malignant transfromation |
| (DGIdb 4.0) |
| Entrez ID | Symbol | Category | Interaction Types | Drug Claim Name | Drug Name | PMIDs |
| 3455 | IFNAR2 | DRUGGABLE GENOME, CLINICALLY ACTIONABLE, KINASE | agonist | CHEMBL1201560 | PEGINTERFERON ALFA-2A | |
| 3455 | IFNAR2 | DRUGGABLE GENOME, CLINICALLY ACTIONABLE, KINASE | INTERFERON BETA-1B | |||
| 3455 | IFNAR2 | DRUGGABLE GENOME, CLINICALLY ACTIONABLE, KINASE | INTERFERON ALFACON-1 | |||
| 3455 | IFNAR2 | DRUGGABLE GENOME, CLINICALLY ACTIONABLE, KINASE | Interferon Alfa-2b, Recombinant | |||
| 3455 | IFNAR2 | DRUGGABLE GENOME, CLINICALLY ACTIONABLE, KINASE | agonist | CHEMBL1201558 | INTERFERON ALFA-2B | |
| 3455 | IFNAR2 | DRUGGABLE GENOME, CLINICALLY ACTIONABLE, KINASE | Interferon alfa-n1 | |||
| 3455 | IFNAR2 | DRUGGABLE GENOME, CLINICALLY ACTIONABLE, KINASE | agonist | CHEMBL1201557 | INTERFERON ALFACON-1 | |
| 3455 | IFNAR2 | DRUGGABLE GENOME, CLINICALLY ACTIONABLE, KINASE | agonist | CHEMBL2108677 | PEGINTERFERON BETA-1A | |
| 3455 | IFNAR2 | DRUGGABLE GENOME, CLINICALLY ACTIONABLE, KINASE | agonist | CHEMBL1201563 | INTERFERON BETA-1B | |
| 3455 | IFNAR2 | DRUGGABLE GENOME, CLINICALLY ACTIONABLE, KINASE | Anifrolumab | ANIFROLUMAB |
| Page: 1 2 3 |

Copyright 2023-Present -The University of Texas Health Science Center at Houston |