
|
|||||
|
 | |
| |
| |
| |
| |
| |
|
Gene: IFNAR1 |
Gene summary for IFNAR1 |
| Gene information | Species | Human | Gene symbol | IFNAR1 | Gene ID | 3454 |
| Gene name | interferon alpha and beta receptor subunit 1 | |
| Gene Alias | AVP | |
| Cytomap | 21q22.11 | |
| Gene Type | protein-coding | GO ID | GO:0002237 | UniProtAcc | P17181 |
Top |
Malignant transformation analysis |
| Identification of the aberrant gene expression in precancerous and cancerous lesions by comparing the gene expression of stem-like cells in diseased tissues with normal stem cells |
| Entrez ID | Symbol | Replicates | Species | Organ | Tissue | Adj P-value | Log2FC | Malignancy |
| 3454 | IFNAR1 | LZE4T | Human | Esophagus | ESCC | 2.97e-07 | 1.15e-01 | 0.0811 |
| 3454 | IFNAR1 | LZE8T | Human | Esophagus | ESCC | 1.68e-08 | 1.29e-01 | 0.067 |
| 3454 | IFNAR1 | LZE20T | Human | Esophagus | ESCC | 3.14e-04 | 1.46e-01 | 0.0662 |
| 3454 | IFNAR1 | LZE22T | Human | Esophagus | ESCC | 4.81e-02 | 7.63e-02 | 0.068 |
| 3454 | IFNAR1 | LZE24T | Human | Esophagus | ESCC | 2.35e-29 | 7.93e-01 | 0.0596 |
| 3454 | IFNAR1 | P1T-E | Human | Esophagus | ESCC | 2.78e-05 | 4.53e-01 | 0.0875 |
| 3454 | IFNAR1 | P2T-E | Human | Esophagus | ESCC | 1.50e-20 | 3.65e-01 | 0.1177 |
| 3454 | IFNAR1 | P4T-E | Human | Esophagus | ESCC | 6.76e-29 | 5.40e-01 | 0.1323 |
| 3454 | IFNAR1 | P5T-E | Human | Esophagus | ESCC | 4.29e-08 | 2.19e-01 | 0.1327 |
| 3454 | IFNAR1 | P8T-E | Human | Esophagus | ESCC | 1.16e-24 | 5.12e-01 | 0.0889 |
| 3454 | IFNAR1 | P9T-E | Human | Esophagus | ESCC | 1.25e-03 | 1.32e-01 | 0.1131 |
| 3454 | IFNAR1 | P10T-E | Human | Esophagus | ESCC | 2.11e-18 | 3.75e-01 | 0.116 |
| 3454 | IFNAR1 | P11T-E | Human | Esophagus | ESCC | 1.91e-07 | 4.39e-01 | 0.1426 |
| 3454 | IFNAR1 | P12T-E | Human | Esophagus | ESCC | 2.02e-30 | 5.25e-01 | 0.1122 |
| 3454 | IFNAR1 | P15T-E | Human | Esophagus | ESCC | 3.26e-13 | 2.45e-01 | 0.1149 |
| 3454 | IFNAR1 | P16T-E | Human | Esophagus | ESCC | 6.81e-22 | 3.07e-01 | 0.1153 |
| 3454 | IFNAR1 | P19T-E | Human | Esophagus | ESCC | 1.69e-08 | 5.99e-01 | 0.1662 |
| 3454 | IFNAR1 | P20T-E | Human | Esophagus | ESCC | 1.44e-10 | 1.95e-01 | 0.1124 |
| 3454 | IFNAR1 | P21T-E | Human | Esophagus | ESCC | 2.62e-33 | 6.36e-01 | 0.1617 |
| 3454 | IFNAR1 | P22T-E | Human | Esophagus | ESCC | 5.20e-09 | 1.67e-01 | 0.1236 |
| Page: 1 2 3 4 5 6 7 |
| Tissue | Expression Dynamics | Abbreviation |
| Esophagus | 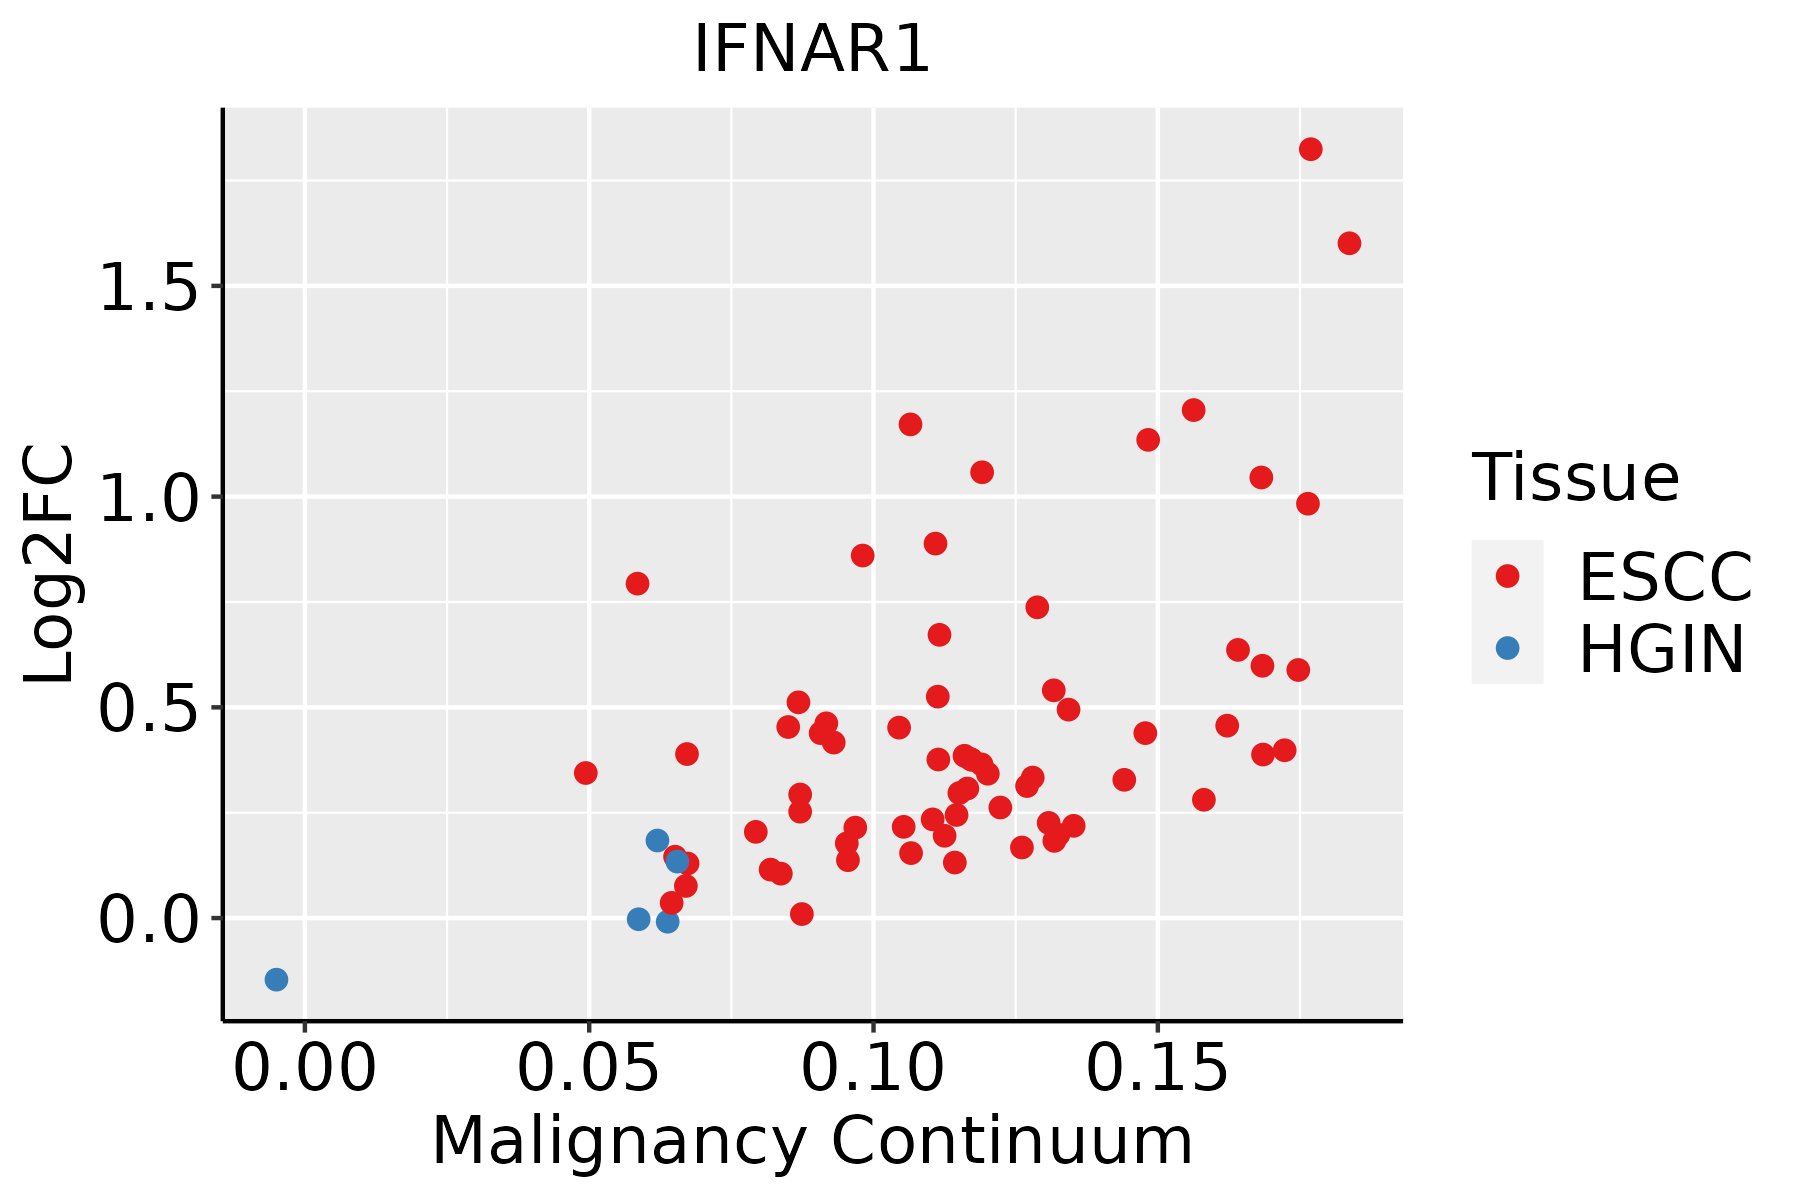 | ESCC: Esophageal squamous cell carcinoma |
| HGIN: High-grade intraepithelial neoplasias | ||
| LGIN: Low-grade intraepithelial neoplasias | ||
| Liver |  | HCC: Hepatocellular carcinoma |
| NAFLD: Non-alcoholic fatty liver disease | ||
| Oral Cavity | 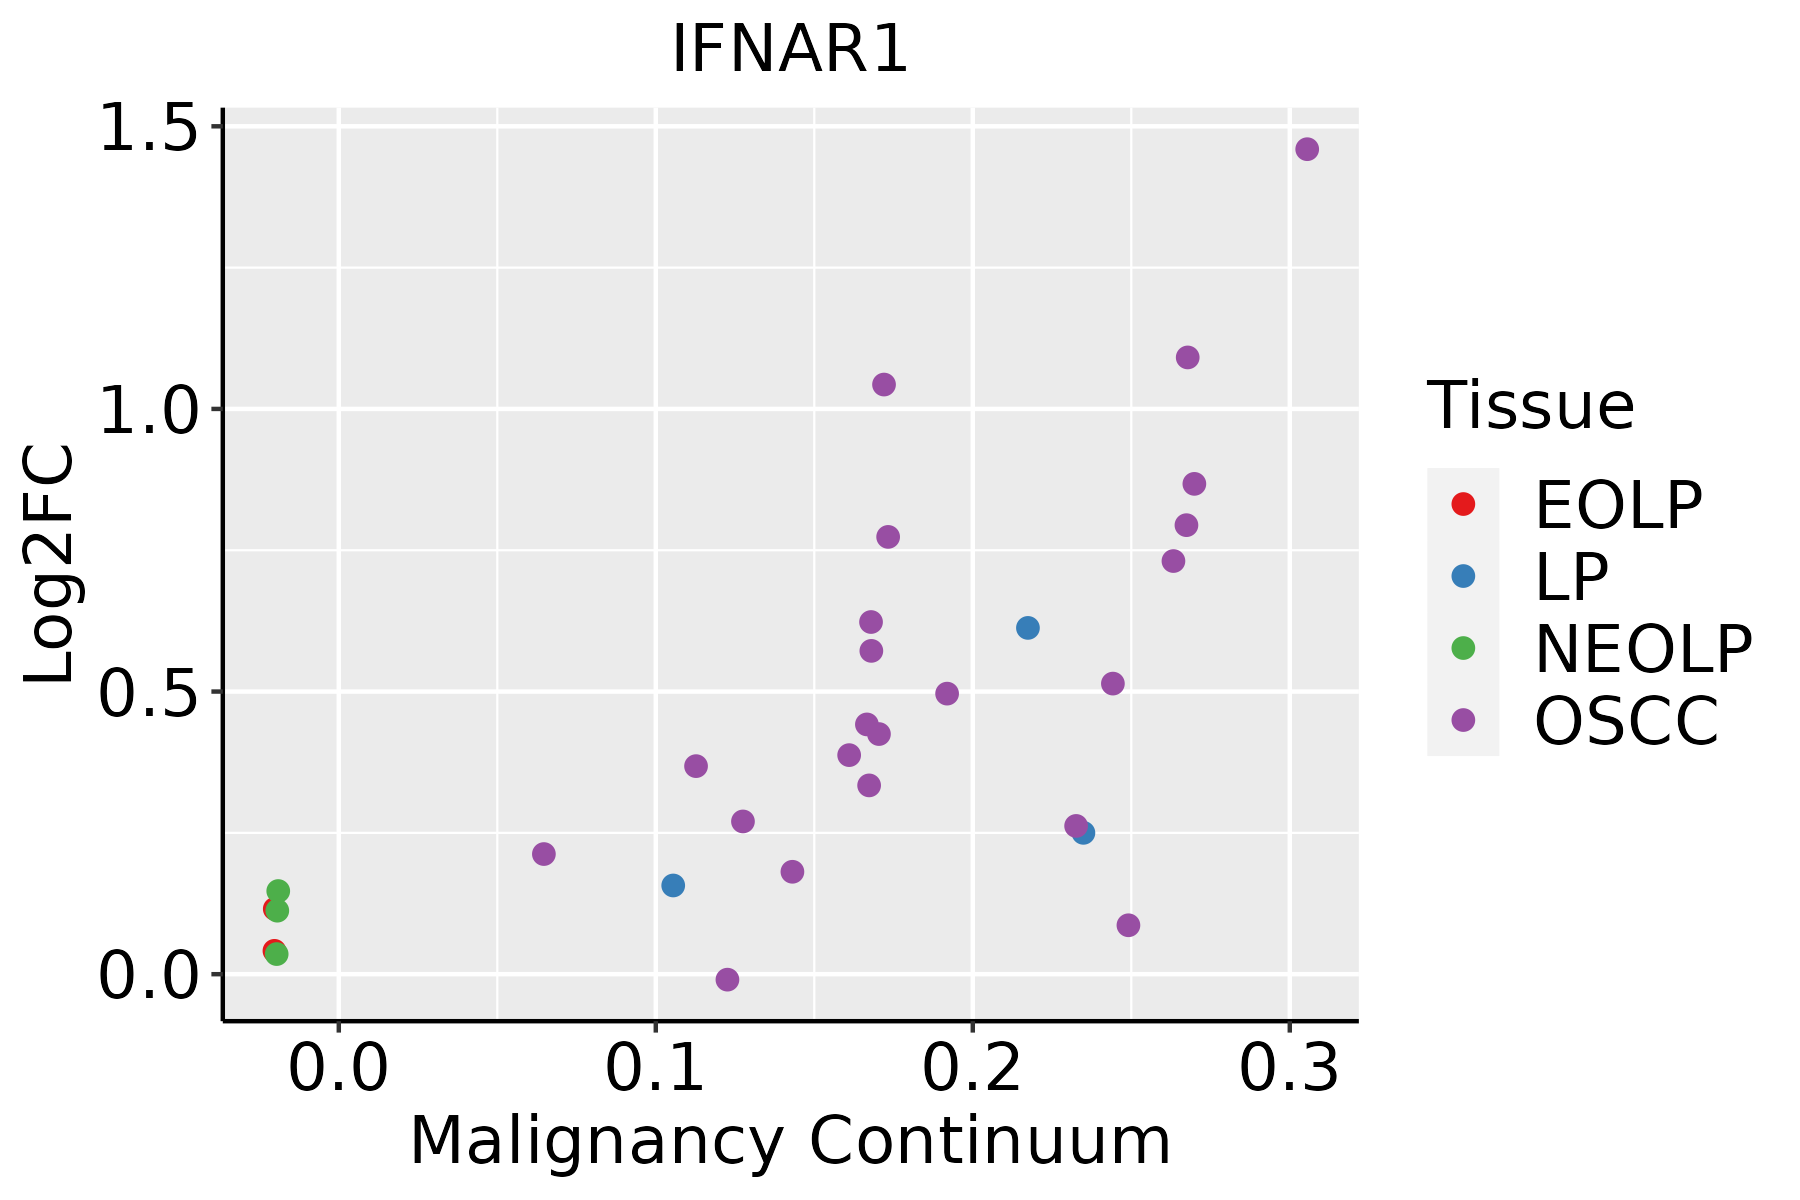 | EOLP: Erosive Oral lichen planus |
| LP: leukoplakia | ||
| NEOLP: Non-erosive oral lichen planus | ||
| OSCC: Oral squamous cell carcinoma | ||
| Prostate | 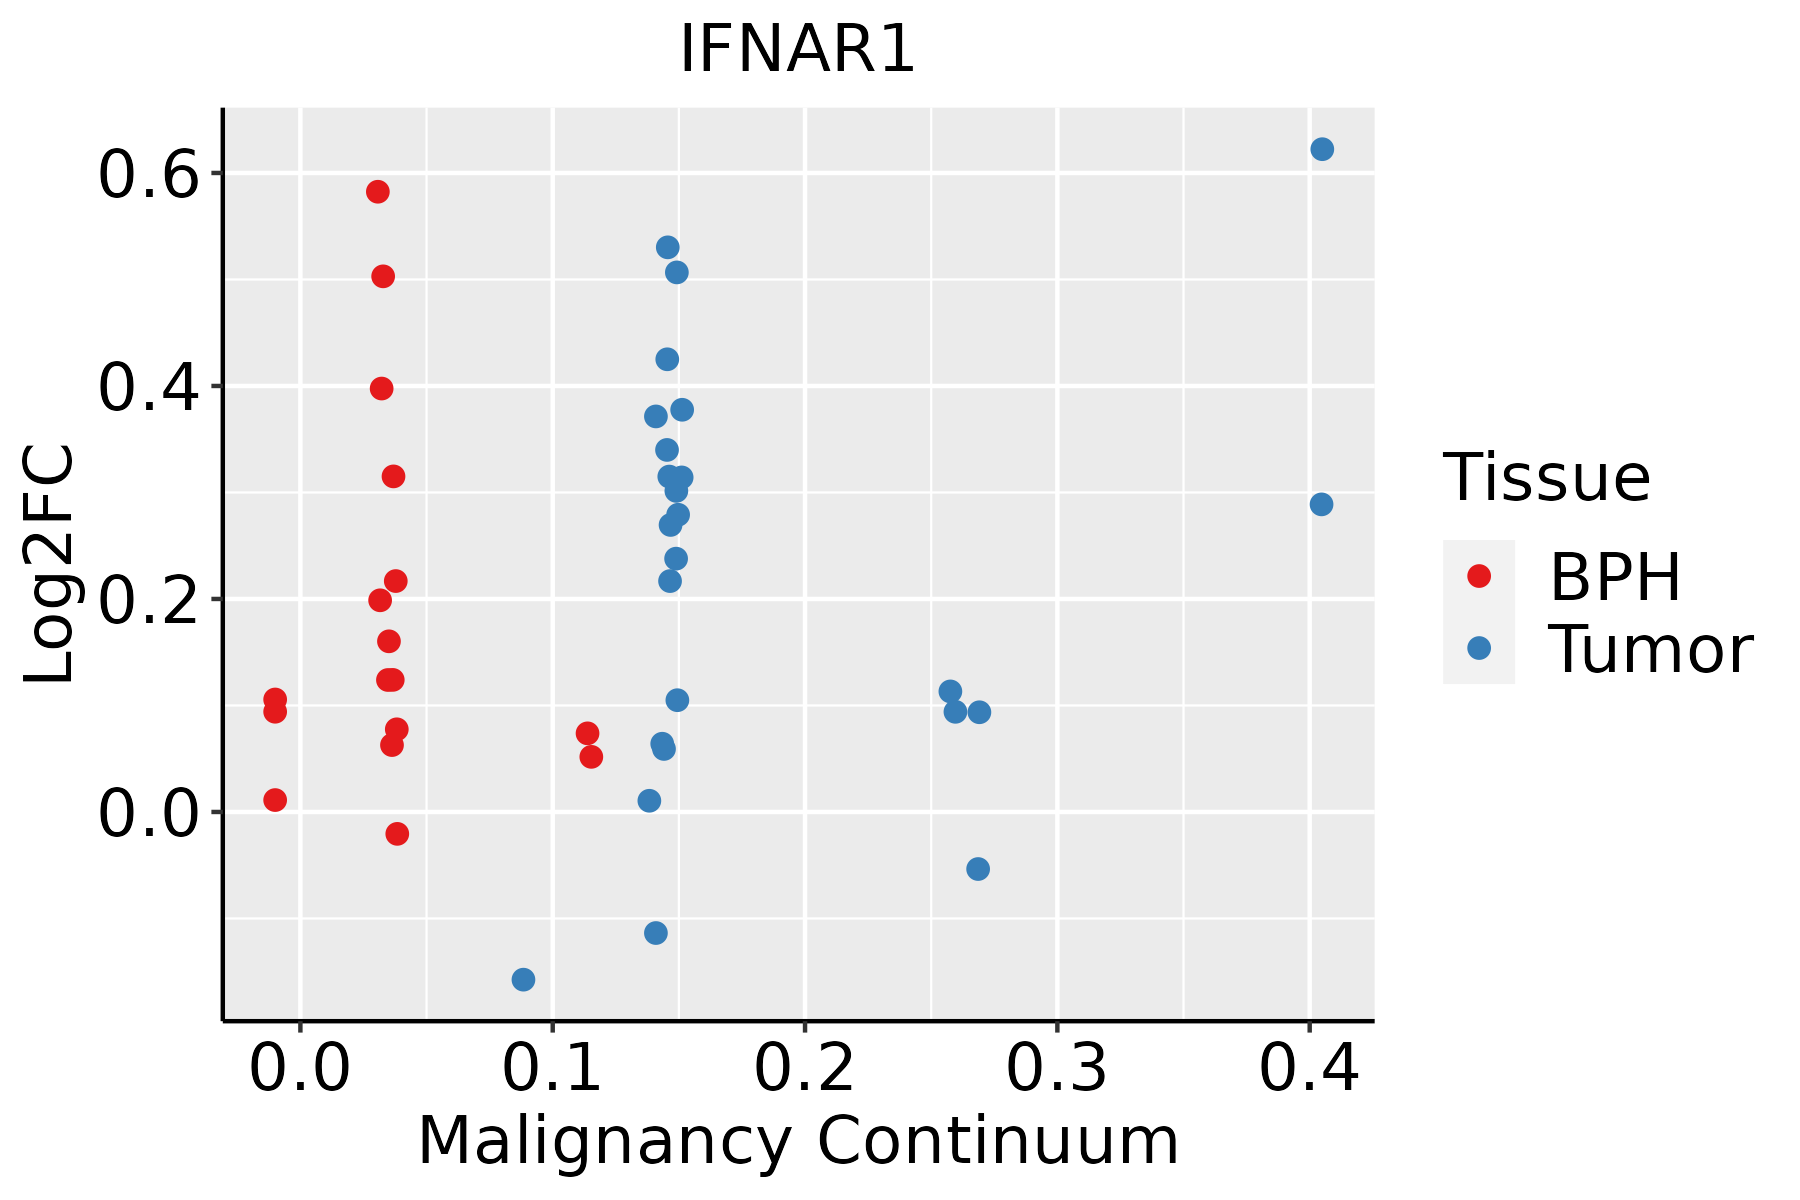 | BPH: Benign Prostatic Hyperplasia |
| Skin | 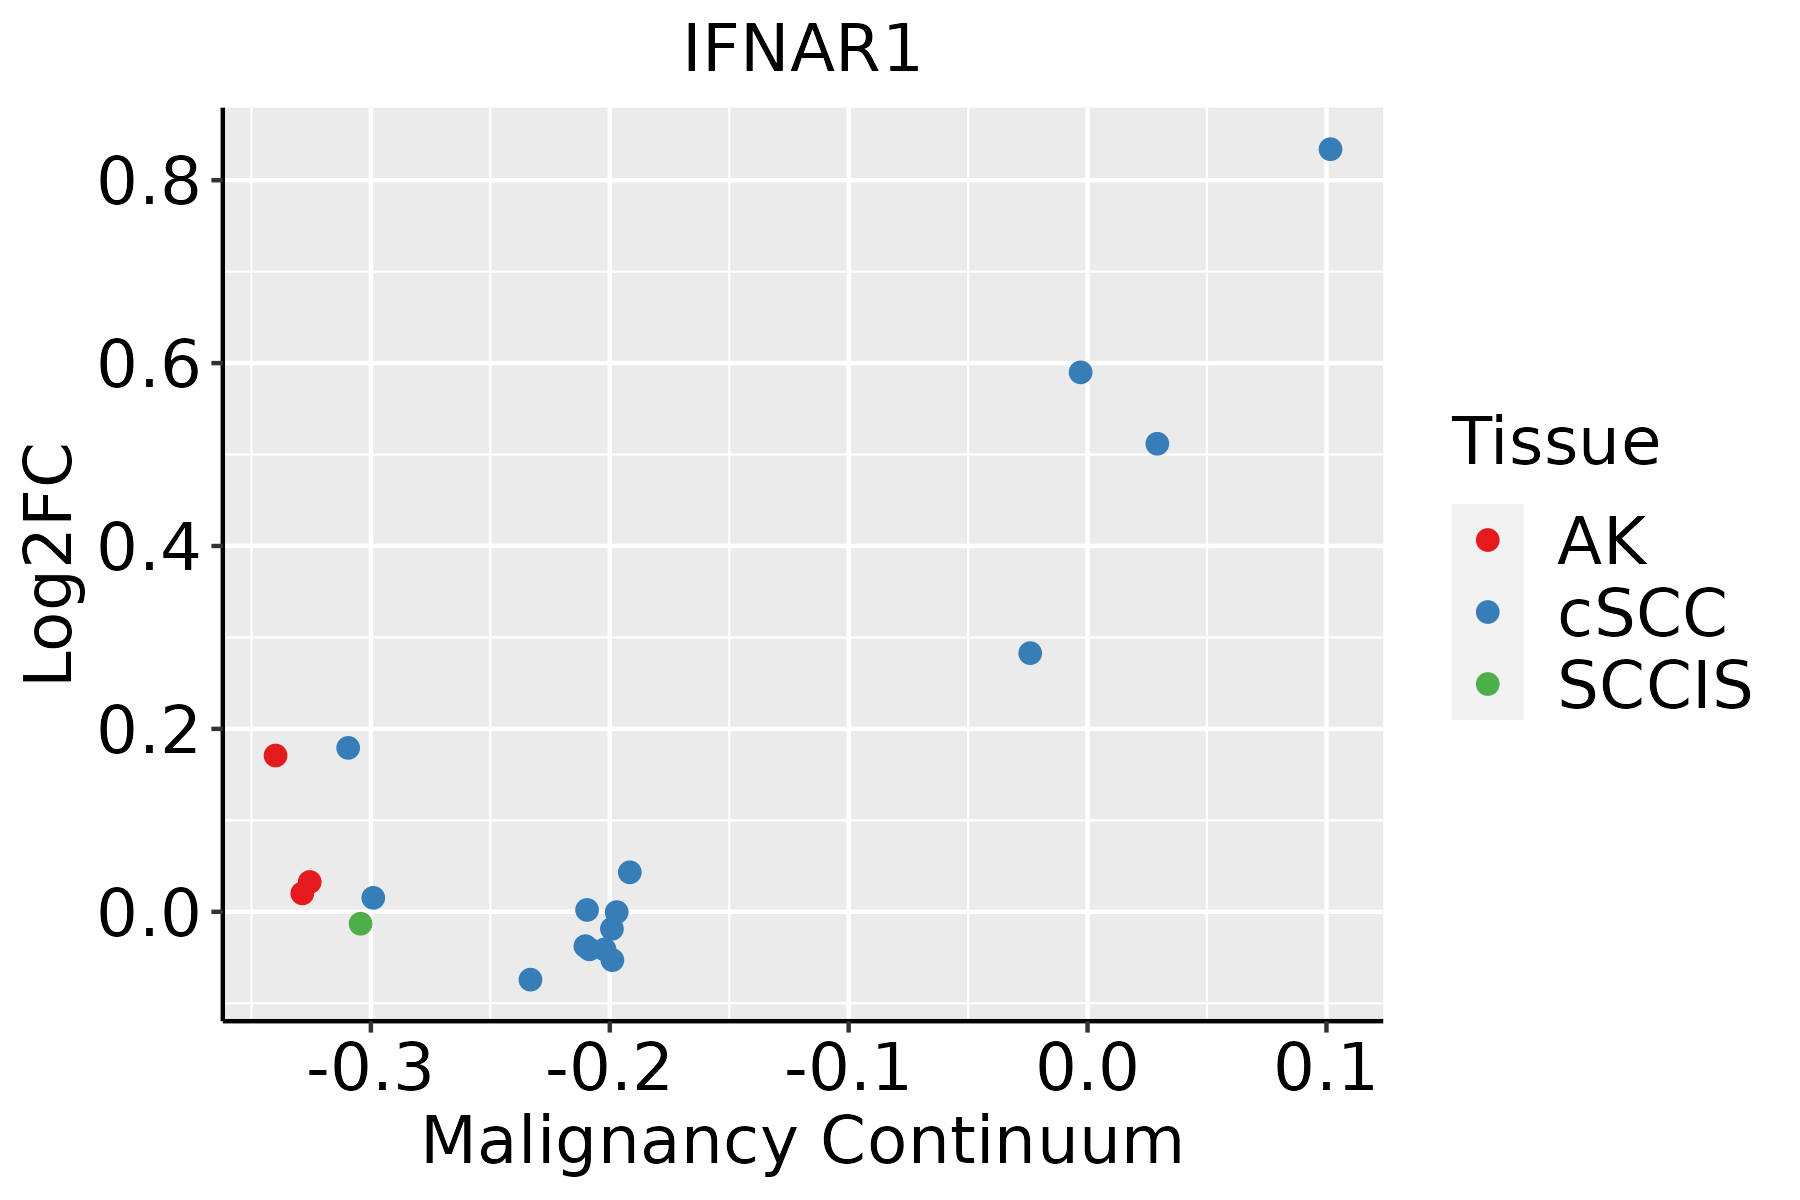 | AK: Actinic keratosis |
| cSCC: Cutaneous squamous cell carcinoma | ||
| SCCIS:squamous cell carcinoma in situ | ||
| Thyroid | 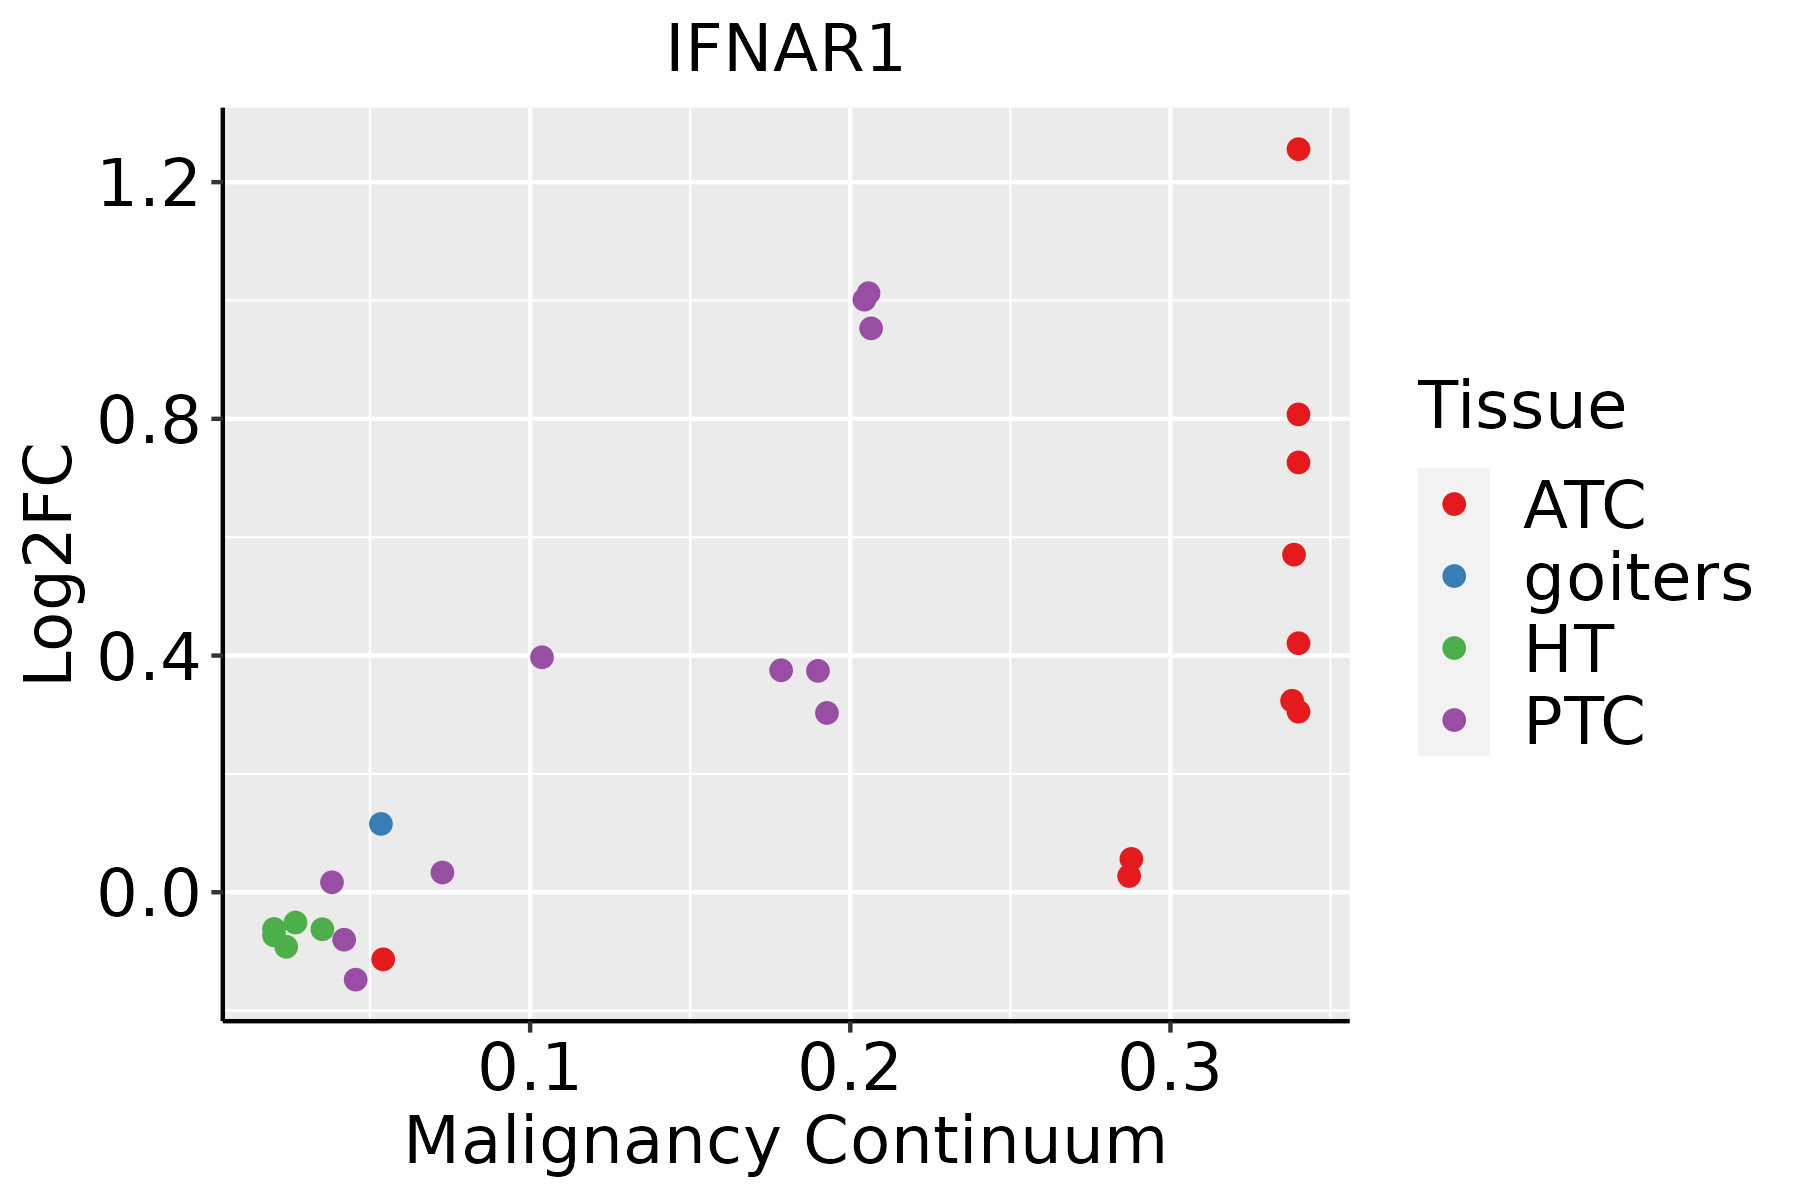 | ATC: Anaplastic thyroid cancer |
| HT: Hashimoto's thyroiditis | ||
| PTC: Papillary thyroid cancer |
| ∗log2FC in expression of this searched gene in stem-like cells from each diseased tissue sample relative to stem-like cells in normal samples in each tissue plotted against the malignancy continuum. Samples are colored based on if they are from different disease stage. |
Top |
Malignant transformation related pathway analysis |
| Find out the enriched GO biological processes and KEGG pathways involved in transition from healthy to precancer to cancer |
| Tissue | Disease Stage | Enriched GO biological Processes |
| Colorectum | AD |  |
| Colorectum | SER |  |
| Colorectum | MSS |  |
| Colorectum | MSI-H |  |
| Colorectum | FAP |  |
| ∗Top 15 enriched GO BP terms are showed in the bar plot of each disease state in each tissue. Each row represents a significant GO biological process which is colored according to the -log10(p.adjust). |
| Page: 1 2 3 4 5 6 7 8 9 |
| GO ID | Tissue | Disease Stage | Description | Gene Ratio | Bg Ratio | pvalue | p.adjust | Count |
| GO:0006091110 | Esophagus | ESCC | generation of precursor metabolites and energy | 331/8552 | 490/18723 | 3.86e-23 | 8.45e-21 | 331 |
| GO:0045333110 | Esophagus | ESCC | cellular respiration | 173/8552 | 230/18723 | 4.53e-20 | 5.99e-18 | 173 |
| GO:0015980110 | Esophagus | ESCC | energy derivation by oxidation of organic compounds | 220/8552 | 318/18723 | 1.20e-17 | 1.09e-15 | 220 |
| GO:000961518 | Esophagus | ESCC | response to virus | 238/8552 | 367/18723 | 6.65e-14 | 3.32e-12 | 238 |
| GO:003434013 | Esophagus | ESCC | response to type I interferon | 48/8552 | 58/18723 | 6.18e-09 | 1.26e-07 | 48 |
| GO:00603375 | Esophagus | ESCC | type I interferon signaling pathway | 41/8552 | 50/18723 | 1.35e-07 | 2.17e-06 | 41 |
| GO:00713575 | Esophagus | ESCC | cellular response to type I interferon | 42/8552 | 52/18723 | 2.15e-07 | 3.30e-06 | 42 |
| GO:004346719 | Esophagus | ESCC | regulation of generation of precursor metabolites and energy | 81/8552 | 130/18723 | 9.58e-05 | 6.81e-04 | 81 |
| GO:003249619 | Esophagus | ESCC | response to lipopolysaccharide | 191/8552 | 343/18723 | 1.11e-04 | 7.73e-04 | 191 |
| GO:00354555 | Esophagus | ESCC | response to interferon-alpha | 17/8552 | 21/18723 | 1.03e-03 | 5.19e-03 | 17 |
| GO:000223719 | Esophagus | ESCC | response to molecule of bacterial origin | 194/8552 | 363/18723 | 1.64e-03 | 7.61e-03 | 194 |
| GO:000609112 | Liver | Cirrhotic | generation of precursor metabolites and energy | 238/4634 | 490/18723 | 6.85e-31 | 1.07e-27 | 238 |
| GO:00453337 | Liver | Cirrhotic | cellular respiration | 122/4634 | 230/18723 | 2.15e-20 | 6.43e-18 | 122 |
| GO:001598012 | Liver | Cirrhotic | energy derivation by oxidation of organic compounds | 154/4634 | 318/18723 | 3.11e-20 | 8.87e-18 | 154 |
| GO:004346712 | Liver | Cirrhotic | regulation of generation of precursor metabolites and energy | 58/4634 | 130/18723 | 5.81e-07 | 1.28e-05 | 58 |
| GO:00096155 | Liver | Cirrhotic | response to virus | 126/4634 | 367/18723 | 2.10e-05 | 2.77e-04 | 126 |
| GO:00343404 | Liver | Cirrhotic | response to type I interferon | 29/4634 | 58/18723 | 2.87e-05 | 3.64e-04 | 29 |
| GO:00434574 | Liver | Cirrhotic | regulation of cellular respiration | 23/4634 | 49/18723 | 6.06e-04 | 4.67e-03 | 23 |
| GO:00713572 | Liver | Cirrhotic | cellular response to type I interferon | 24/4634 | 52/18723 | 6.32e-04 | 4.83e-03 | 24 |
| GO:00324966 | Liver | Cirrhotic | response to lipopolysaccharide | 111/4634 | 343/18723 | 8.15e-04 | 5.95e-03 | 111 |
| Page: 1 2 3 4 5 6 7 |
| Pathway ID | Tissue | Disease Stage | Description | Gene Ratio | Bg Ratio | pvalue | p.adjust | qvalue | Count |
| hsa05169210 | Esophagus | ESCC | Epstein-Barr virus infection | 151/4205 | 202/8465 | 1.55e-13 | 3.45e-12 | 1.77e-12 | 151 |
| hsa05167211 | Esophagus | ESCC | Kaposi sarcoma-associated herpesvirus infection | 136/4205 | 194/8465 | 4.28e-09 | 4.22e-08 | 2.16e-08 | 136 |
| hsa0516425 | Esophagus | ESCC | Influenza A | 122/4205 | 171/8465 | 5.01e-09 | 4.79e-08 | 2.45e-08 | 122 |
| hsa0516510 | Esophagus | ESCC | Human papillomavirus infection | 215/4205 | 331/8465 | 7.86e-09 | 7.12e-08 | 3.65e-08 | 215 |
| hsa05171211 | Esophagus | ESCC | Coronavirus disease - COVID-19 | 156/4205 | 232/8465 | 3.18e-08 | 2.68e-07 | 1.37e-07 | 156 |
| hsa051609 | Esophagus | ESCC | Hepatitis C | 107/4205 | 157/8465 | 1.75e-06 | 1.08e-05 | 5.55e-06 | 107 |
| hsa051619 | Esophagus | ESCC | Hepatitis B | 108/4205 | 162/8465 | 7.68e-06 | 4.15e-05 | 2.12e-05 | 108 |
| hsa051629 | Esophagus | ESCC | Measles | 90/4205 | 139/8465 | 2.16e-04 | 7.87e-04 | 4.03e-04 | 90 |
| hsa0462122 | Esophagus | ESCC | NOD-like receptor signaling pathway | 116/4205 | 186/8465 | 2.90e-04 | 1.03e-03 | 5.30e-04 | 116 |
| hsa041517 | Esophagus | ESCC | PI3K-Akt signaling pathway | 197/4205 | 354/8465 | 1.24e-02 | 2.83e-02 | 1.45e-02 | 197 |
| hsa0516937 | Esophagus | ESCC | Epstein-Barr virus infection | 151/4205 | 202/8465 | 1.55e-13 | 3.45e-12 | 1.77e-12 | 151 |
| hsa0516738 | Esophagus | ESCC | Kaposi sarcoma-associated herpesvirus infection | 136/4205 | 194/8465 | 4.28e-09 | 4.22e-08 | 2.16e-08 | 136 |
| hsa0516435 | Esophagus | ESCC | Influenza A | 122/4205 | 171/8465 | 5.01e-09 | 4.79e-08 | 2.45e-08 | 122 |
| hsa0516515 | Esophagus | ESCC | Human papillomavirus infection | 215/4205 | 331/8465 | 7.86e-09 | 7.12e-08 | 3.65e-08 | 215 |
| hsa05171310 | Esophagus | ESCC | Coronavirus disease - COVID-19 | 156/4205 | 232/8465 | 3.18e-08 | 2.68e-07 | 1.37e-07 | 156 |
| hsa0516016 | Esophagus | ESCC | Hepatitis C | 107/4205 | 157/8465 | 1.75e-06 | 1.08e-05 | 5.55e-06 | 107 |
| hsa0516114 | Esophagus | ESCC | Hepatitis B | 108/4205 | 162/8465 | 7.68e-06 | 4.15e-05 | 2.12e-05 | 108 |
| hsa0516213 | Esophagus | ESCC | Measles | 90/4205 | 139/8465 | 2.16e-04 | 7.87e-04 | 4.03e-04 | 90 |
| hsa0462132 | Esophagus | ESCC | NOD-like receptor signaling pathway | 116/4205 | 186/8465 | 2.90e-04 | 1.03e-03 | 5.30e-04 | 116 |
| hsa0415114 | Esophagus | ESCC | PI3K-Akt signaling pathway | 197/4205 | 354/8465 | 1.24e-02 | 2.83e-02 | 1.45e-02 | 197 |
| Page: 1 2 3 4 5 6 7 8 9 |
Top |
Cell-cell communication analysis |
| Identification of potential cell-cell interactions between two cell types and their ligand-receptor pairs for different disease states |
| Ligand | Receptor | LRpair | Pathway | Tissue | Disease Stage |
| Page: 1 |
Top |
Single-cell gene regulatory network inference analysis |
| Find out the significant the regulons (TFs) and the target genes of each regulon across cell types for different disease states |
| TF | Cell Type | Tissue | Disease Stage | Target Gene | RSS | Regulon Activity |
| ∗The dot plots of a searched regulon are shown for all cell subpopulations in each disease state of each tissue based on the regulon specific score inferred using pySCENIC and by calculating the average expression. |
| Page: 1 |
Top |
Somatic mutation of malignant transformation related genes |
| Annotation of somatic variants for genes involved in malignant transformation |
| Hugo Symbol | Variant Class | Variant Classification | dbSNP RS | HGVSc | HGVSp | HGVSp Short | SWISSPROT | BIOTYPE | SIFT | PolyPhen | Tumor Sample Barcode | Tissue | Histology | Sex | Age | Stage | Therapy Types | Drugs | Outcome |
| IFNAR1 | SNV | Missense_Mutation | novel | c.859N>G | p.Lys287Glu | p.K287E | P17181 | protein_coding | tolerated(0.15) | benign(0.015) | TCGA-AN-A0AK-01 | Breast | breast invasive carcinoma | Female | >=65 | I/II | Unknown | Unknown | SD |
| IFNAR1 | SNV | Missense_Mutation | novel | c.1337N>T | p.Ala446Val | p.A446V | P17181 | protein_coding | tolerated(0.52) | benign(0) | TCGA-AN-A0AK-01 | Breast | breast invasive carcinoma | Female | >=65 | I/II | Unknown | Unknown | SD |
| IFNAR1 | SNV | Missense_Mutation | c.410N>T | p.Ala137Val | p.A137V | P17181 | protein_coding | deleterious(0) | probably_damaging(0.983) | TCGA-B6-A0I2-01 | Breast | breast invasive carcinoma | Female | <65 | I/II | Unknown | Unknown | SD | |
| IFNAR1 | insertion | Frame_Shift_Ins | novel | c.628_629insCTCAACCTCCCAAAGTGCTGGGATTACA | p.Trp210SerfsTer16 | p.W210Sfs*16 | P17181 | protein_coding | TCGA-A8-A07J-01 | Breast | breast invasive carcinoma | Female | <65 | I/II | Chemotherapy | 5-fluorouracil | CR | ||
| IFNAR1 | SNV | Missense_Mutation | c.973N>C | p.Asp325His | p.D325H | P17181 | protein_coding | deleterious(0.01) | probably_damaging(0.945) | TCGA-BI-A0VR-01 | Cervix | cervical & endocervical cancer | Female | <65 | III/IV | Unknown | Unknown | SD | |
| IFNAR1 | SNV | Missense_Mutation | c.1624N>A | p.Asp542Asn | p.D542N | P17181 | protein_coding | deleterious(0.01) | probably_damaging(0.922) | TCGA-C5-A1ML-01 | Cervix | cervical & endocervical cancer | Female | <65 | I/II | Unknown | Unknown | PD | |
| IFNAR1 | SNV | Missense_Mutation | c.521C>T | p.Ser174Leu | p.S174L | P17181 | protein_coding | deleterious(0) | probably_damaging(0.941) | TCGA-MY-A5BE-01 | Cervix | cervical & endocervical cancer | Female | <65 | I/II | Unknown | Unknown | SD | |
| IFNAR1 | SNV | Missense_Mutation | c.458G>A | p.Ser153Asn | p.S153N | P17181 | protein_coding | tolerated(0.24) | benign(0.42) | TCGA-A6-A565-01 | Colorectum | colon adenocarcinoma | Female | <65 | III/IV | Unspecific | 5FU | PD | |
| IFNAR1 | SNV | Missense_Mutation | novel | c.1114N>G | p.Ile372Val | p.I372V | P17181 | protein_coding | tolerated(0.46) | benign(0.011) | TCGA-AA-3855-01 | Colorectum | colon adenocarcinoma | Male | >=65 | I/II | Unknown | Unknown | SD |
| IFNAR1 | SNV | Missense_Mutation | c.1586N>T | p.Ser529Phe | p.S529F | P17181 | protein_coding | deleterious(0.03) | probably_damaging(0.968) | TCGA-AA-A010-01 | Colorectum | colon adenocarcinoma | Female | <65 | I/II | Chemotherapy | folinic | CR |
| Page: 1 2 3 4 5 6 |
Top |
Related drugs of malignant transformation related genes |
| Identification of chemicals and drugs interact with genes involved in malignant transfromation |
| (DGIdb 4.0) |
| Entrez ID | Symbol | Category | Interaction Types | Drug Claim Name | Drug Name | PMIDs |
| 3454 | IFNAR1 | DRUGGABLE GENOME, CLINICALLY ACTIONABLE, KINASE | INTERFERON ALFA-2A, RECOMBINANT | |||
| 3454 | IFNAR1 | DRUGGABLE GENOME, CLINICALLY ACTIONABLE, KINASE | MEDI-546 | ANIFROLUMAB | ||
| 3454 | IFNAR1 | DRUGGABLE GENOME, CLINICALLY ACTIONABLE, KINASE | PEG-INTERFERON ALFACON-1 | |||
| 3454 | IFNAR1 | DRUGGABLE GENOME, CLINICALLY ACTIONABLE, KINASE | agonist | CHEMBL2109047 | INTERFERON ALFA-N3 | |
| 3454 | IFNAR1 | DRUGGABLE GENOME, CLINICALLY ACTIONABLE, KINASE | INTERFERON ALFA-N1 | |||
| 3454 | IFNAR1 | DRUGGABLE GENOME, CLINICALLY ACTIONABLE, KINASE | INTERFERON BETA-1B | |||
| 3454 | IFNAR1 | DRUGGABLE GENOME, CLINICALLY ACTIONABLE, KINASE | R-IFN-1a | |||
| 3454 | IFNAR1 | DRUGGABLE GENOME, CLINICALLY ACTIONABLE, KINASE | MODIFIED IFN-ALPHA | |||
| 3454 | IFNAR1 | DRUGGABLE GENOME, CLINICALLY ACTIONABLE, KINASE | RECOMBINANT INTERFERON ALFA-2B | |||
| 3454 | IFNAR1 | DRUGGABLE GENOME, CLINICALLY ACTIONABLE, KINASE | agonist | CHEMBL1201563 | INTERFERON BETA-1B |
| Page: 1 2 3 4 5 6 |

Copyright 2023-Present -The University of Texas Health Science Center at Houston |