
|
|||||
|
 | |
| |
| |
| |
| |
| |
|
Gene: IFITM2 |
Gene summary for IFITM2 |
| Gene information | Species | Human | Gene symbol | IFITM2 | Gene ID | 10581 |
| Gene name | interferon induced transmembrane protein 2 | |
| Gene Alias | 1-8D | |
| Cytomap | 11p15.5 | |
| Gene Type | protein-coding | GO ID | GO:0002376 | UniProtAcc | Q01629 |
Top |
Malignant transformation analysis |
| Identification of the aberrant gene expression in precancerous and cancerous lesions by comparing the gene expression of stem-like cells in diseased tissues with normal stem cells |
| Entrez ID | Symbol | Replicates | Species | Organ | Tissue | Adj P-value | Log2FC | Malignancy |
| 10581 | IFITM2 | GSM4909285 | Human | Breast | IDC | 2.29e-03 | -2.46e-01 | 0.21 |
| 10581 | IFITM2 | GSM4909286 | Human | Breast | IDC | 2.31e-20 | -3.74e-01 | 0.1081 |
| 10581 | IFITM2 | GSM4909287 | Human | Breast | IDC | 5.95e-06 | -2.64e-01 | 0.2057 |
| 10581 | IFITM2 | GSM4909290 | Human | Breast | IDC | 1.20e-02 | -2.76e-01 | 0.2096 |
| 10581 | IFITM2 | GSM4909293 | Human | Breast | IDC | 3.16e-03 | -2.29e-01 | 0.1581 |
| 10581 | IFITM2 | GSM4909294 | Human | Breast | IDC | 8.29e-03 | -1.75e-01 | 0.2022 |
| 10581 | IFITM2 | GSM4909296 | Human | Breast | IDC | 4.85e-38 | 8.90e-01 | 0.1524 |
| 10581 | IFITM2 | GSM4909297 | Human | Breast | IDC | 3.83e-13 | 3.70e-01 | 0.1517 |
| 10581 | IFITM2 | GSM4909299 | Human | Breast | IDC | 6.94e-20 | 6.70e-01 | 0.035 |
| 10581 | IFITM2 | GSM4909301 | Human | Breast | IDC | 2.59e-32 | 8.02e-01 | 0.1577 |
| 10581 | IFITM2 | GSM4909302 | Human | Breast | IDC | 9.26e-19 | 6.88e-01 | 0.1545 |
| 10581 | IFITM2 | GSM4909305 | Human | Breast | IDC | 1.98e-05 | 4.36e-01 | 0.0436 |
| 10581 | IFITM2 | GSM4909306 | Human | Breast | IDC | 2.84e-16 | 5.80e-01 | 0.1564 |
| 10581 | IFITM2 | GSM4909307 | Human | Breast | IDC | 7.54e-28 | 7.26e-01 | 0.1569 |
| 10581 | IFITM2 | GSM4909308 | Human | Breast | IDC | 3.11e-22 | 6.56e-01 | 0.158 |
| 10581 | IFITM2 | GSM4909311 | Human | Breast | IDC | 1.92e-28 | 2.20e-01 | 0.1534 |
| 10581 | IFITM2 | GSM4909312 | Human | Breast | IDC | 8.55e-11 | 2.78e-01 | 0.1552 |
| 10581 | IFITM2 | GSM4909315 | Human | Breast | IDC | 1.55e-16 | -3.59e-01 | 0.21 |
| 10581 | IFITM2 | GSM4909316 | Human | Breast | IDC | 1.59e-03 | -3.29e-01 | 0.21 |
| 10581 | IFITM2 | GSM4909319 | Human | Breast | IDC | 4.67e-45 | 5.54e-01 | 0.1563 |
| Page: 1 2 3 4 5 6 7 8 9 10 11 |
| Tissue | Expression Dynamics | Abbreviation |
| Breast |  | IDC: Invasive ductal carcinoma |
| DCIS: Ductal carcinoma in situ | ||
| Precancer(BRCA1-mut): Precancerous lesion from BRCA1 mutation carriers | ||
| Cervix |  | CC: Cervix cancer |
| HSIL_HPV: HPV-infected high-grade squamous intraepithelial lesions | ||
| N_HPV: HPV-infected normal cervix | ||
| Colorectum (GSE201348) |  | FAP: Familial adenomatous polyposis |
| CRC: Colorectal cancer | ||
| Colorectum (HTA11) |  | AD: Adenomas |
| SER: Sessile serrated lesions | ||
| MSI-H: Microsatellite-high colorectal cancer | ||
| MSS: Microsatellite stable colorectal cancer | ||
| Endometrium | 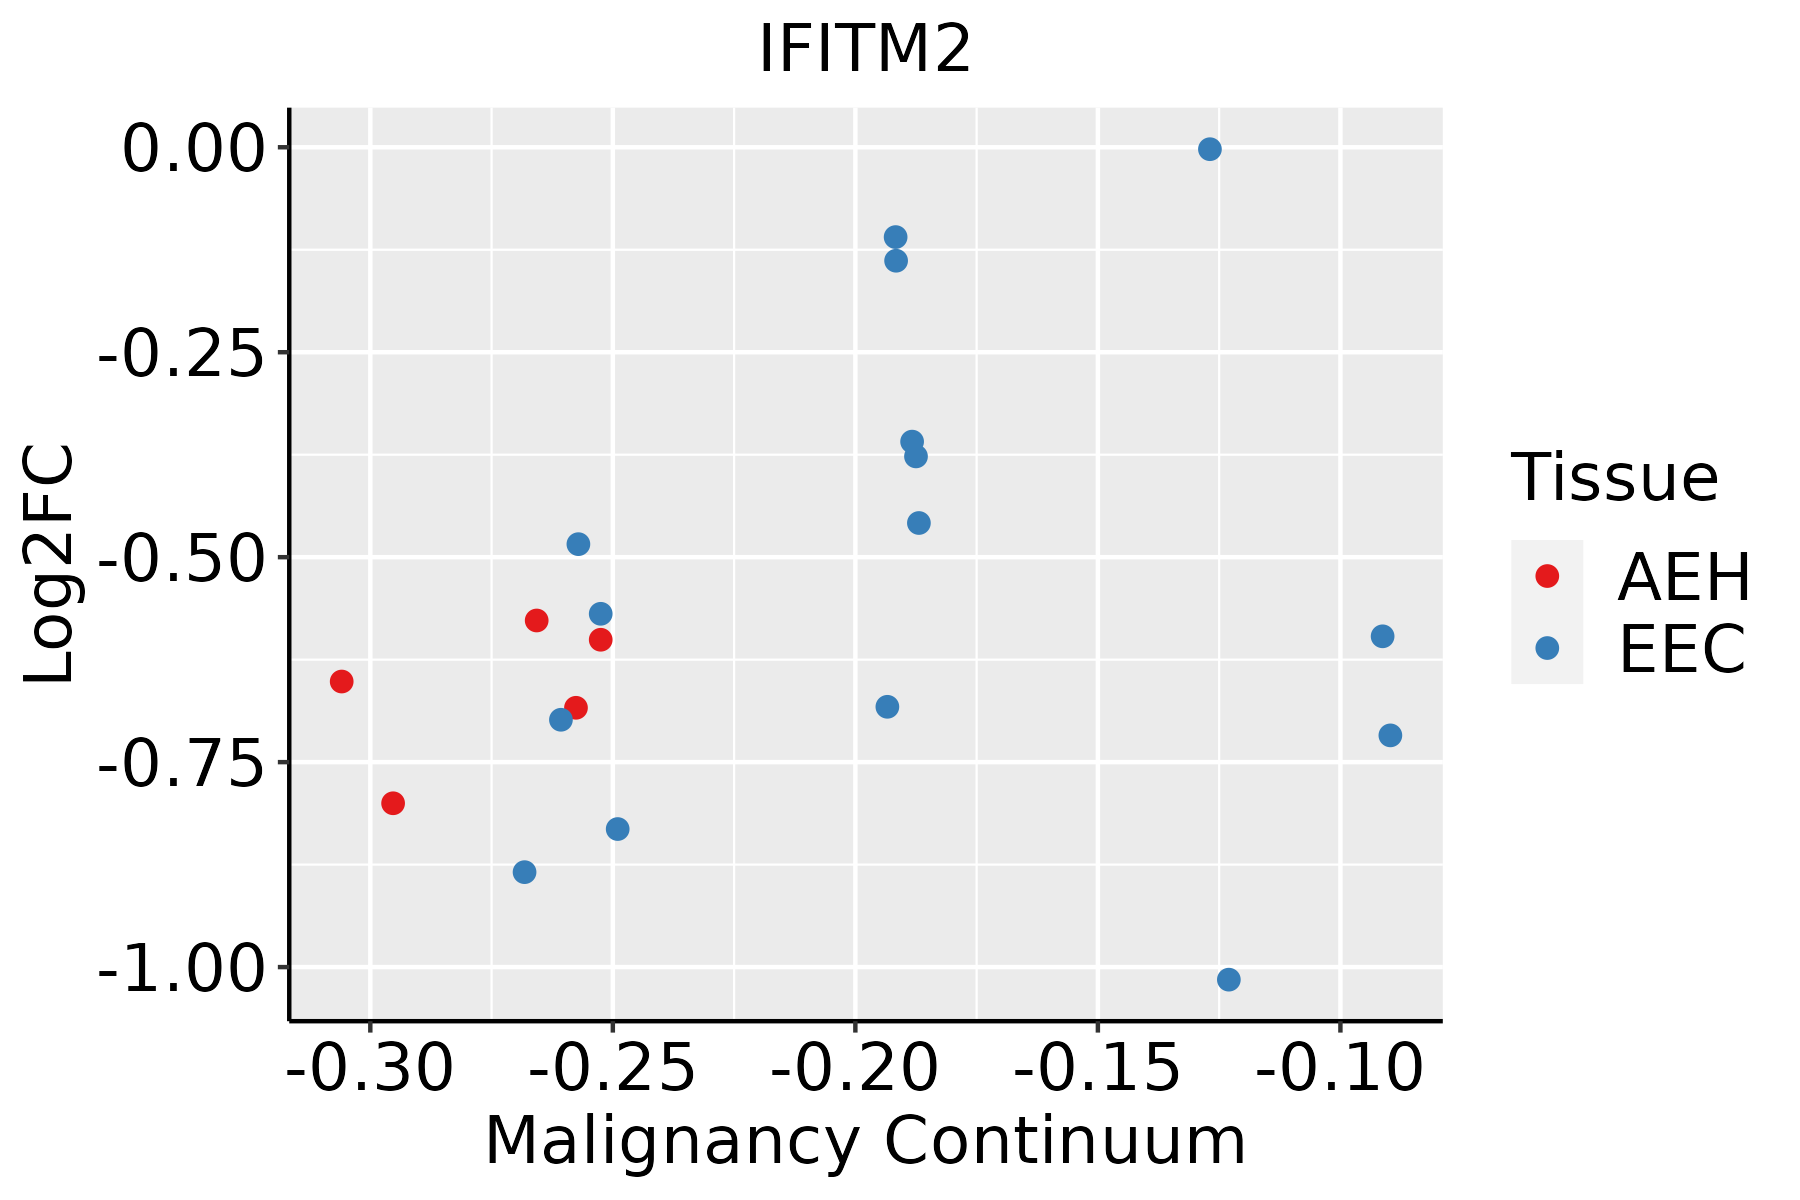 | AEH: Atypical endometrial hyperplasia |
| EEC: Endometrioid Cancer | ||
| Esophagus | 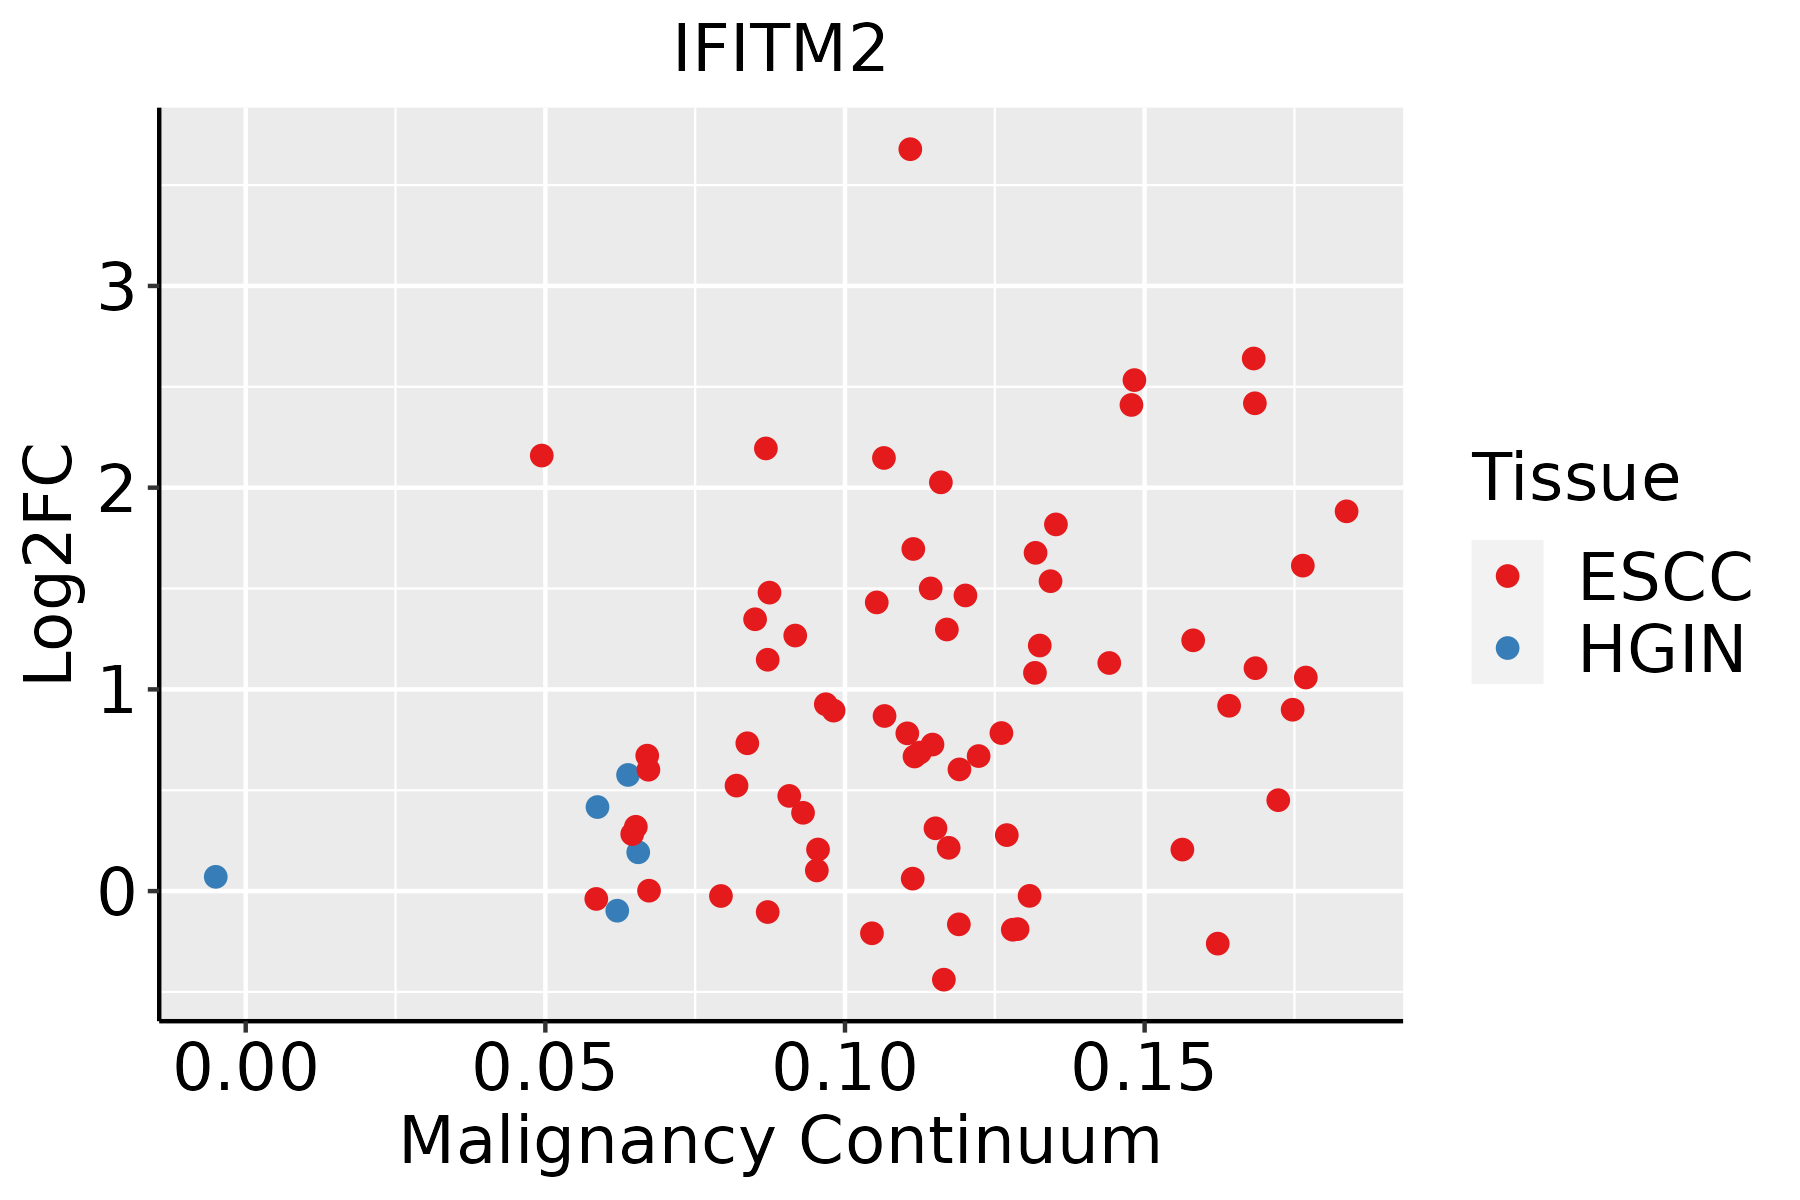 | ESCC: Esophageal squamous cell carcinoma |
| HGIN: High-grade intraepithelial neoplasias | ||
| LGIN: Low-grade intraepithelial neoplasias | ||
| Liver |  | HCC: Hepatocellular carcinoma |
| NAFLD: Non-alcoholic fatty liver disease | ||
| Lung |  | AAH: Atypical adenomatous hyperplasia |
| AIS: Adenocarcinoma in situ | ||
| IAC: Invasive lung adenocarcinoma | ||
| MIA: Minimally invasive adenocarcinoma | ||
| Oral Cavity | 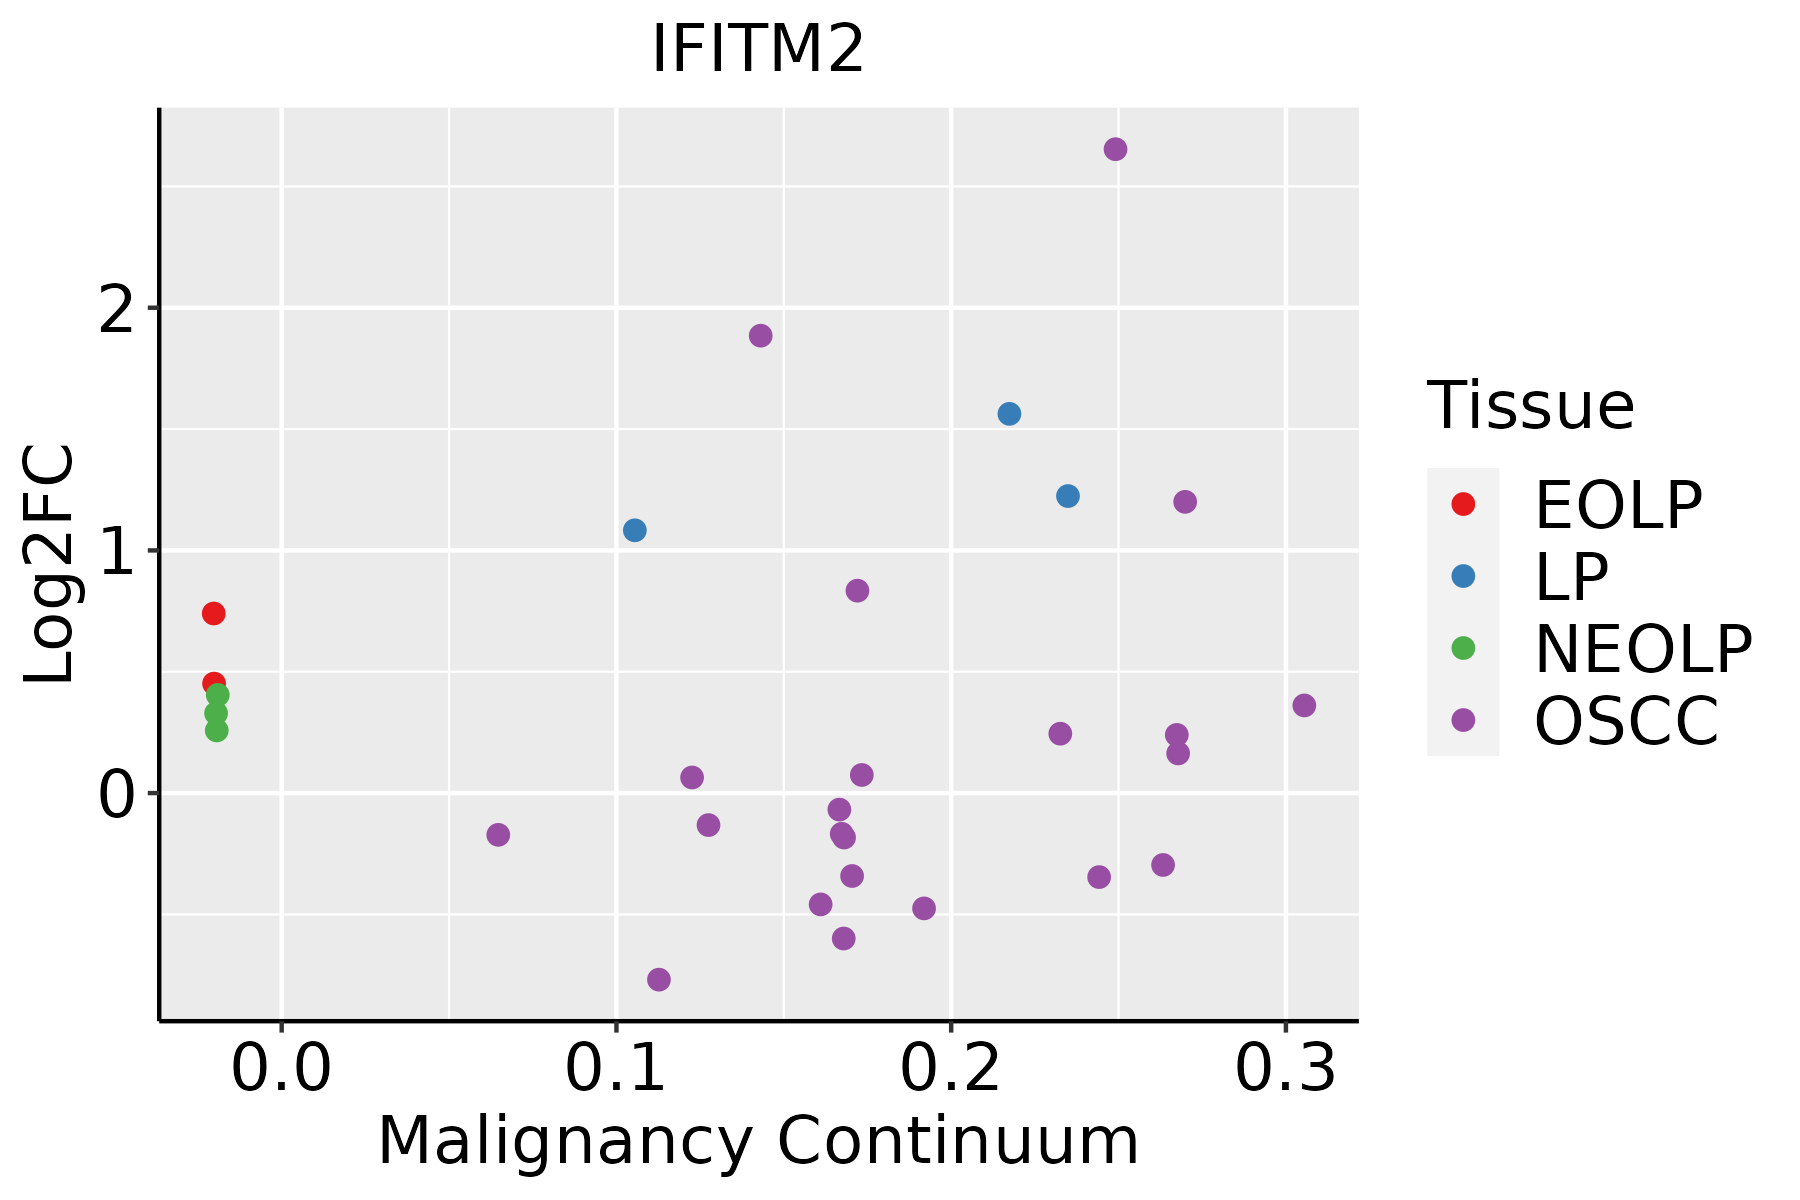 | EOLP: Erosive Oral lichen planus |
| LP: leukoplakia | ||
| NEOLP: Non-erosive oral lichen planus | ||
| OSCC: Oral squamous cell carcinoma | ||
| Skin | 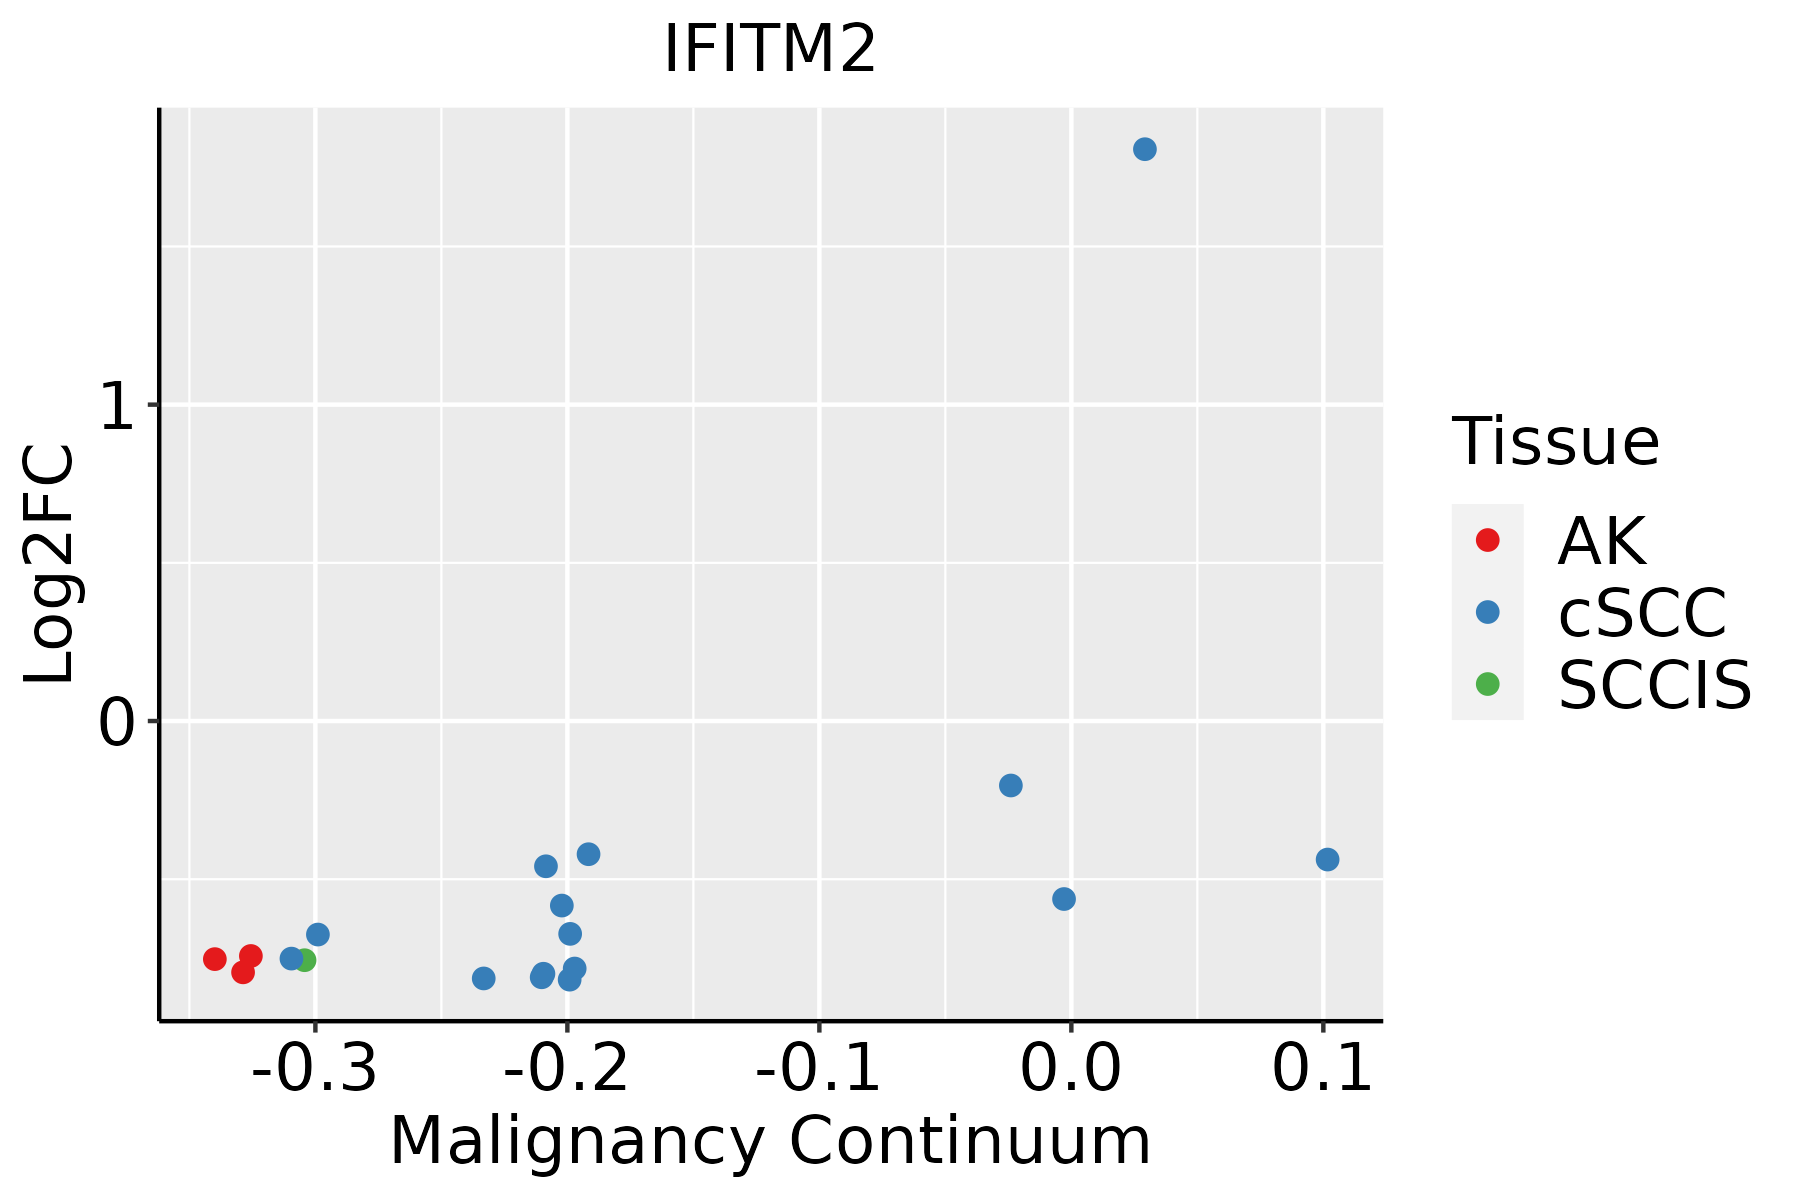 | AK: Actinic keratosis |
| cSCC: Cutaneous squamous cell carcinoma | ||
| SCCIS:squamous cell carcinoma in situ | ||
| Thyroid |  | ATC: Anaplastic thyroid cancer |
| HT: Hashimoto's thyroiditis | ||
| PTC: Papillary thyroid cancer |
| ∗log2FC in expression of this searched gene in stem-like cells from each diseased tissue sample relative to stem-like cells in normal samples in each tissue plotted against the malignancy continuum. Samples are colored based on if they are from different disease stage. |
Top |
Malignant transformation related pathway analysis |
| Find out the enriched GO biological processes and KEGG pathways involved in transition from healthy to precancer to cancer |
| Tissue | Disease Stage | Enriched GO biological Processes |
| Colorectum | AD |  |
| Colorectum | SER |  |
| Colorectum | MSS |  |
| Colorectum | MSI-H |  |
| Colorectum | FAP |  |
| ∗Top 15 enriched GO BP terms are showed in the bar plot of each disease state in each tissue. Each row represents a significant GO biological process which is colored according to the -log10(p.adjust). |
| Page: 1 2 3 4 5 6 7 8 9 |
| GO ID | Tissue | Disease Stage | Description | Gene Ratio | Bg Ratio | pvalue | p.adjust | Count |
| GO:00160329 | Breast | Precancer | viral process | 58/1080 | 415/18723 | 3.42e-10 | 3.16e-08 | 58 |
| GO:00190589 | Breast | Precancer | viral life cycle | 47/1080 | 317/18723 | 2.42e-09 | 1.99e-07 | 47 |
| GO:00444039 | Breast | Precancer | biological process involved in symbiotic interaction | 42/1080 | 290/18723 | 3.40e-08 | 2.11e-06 | 42 |
| GO:00521269 | Breast | Precancer | movement in host environment | 29/1080 | 175/18723 | 2.59e-07 | 1.28e-05 | 29 |
| GO:00517019 | Breast | Precancer | biological process involved in interaction with host | 31/1080 | 203/18723 | 6.52e-07 | 2.71e-05 | 31 |
| GO:00507929 | Breast | Precancer | regulation of viral process | 27/1080 | 164/18723 | 7.59e-07 | 3.05e-05 | 27 |
| GO:00444099 | Breast | Precancer | entry into host | 25/1080 | 151/18723 | 1.74e-06 | 6.19e-05 | 25 |
| GO:00467189 | Breast | Precancer | viral entry into host cell | 24/1080 | 144/18723 | 2.46e-06 | 8.35e-05 | 24 |
| GO:00190799 | Breast | Precancer | viral genome replication | 22/1080 | 131/18723 | 5.63e-06 | 1.66e-04 | 22 |
| GO:00439039 | Breast | Precancer | regulation of biological process involved in symbiotic interaction | 15/1080 | 72/18723 | 1.23e-05 | 3.17e-04 | 15 |
| GO:19039009 | Breast | Precancer | regulation of viral life cycle | 23/1080 | 148/18723 | 1.31e-05 | 3.30e-04 | 23 |
| GO:00523727 | Breast | Precancer | modulation by symbiont of entry into host | 12/1080 | 49/18723 | 1.61e-05 | 3.93e-04 | 12 |
| GO:00465964 | Breast | Precancer | regulation of viral entry into host cell | 11/1080 | 42/18723 | 1.83e-05 | 4.35e-04 | 11 |
| GO:19039014 | Breast | Precancer | negative regulation of viral life cycle | 7/1080 | 25/18723 | 4.00e-04 | 5.42e-03 | 7 |
| GO:0046597 | Breast | Precancer | negative regulation of viral entry into host cell | 6/1080 | 21/18723 | 9.31e-04 | 1.06e-02 | 6 |
| GO:00450697 | Breast | Precancer | regulation of viral genome replication | 13/1080 | 85/18723 | 1.12e-03 | 1.23e-02 | 13 |
| GO:00485255 | Breast | Precancer | negative regulation of viral process | 12/1080 | 92/18723 | 6.51e-03 | 4.51e-02 | 12 |
| GO:001603214 | Breast | IDC | viral process | 75/1434 | 415/18723 | 1.98e-12 | 4.02e-10 | 75 |
| GO:001905814 | Breast | IDC | viral life cycle | 61/1434 | 317/18723 | 1.61e-11 | 2.77e-09 | 61 |
| GO:001907914 | Breast | IDC | viral genome replication | 32/1434 | 131/18723 | 2.82e-09 | 2.46e-07 | 32 |
| Page: 1 2 3 4 5 6 7 8 9 10 11 12 13 14 15 16 17 18 19 20 21 22 23 24 25 26 27 |
| Pathway ID | Tissue | Disease Stage | Description | Gene Ratio | Bg Ratio | pvalue | p.adjust | qvalue | Count |
| Page: 1 |
Top |
Cell-cell communication analysis |
| Identification of potential cell-cell interactions between two cell types and their ligand-receptor pairs for different disease states |
| Ligand | Receptor | LRpair | Pathway | Tissue | Disease Stage |
| Page: 1 |
Top |
Single-cell gene regulatory network inference analysis |
| Find out the significant the regulons (TFs) and the target genes of each regulon across cell types for different disease states |
| TF | Cell Type | Tissue | Disease Stage | Target Gene | RSS | Regulon Activity |
| ∗The dot plots of a searched regulon are shown for all cell subpopulations in each disease state of each tissue based on the regulon specific score inferred using pySCENIC and by calculating the average expression. |
| Page: 1 |
Top |
Somatic mutation of malignant transformation related genes |
| Annotation of somatic variants for genes involved in malignant transformation |
| Hugo Symbol | Variant Class | Variant Classification | dbSNP RS | HGVSc | HGVSp | HGVSp Short | SWISSPROT | BIOTYPE | SIFT | PolyPhen | Tumor Sample Barcode | Tissue | Histology | Sex | Age | Stage | Therapy Types | Drugs | Outcome |
| IFITM2 | SNV | Missense_Mutation | novel | c.10N>T | p.Ile4Phe | p.I4F | Q01629 | protein_coding | deleterious(0.01) | benign(0.045) | TCGA-A2-A4RW-01 | Breast | breast invasive carcinoma | Female | <65 | III/IV | Unknown | Unknown | SD |
| IFITM2 | SNV | Missense_Mutation | novel | c.131N>C | p.Val44Ala | p.V44A | Q01629 | protein_coding | deleterious(0.01) | possibly_damaging(0.816) | TCGA-D8-A1XA-01 | Breast | breast invasive carcinoma | Female | <65 | I/II | Unknown | Unknown | SD |
| IFITM2 | SNV | Missense_Mutation | c.24N>A | p.Phe8Leu | p.F8L | Q01629 | protein_coding | deleterious(0.02) | probably_damaging(0.997) | TCGA-AG-A002-01 | Colorectum | rectum adenocarcinoma | Male | <65 | I/II | Unknown | Unknown | SD | |
| IFITM2 | SNV | Missense_Mutation | rs530463865 | c.346N>G | p.Met116Val | p.M116V | Q01629 | protein_coding | tolerated(0.36) | benign(0.007) | TCGA-A5-A0GA-01 | Endometrium | uterine corpus endometrioid carcinoma | Female | >=65 | III/IV | Chemotherapy | taxol | PD |
| IFITM2 | SNV | Missense_Mutation | novel | c.63N>A | p.Met21Ile | p.M21I | Q01629 | protein_coding | tolerated(0.05) | benign(0.005) | TCGA-AX-A1CE-01 | Endometrium | uterine corpus endometrioid carcinoma | Female | <65 | I/II | Unspecific | Paclitaxel | SD |
| IFITM2 | SNV | Missense_Mutation | novel | c.226N>A | p.Ala76Thr | p.A76T | Q01629 | protein_coding | deleterious(0.02) | possibly_damaging(0.702) | TCGA-AX-A1CE-01 | Endometrium | uterine corpus endometrioid carcinoma | Female | <65 | I/II | Unspecific | Paclitaxel | SD |
| IFITM2 | SNV | Missense_Mutation | novel | c.272N>G | p.Asp91Gly | p.D91G | Q01629 | protein_coding | deleterious(0.01) | possibly_damaging(0.61) | TCGA-DF-A2KU-01 | Endometrium | uterine corpus endometrioid carcinoma | Female | Unknown | I/II | Unknown | Unknown | SD |
| IFITM2 | SNV | Missense_Mutation | rs371736596 | c.50N>T | p.Pro17Leu | p.P17L | Q01629 | protein_coding | deleterious(0.05) | benign(0.018) | TCGA-55-6985-01 | Lung | lung adenocarcinoma | Female | <65 | I/II | Unknown | Unknown | SD |
| IFITM2 | SNV | Missense_Mutation | c.103N>A | p.His35Asn | p.H35N | Q01629 | protein_coding | tolerated(0.11) | possibly_damaging(0.71) | TCGA-22-5472-01 | Lung | lung squamous cell carcinoma | Male | >=65 | I/II | Chemotherapy | carboplatin | PD | |
| IFITM2 | SNV | Missense_Mutation | c.112G>T | p.Ala38Ser | p.A38S | Q01629 | protein_coding | deleterious(0.03) | possibly_damaging(0.489) | TCGA-CD-8536-01 | Stomach | stomach adenocarcinoma | Male | >=65 | I/II | Chemotherapy | epirubicin | CR |
| Page: 1 2 |
Top |
Related drugs of malignant transformation related genes |
| Identification of chemicals and drugs interact with genes involved in malignant transfromation |
| (DGIdb 4.0) |
| Entrez ID | Symbol | Category | Interaction Types | Drug Claim Name | Drug Name | PMIDs |
| Page: 1 |

Copyright 2023-Present -The University of Texas Health Science Center at Houston |