
|
|||||
|
 | |
| |
| |
| |
| |
| |
|
Gene: IFITM10 |
Gene summary for IFITM10 |
| Gene information | Species | Human | Gene symbol | IFITM10 | Gene ID | 402778 |
| Gene name | interferon induced transmembrane protein 10 | |
| Gene Alias | DSPA3 | |
| Cytomap | 11p15.5 | |
| Gene Type | protein-coding | GO ID | GO:0005575 | UniProtAcc | A6NMD0 |
Top |
Malignant transformation analysis |
| Identification of the aberrant gene expression in precancerous and cancerous lesions by comparing the gene expression of stem-like cells in diseased tissues with normal stem cells |
| Entrez ID | Symbol | Replicates | Species | Organ | Tissue | Adj P-value | Log2FC | Malignancy |
| 402778 | IFITM10 | P1_cSCC | Human | Skin | cSCC | 2.05e-04 | 2.87e-01 | 0.0292 |
| 402778 | IFITM10 | P2_cSCC | Human | Skin | cSCC | 2.33e-02 | 1.88e-01 | -0.024 |
| 402778 | IFITM10 | P4_cSCC | Human | Skin | cSCC | 1.29e-10 | 3.35e-01 | -0.00290000000000005 |
| 402778 | IFITM10 | P10_cSCC | Human | Skin | cSCC | 1.25e-11 | 4.23e-01 | 0.1017 |
| Page: 1 |
| Tissue | Expression Dynamics | Abbreviation |
| Skin | 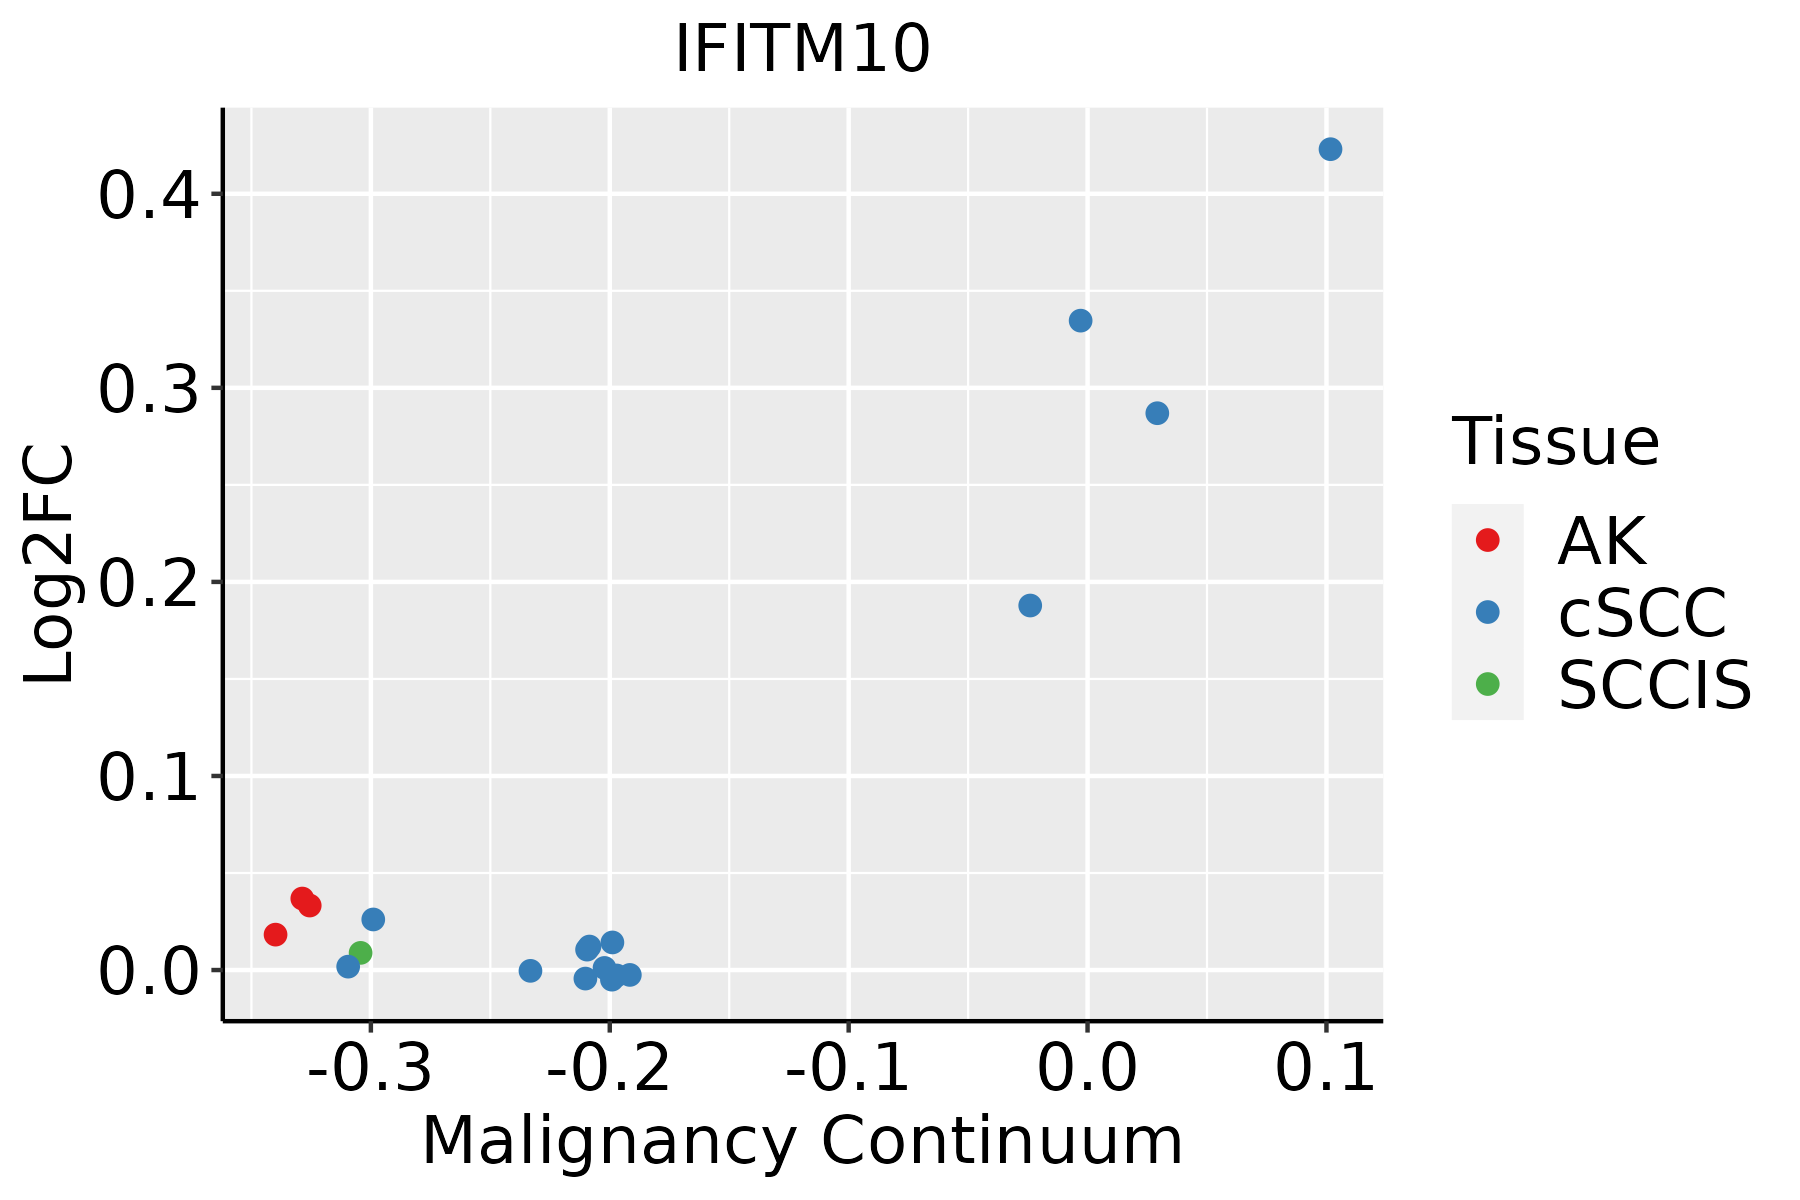 | AK: Actinic keratosis |
| cSCC: Cutaneous squamous cell carcinoma | ||
| SCCIS:squamous cell carcinoma in situ |
| ∗log2FC in expression of this searched gene in stem-like cells from each diseased tissue sample relative to stem-like cells in normal samples in each tissue plotted against the malignancy continuum. Samples are colored based on if they are from different disease stage. |
Top |
Malignant transformation related pathway analysis |
| Find out the enriched GO biological processes and KEGG pathways involved in transition from healthy to precancer to cancer |
| Tissue | Disease Stage | Enriched GO biological Processes |
| Colorectum | AD |  |
| Colorectum | SER |  |
| Colorectum | MSS |  |
| Colorectum | MSI-H |  |
| Colorectum | FAP |  |
| ∗Top 15 enriched GO BP terms are showed in the bar plot of each disease state in each tissue. Each row represents a significant GO biological process which is colored according to the -log10(p.adjust). |
| Page: 1 2 3 4 5 6 7 8 9 |
| GO ID | Tissue | Disease Stage | Description | Gene Ratio | Bg Ratio | pvalue | p.adjust | Count |
| Page: 1 |
| Pathway ID | Tissue | Disease Stage | Description | Gene Ratio | Bg Ratio | pvalue | p.adjust | qvalue | Count |
| Page: 1 |
Top |
Cell-cell communication analysis |
| Identification of potential cell-cell interactions between two cell types and their ligand-receptor pairs for different disease states |
| Ligand | Receptor | LRpair | Pathway | Tissue | Disease Stage |
| Page: 1 |
Top |
Single-cell gene regulatory network inference analysis |
| Find out the significant the regulons (TFs) and the target genes of each regulon across cell types for different disease states |
| TF | Cell Type | Tissue | Disease Stage | Target Gene | RSS | Regulon Activity |
| ∗The dot plots of a searched regulon are shown for all cell subpopulations in each disease state of each tissue based on the regulon specific score inferred using pySCENIC and by calculating the average expression. |
| Page: 1 |
Top |
Somatic mutation of malignant transformation related genes |
| Annotation of somatic variants for genes involved in malignant transformation |
| Hugo Symbol | Variant Class | Variant Classification | dbSNP RS | HGVSc | HGVSp | HGVSp Short | SWISSPROT | BIOTYPE | SIFT | PolyPhen | Tumor Sample Barcode | Tissue | Histology | Sex | Age | Stage | Therapy Types | Drugs | Outcome |
| IFITM10 | SNV | Missense_Mutation | novel | c.453N>A | p.Asn151Lys | p.N151K | A6NMD0 | protein_coding | tolerated(0.2) | benign(0.217) | TCGA-C8-A26Z-01 | Breast | breast invasive carcinoma | Female | <65 | I/II | Hormone Therapy | tamoxiphen | CR |
| IFITM10 | SNV | Missense_Mutation | novel | c.281N>T | p.Ser94Leu | p.S94L | A6NMD0 | protein_coding | tolerated_low_confidence(0.13) | benign(0.068) | TCGA-D8-A27V-01 | Breast | breast invasive carcinoma | Female | <65 | I/II | Hormone Therapy | tamoxiphen | SD |
| IFITM10 | SNV | Missense_Mutation | novel | c.254N>A | p.Ala85Asp | p.A85D | A6NMD0 | protein_coding | deleterious_low_confidence(0.03) | benign(0.012) | TCGA-OL-A6VQ-01 | Breast | breast invasive carcinoma | Female | <65 | I/II | Unknown | Unknown | SD |
| IFITM10 | SNV | Missense_Mutation | c.327N>C | p.Lys109Asn | p.K109N | A6NMD0 | protein_coding | deleterious_low_confidence(0.03) | probably_damaging(0.912) | TCGA-Q1-A73O-01 | Cervix | cervical & endocervical cancer | Female | <65 | I/II | Chemotherapy | cisplatin | CR | |
| IFITM10 | SNV | Missense_Mutation | novel | c.301N>A | p.Pro101Thr | p.P101T | A6NMD0 | protein_coding | deleterious_low_confidence(0) | benign(0.037) | TCGA-VS-A9U5-01 | Cervix | cervical & endocervical cancer | Female | <65 | I/II | Chemotherapy | cisplatin | CR |
| IFITM10 | SNV | Missense_Mutation | c.413C>T | p.Thr138Met | p.T138M | A6NMD0 | protein_coding | deleterious(0.02) | probably_damaging(0.956) | TCGA-AZ-4615-01 | Colorectum | colon adenocarcinoma | Male | >=65 | III/IV | Chemotherapy | xeloda | PD | |
| IFITM10 | SNV | Missense_Mutation | c.553C>G | p.Leu185Val | p.L185V | A6NMD0 | protein_coding | tolerated(0.2) | possibly_damaging(0.734) | TCGA-CM-4746-01 | Colorectum | colon adenocarcinoma | Male | <65 | I/II | Unknown | Unknown | SD | |
| IFITM10 | SNV | Missense_Mutation | c.16C>T | p.Arg6Trp | p.R6W | A6NMD0 | protein_coding | deleterious_low_confidence(0) | benign(0.025) | TCGA-G4-6315-01 | Colorectum | colon adenocarcinoma | Male | >=65 | III/IV | Chemotherapy | fluorouracil | SD | |
| IFITM10 | SNV | Missense_Mutation | novel | c.398N>T | p.Thr133Met | p.T133M | A6NMD0 | protein_coding | deleterious(0) | possibly_damaging(0.657) | TCGA-A5-A1OF-01 | Endometrium | uterine corpus endometrioid carcinoma | Female | <65 | I/II | Unknown | Unknown | SD |
| IFITM10 | SNV | Missense_Mutation | novel | c.556C>A | p.Leu186Ile | p.L186I | A6NMD0 | protein_coding | deleterious(0.05) | possibly_damaging(0.873) | TCGA-AJ-A3EL-01 | Endometrium | uterine corpus endometrioid carcinoma | Female | <65 | I/II | Unknown | Unknown | SD |
| Page: 1 2 |
Top |
Related drugs of malignant transformation related genes |
| Identification of chemicals and drugs interact with genes involved in malignant transfromation |
| (DGIdb 4.0) |
| Entrez ID | Symbol | Category | Interaction Types | Drug Claim Name | Drug Name | PMIDs |
| Page: 1 |

Copyright 2023-Present -The University of Texas Health Science Center at Houston |