
|
|||||
|
 | |
| |
| |
| |
| |
| |
|
Gene: IFITM1 |
Gene summary for IFITM1 |
| Gene information | Species | Human | Gene symbol | IFITM1 | Gene ID | 8519 |
| Gene name | interferon induced transmembrane protein 1 | |
| Gene Alias | 9-27 | |
| Cytomap | 11p15.5 | |
| Gene Type | protein-coding | GO ID | GO:0001503 | UniProtAcc | A0A024R210 |
Top |
Malignant transformation analysis |
| Identification of the aberrant gene expression in precancerous and cancerous lesions by comparing the gene expression of stem-like cells in diseased tissues with normal stem cells |
| Entrez ID | Symbol | Replicates | Species | Organ | Tissue | Adj P-value | Log2FC | Malignancy |
| 8519 | IFITM1 | GSM4909287 | Human | Breast | IDC | 3.28e-08 | 3.84e-01 | 0.2057 |
| 8519 | IFITM1 | GSM4909296 | Human | Breast | IDC | 1.06e-18 | 5.98e-01 | 0.1524 |
| 8519 | IFITM1 | GSM4909300 | Human | Breast | IDC | 3.75e-06 | 4.69e-01 | 0.0334 |
| 8519 | IFITM1 | GSM4909301 | Human | Breast | IDC | 1.84e-16 | 5.68e-01 | 0.1577 |
| 8519 | IFITM1 | GSM4909302 | Human | Breast | IDC | 1.02e-12 | 4.71e-01 | 0.1545 |
| 8519 | IFITM1 | GSM4909305 | Human | Breast | IDC | 3.33e-19 | 6.03e-01 | 0.0436 |
| 8519 | IFITM1 | GSM4909306 | Human | Breast | IDC | 8.19e-30 | 6.26e-01 | 0.1564 |
| 8519 | IFITM1 | GSM4909307 | Human | Breast | IDC | 3.46e-48 | 9.19e-01 | 0.1569 |
| 8519 | IFITM1 | GSM4909308 | Human | Breast | IDC | 5.15e-43 | 8.44e-01 | 0.158 |
| 8519 | IFITM1 | GSM4909309 | Human | Breast | IDC | 1.16e-73 | 1.42e+00 | 0.0483 |
| 8519 | IFITM1 | GSM4909311 | Human | Breast | IDC | 4.30e-02 | 6.67e-02 | 0.1534 |
| 8519 | IFITM1 | GSM4909319 | Human | Breast | IDC | 2.30e-36 | 6.82e-01 | 0.1563 |
| 8519 | IFITM1 | GSM4909320 | Human | Breast | IDC | 4.04e-15 | 8.45e-01 | 0.1575 |
| 8519 | IFITM1 | GSM4909321 | Human | Breast | IDC | 9.23e-17 | 5.49e-01 | 0.1559 |
| 8519 | IFITM1 | brca2 | Human | Breast | Precancer | 3.36e-14 | 4.71e-01 | -0.024 |
| 8519 | IFITM1 | P3 | Human | Breast | IDC | 4.35e-02 | 4.97e-01 | 0.1542 |
| 8519 | IFITM1 | AEH-subject1 | Human | Endometrium | AEH | 4.22e-04 | -2.76e-01 | -0.3059 |
| 8519 | IFITM1 | AEH-subject2 | Human | Endometrium | AEH | 3.21e-15 | -4.23e-01 | -0.2525 |
| 8519 | IFITM1 | AEH-subject3 | Human | Endometrium | AEH | 8.61e-11 | -3.89e-01 | -0.2576 |
| 8519 | IFITM1 | AEH-subject4 | Human | Endometrium | AEH | 2.53e-06 | -2.67e-01 | -0.2657 |
| Page: 1 2 3 4 5 6 7 8 |
| Tissue | Expression Dynamics | Abbreviation |
| Breast | 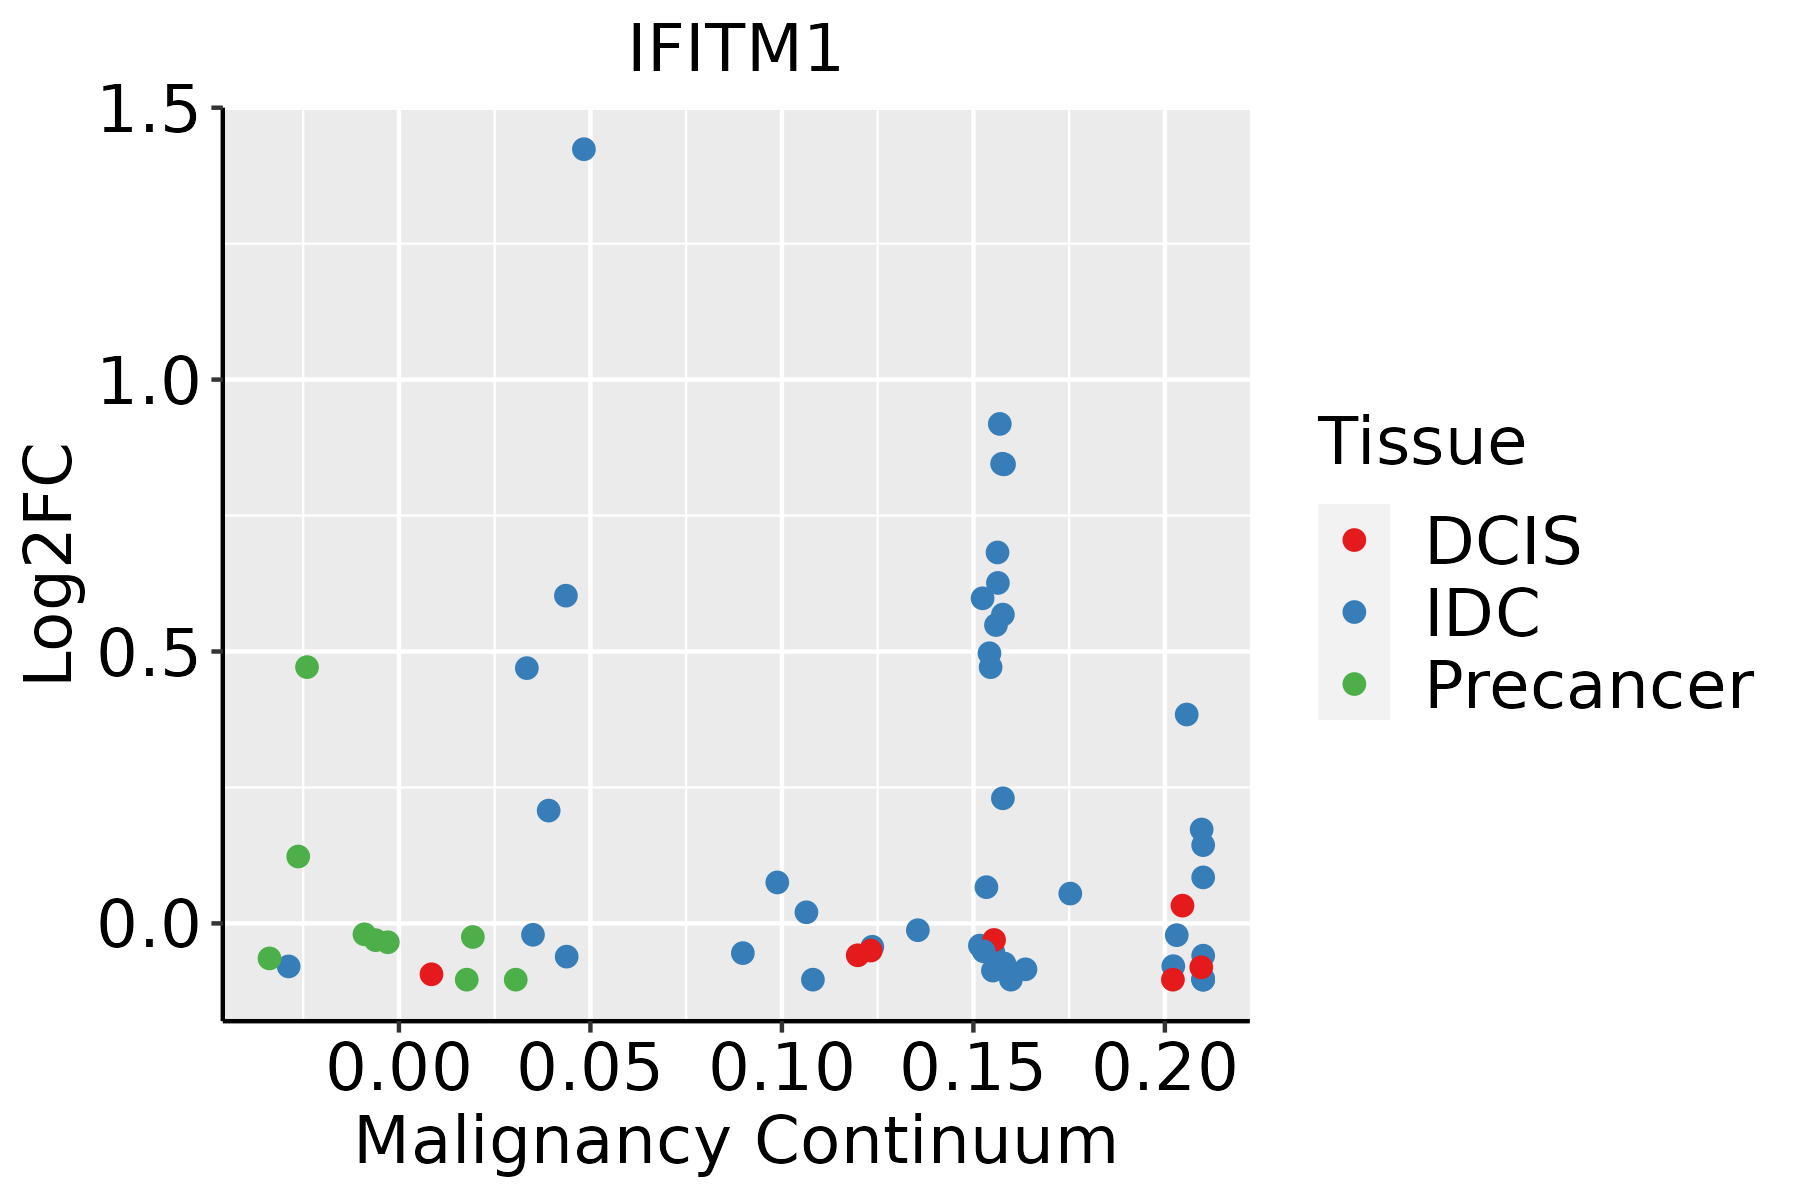 | IDC: Invasive ductal carcinoma |
| DCIS: Ductal carcinoma in situ | ||
| Precancer(BRCA1-mut): Precancerous lesion from BRCA1 mutation carriers | ||
| Endometrium | 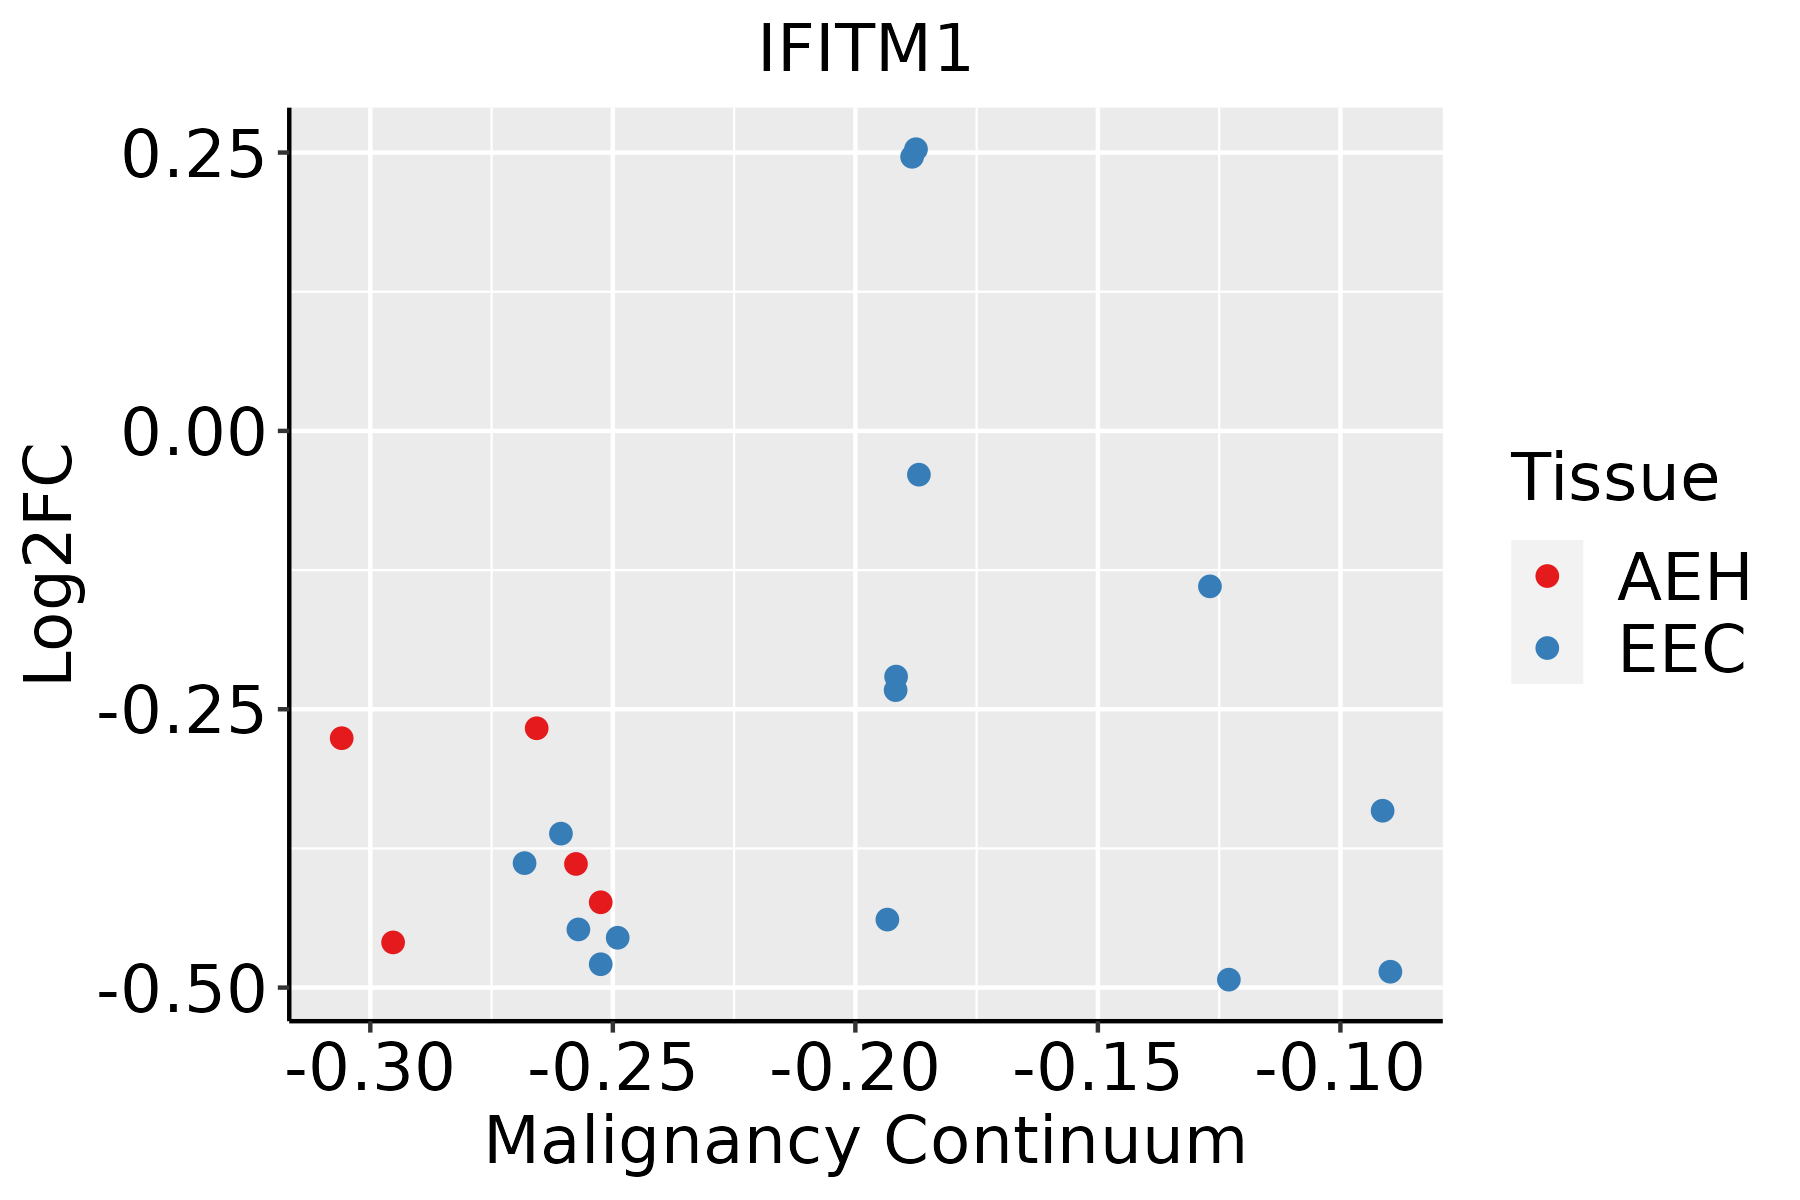 | AEH: Atypical endometrial hyperplasia |
| EEC: Endometrioid Cancer | ||
| Esophagus | 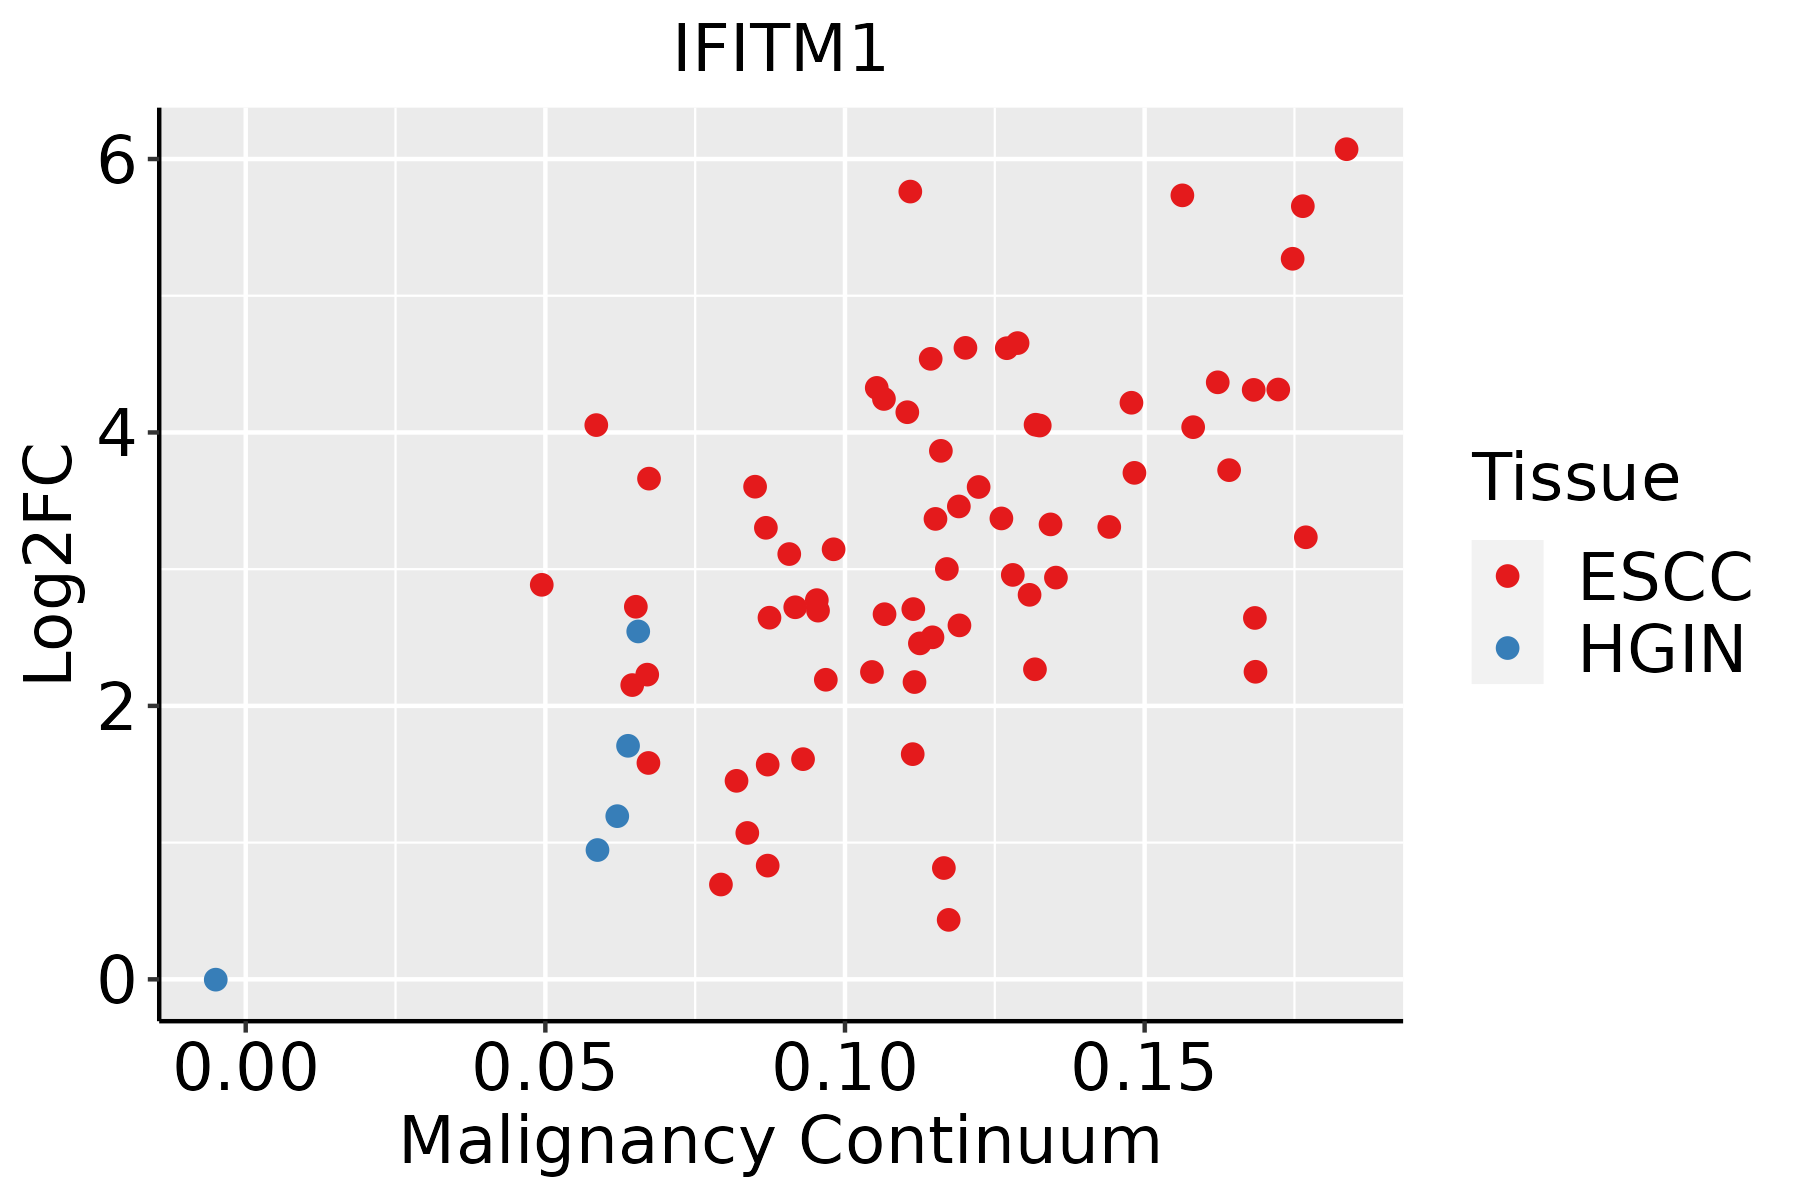 | ESCC: Esophageal squamous cell carcinoma |
| HGIN: High-grade intraepithelial neoplasias | ||
| LGIN: Low-grade intraepithelial neoplasias | ||
| Liver | 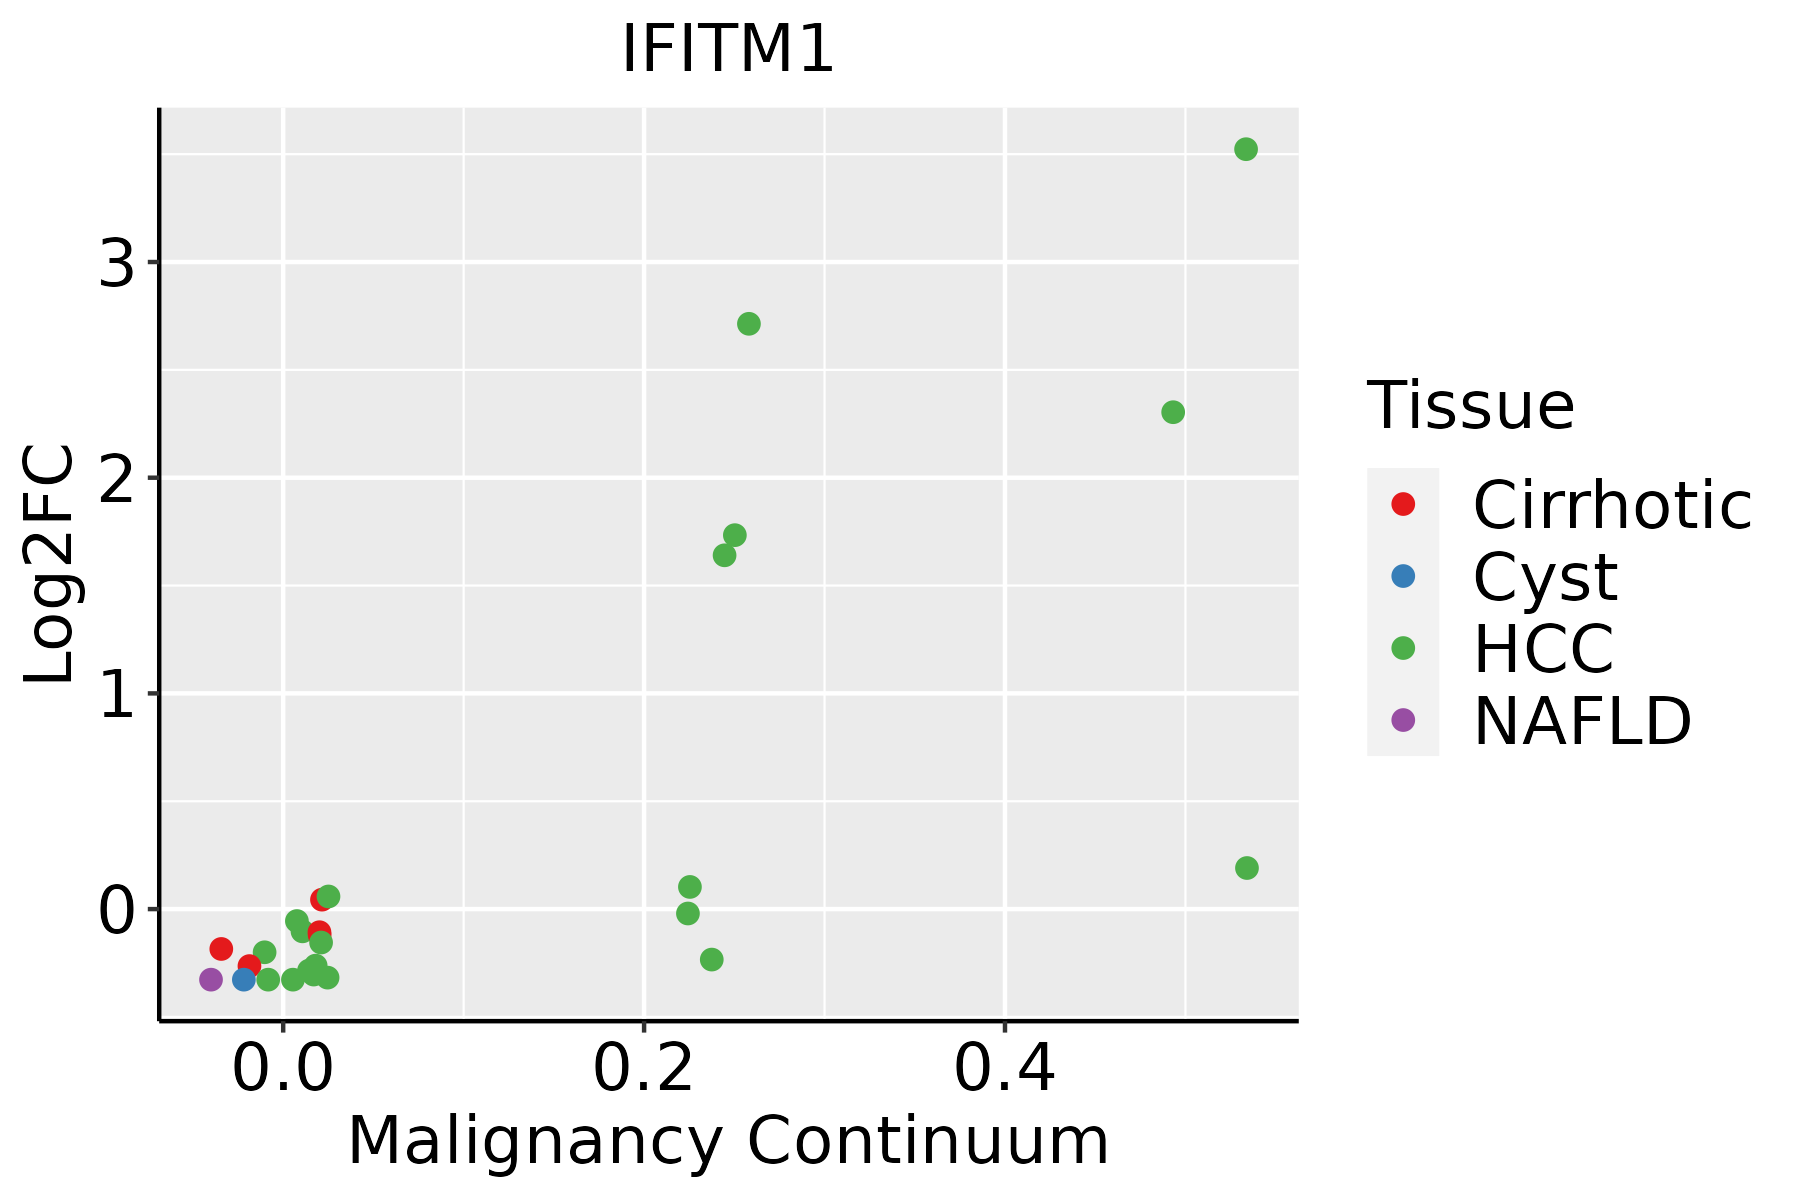 | HCC: Hepatocellular carcinoma |
| NAFLD: Non-alcoholic fatty liver disease | ||
| Oral Cavity | 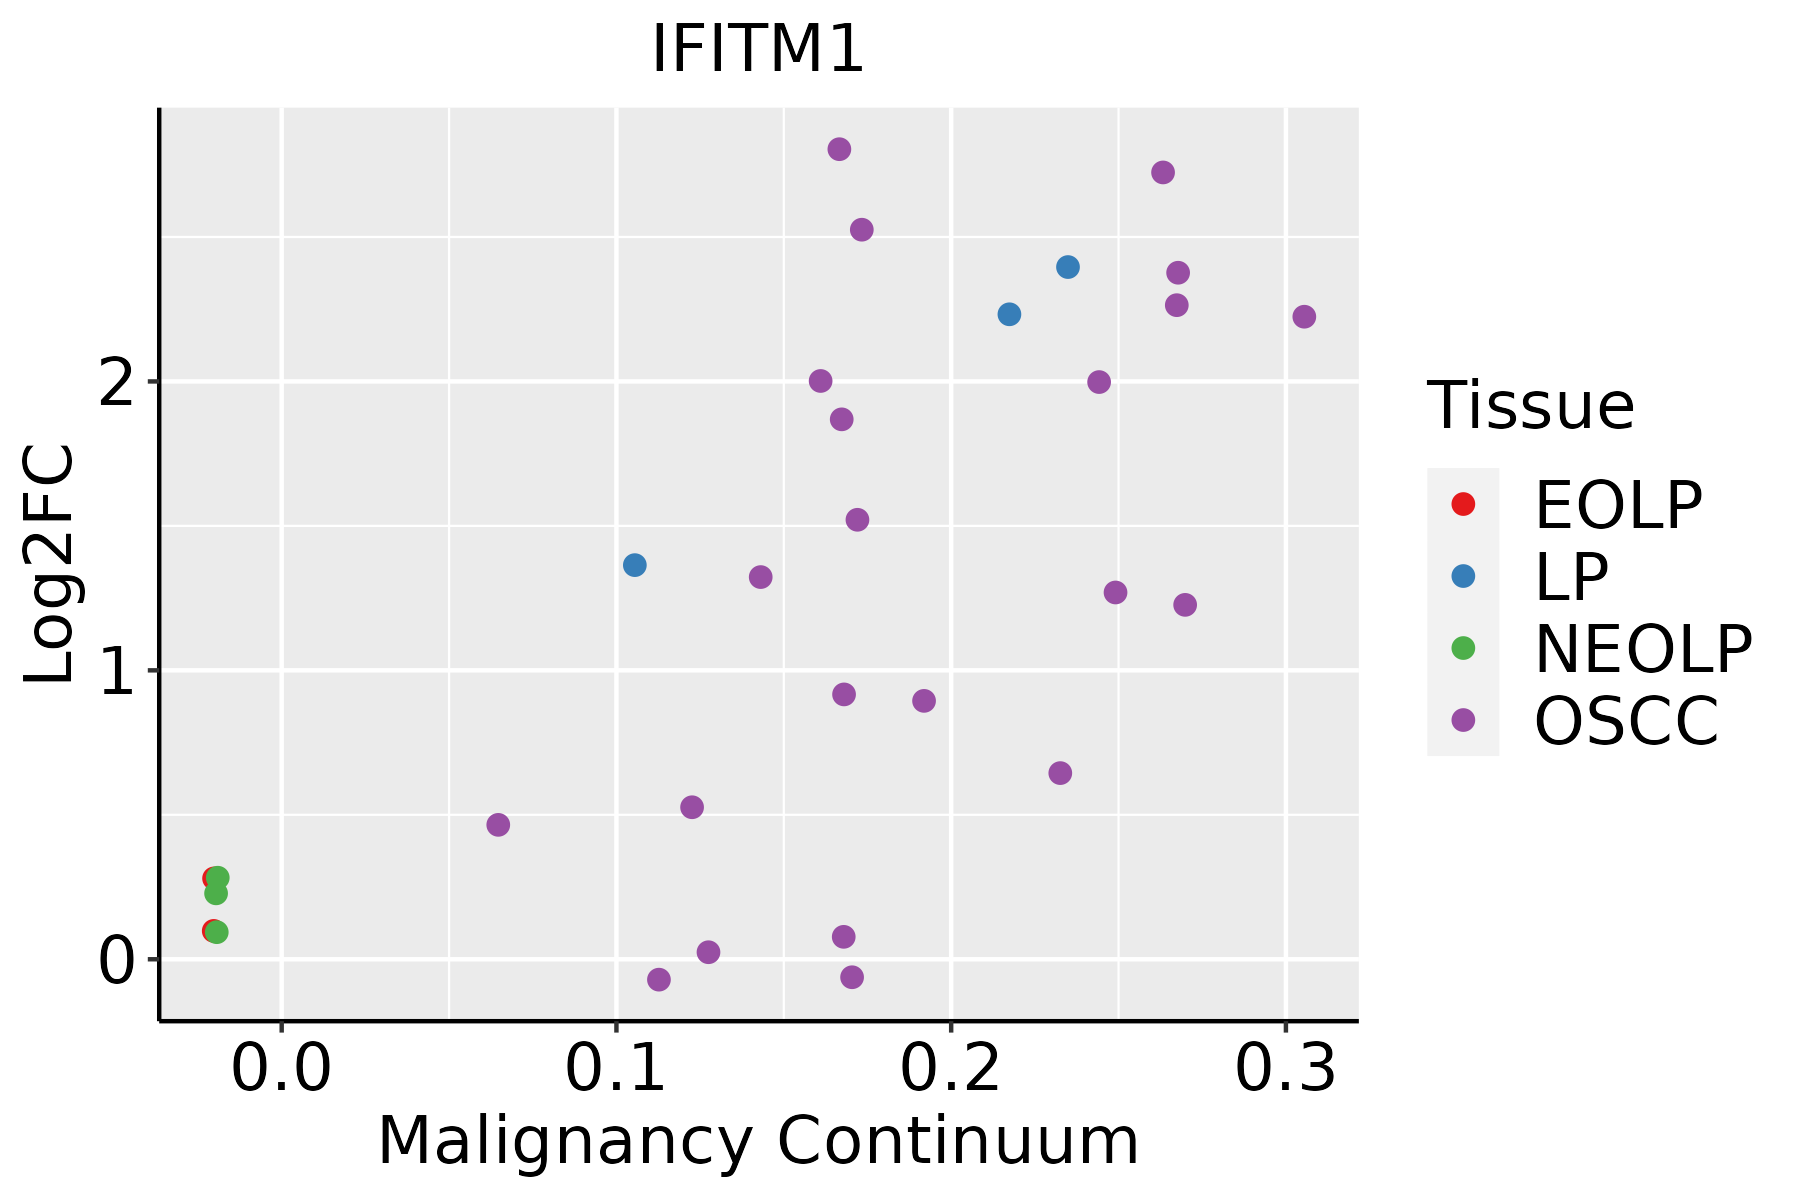 | EOLP: Erosive Oral lichen planus |
| LP: leukoplakia | ||
| NEOLP: Non-erosive oral lichen planus | ||
| OSCC: Oral squamous cell carcinoma | ||
| Prostate | 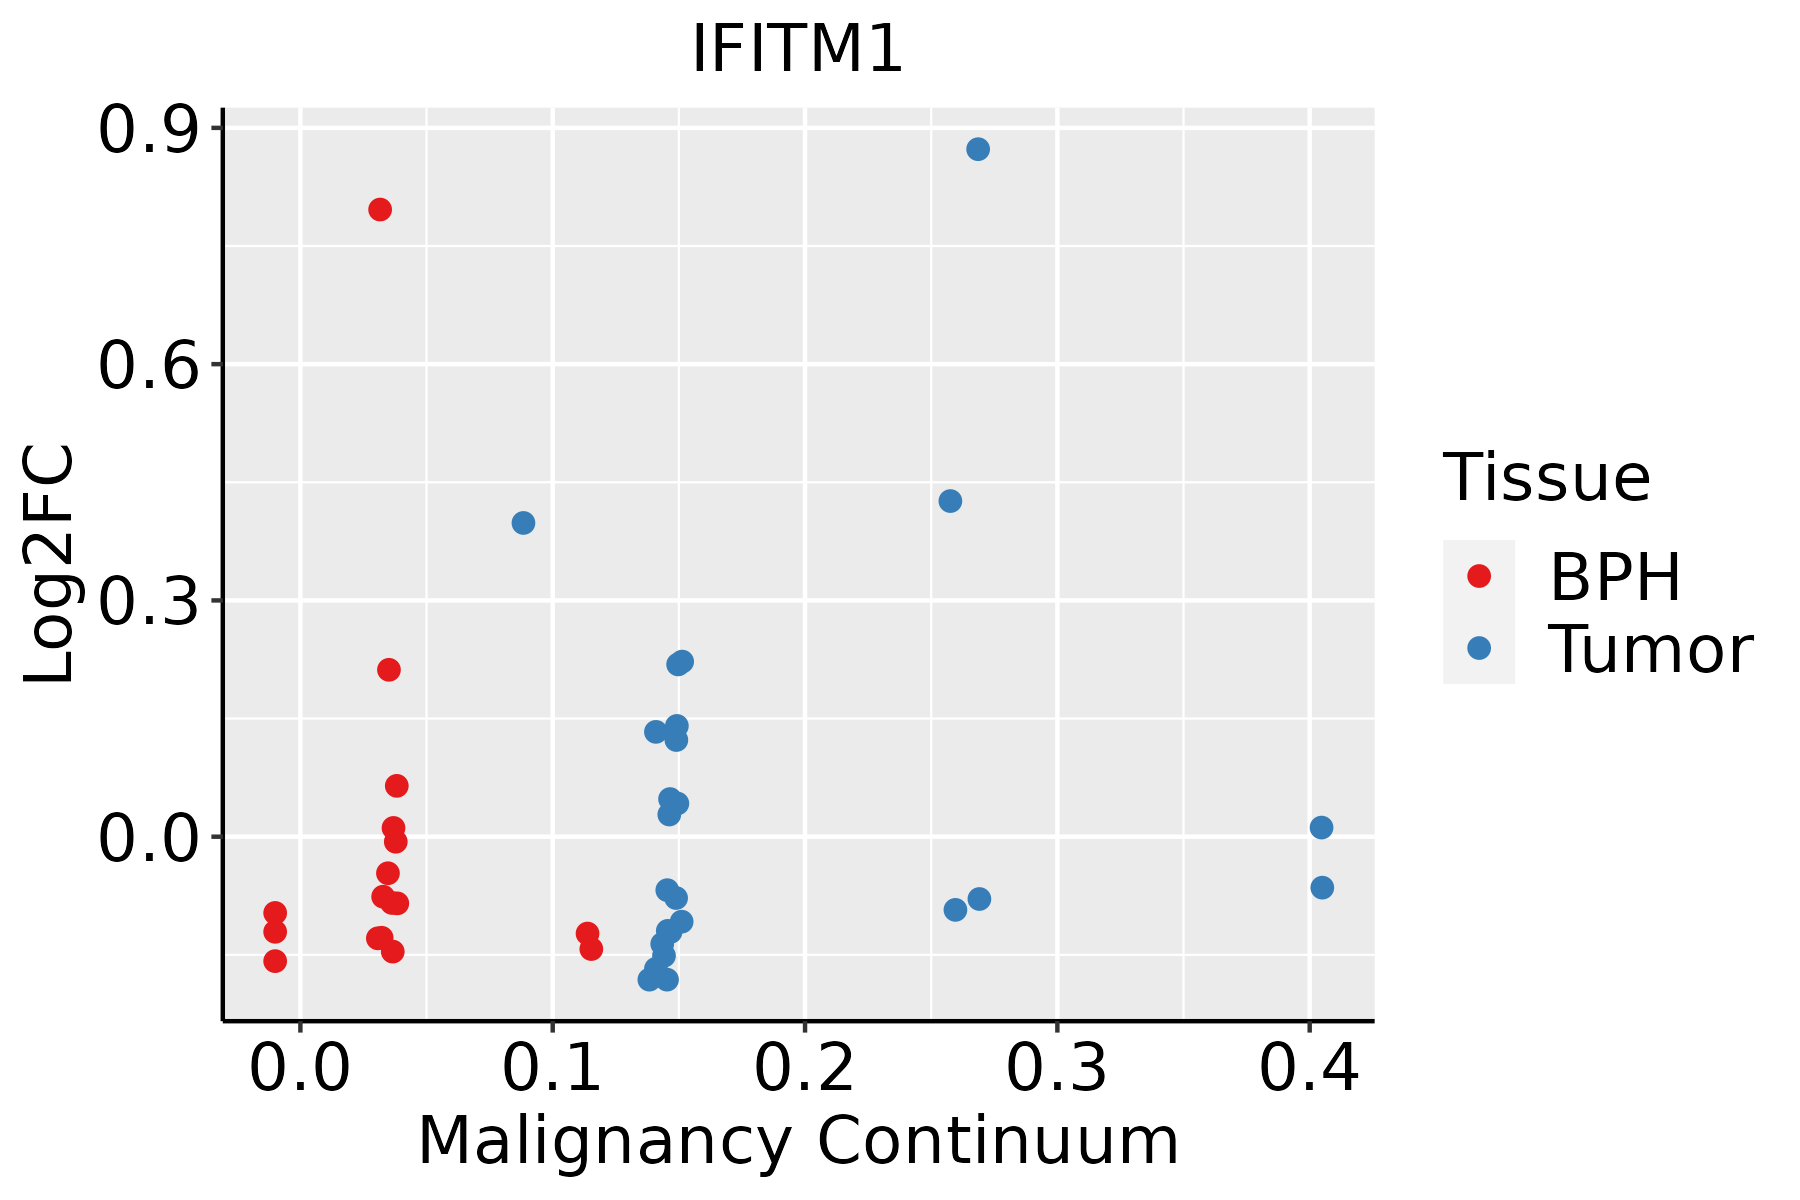 | BPH: Benign Prostatic Hyperplasia |
| Skin | 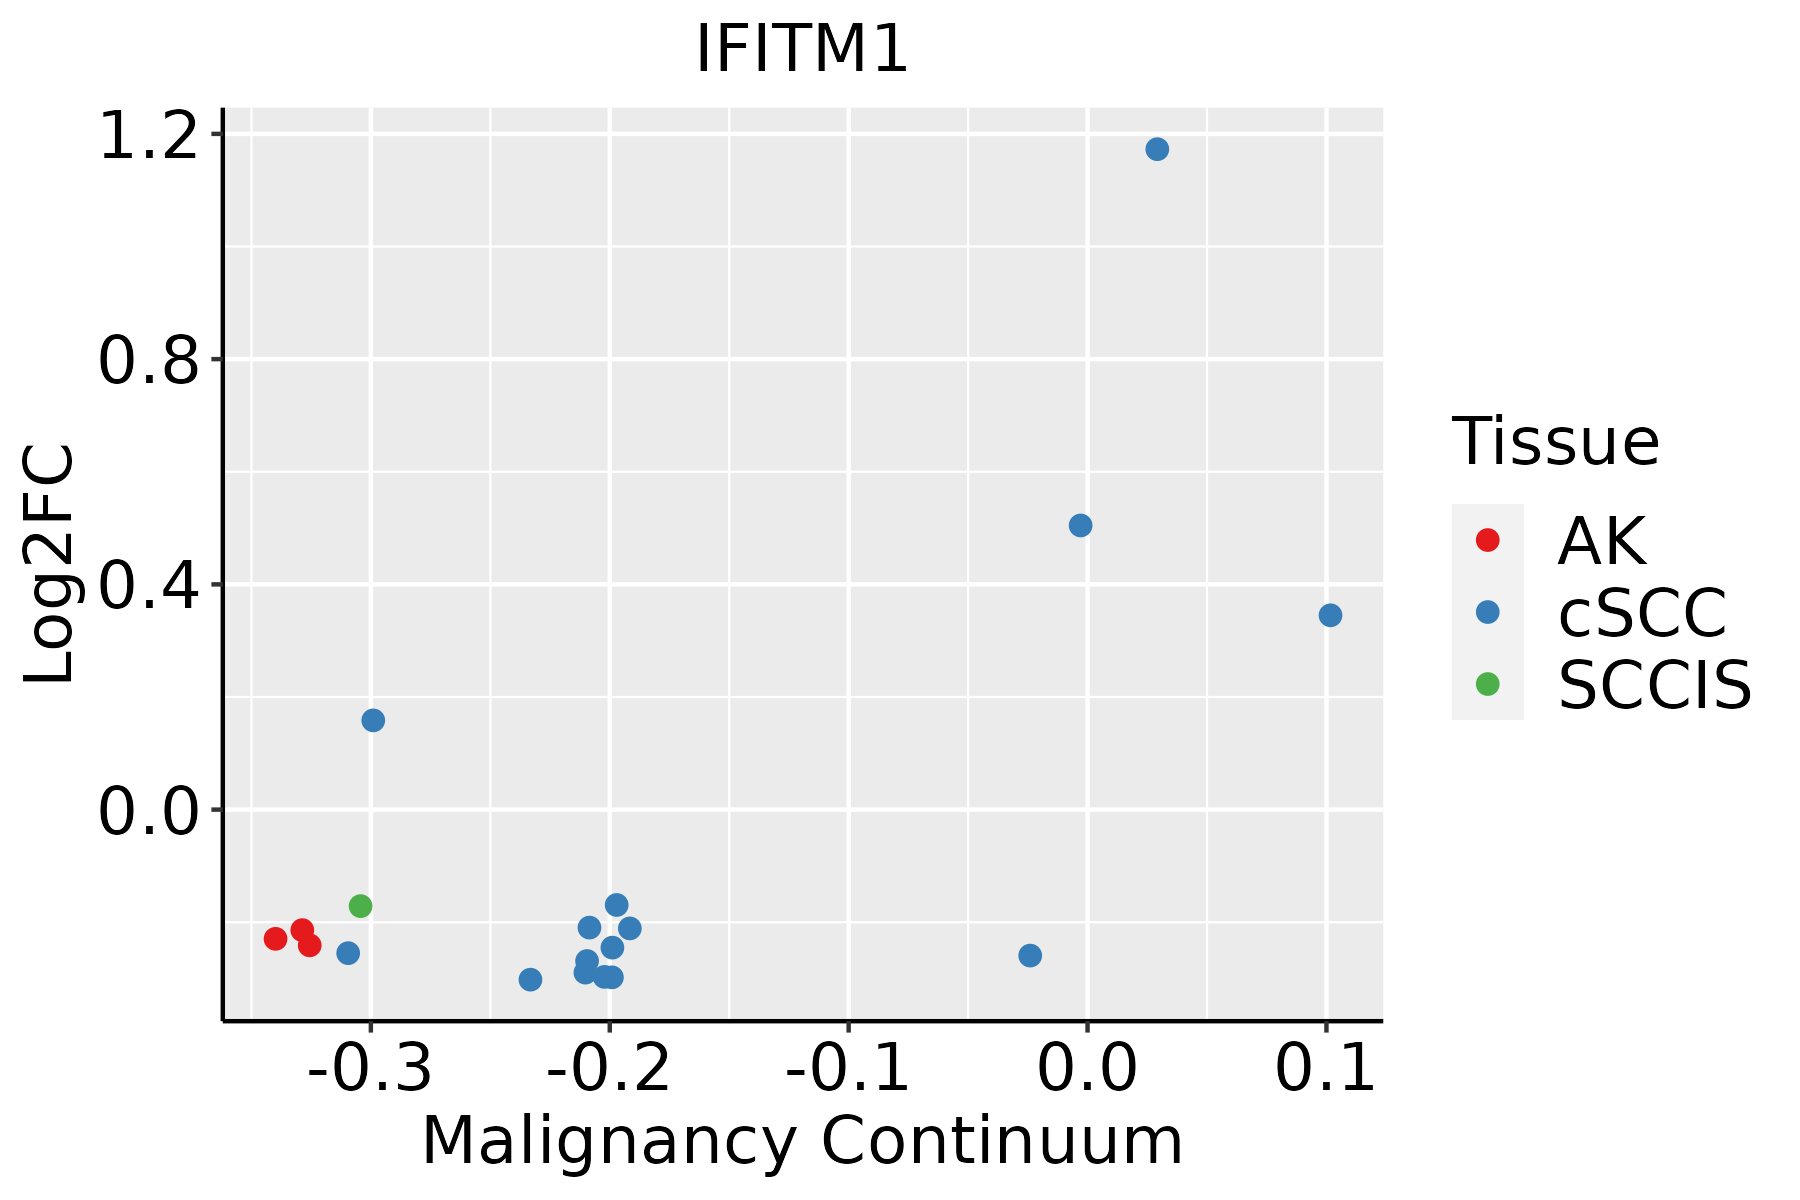 | AK: Actinic keratosis |
| cSCC: Cutaneous squamous cell carcinoma | ||
| SCCIS:squamous cell carcinoma in situ | ||
| Thyroid | 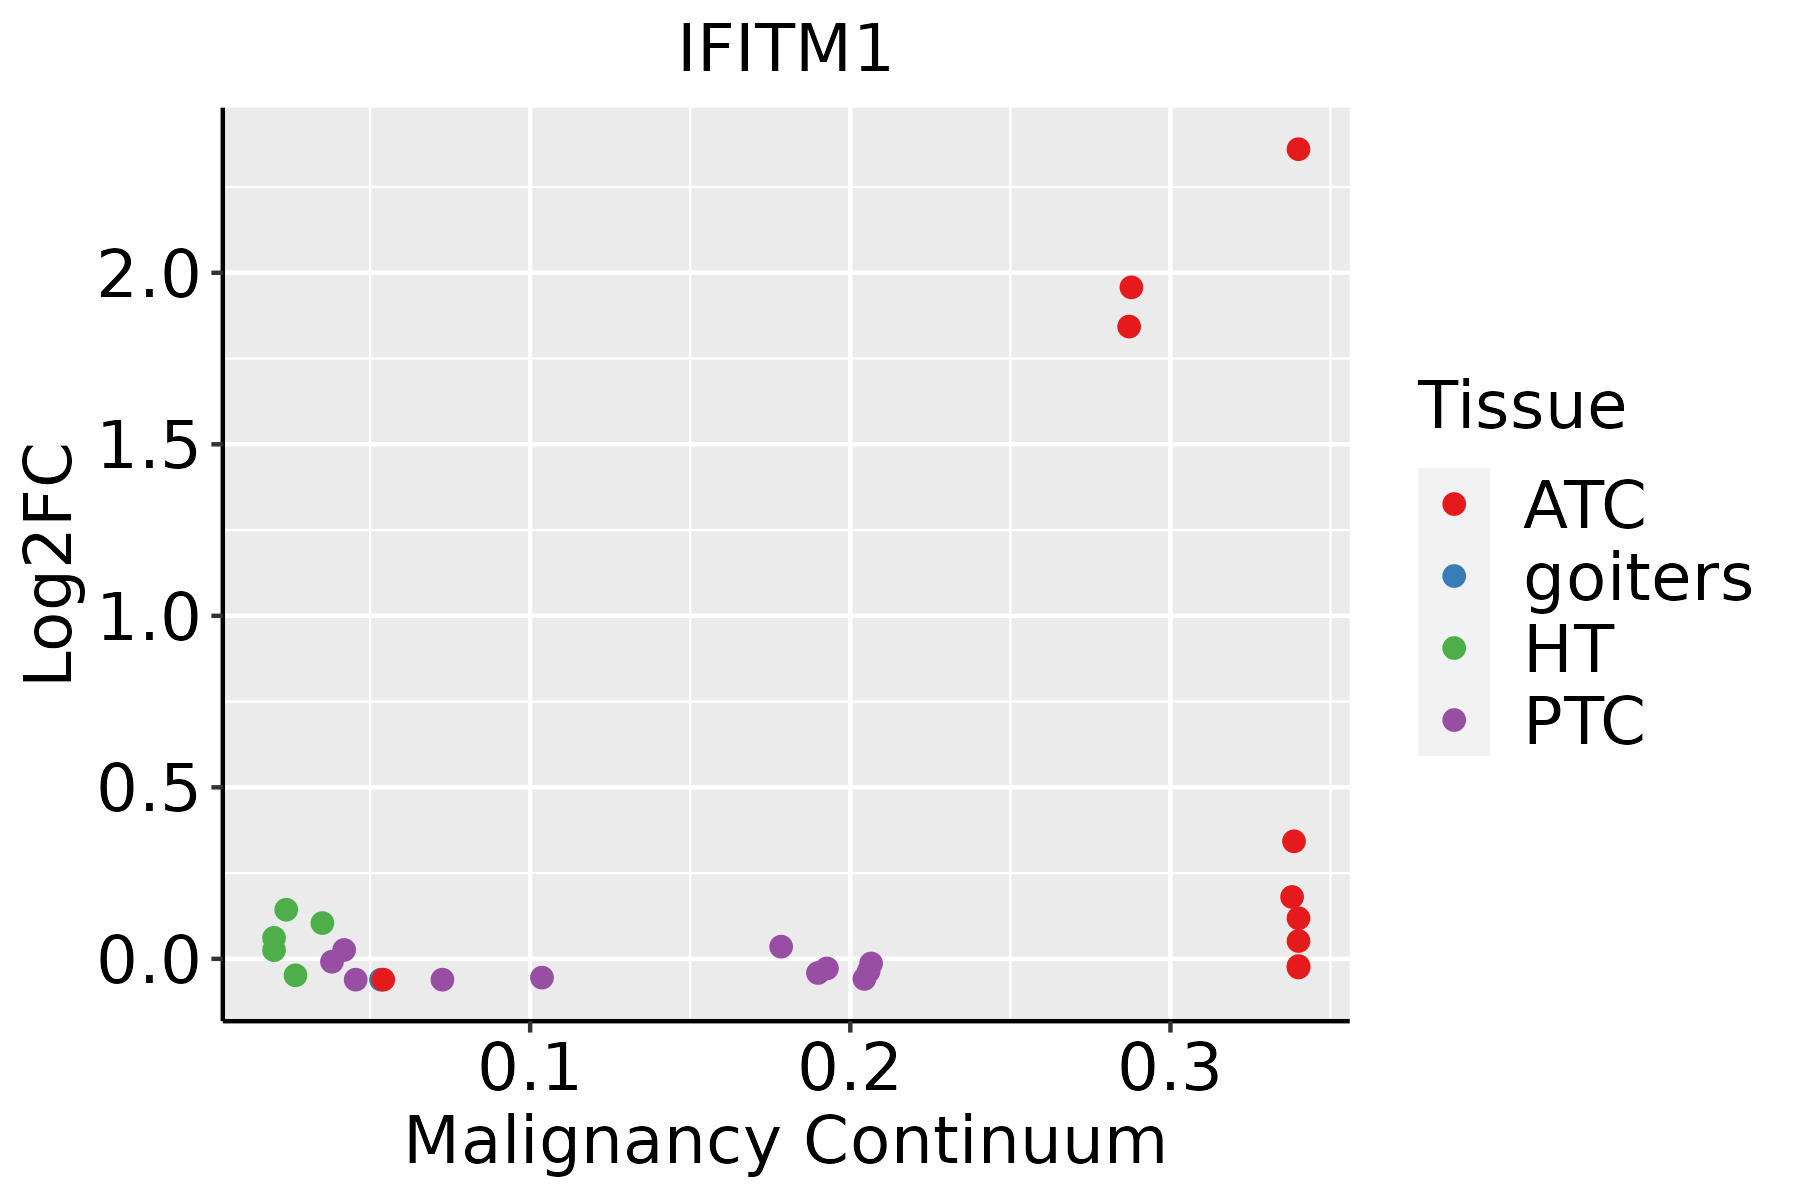 | ATC: Anaplastic thyroid cancer |
| HT: Hashimoto's thyroiditis | ||
| PTC: Papillary thyroid cancer |
| ∗log2FC in expression of this searched gene in stem-like cells from each diseased tissue sample relative to stem-like cells in normal samples in each tissue plotted against the malignancy continuum. Samples are colored based on if they are from different disease stage. |
Top |
Malignant transformation related pathway analysis |
| Find out the enriched GO biological processes and KEGG pathways involved in transition from healthy to precancer to cancer |
| Tissue | Disease Stage | Enriched GO biological Processes |
| Colorectum | AD |  |
| Colorectum | SER |  |
| Colorectum | MSS |  |
| Colorectum | MSI-H |  |
| Colorectum | FAP |  |
| ∗Top 15 enriched GO BP terms are showed in the bar plot of each disease state in each tissue. Each row represents a significant GO biological process which is colored according to the -log10(p.adjust). |
| Page: 1 2 3 4 5 6 7 8 9 |
| GO ID | Tissue | Disease Stage | Description | Gene Ratio | Bg Ratio | pvalue | p.adjust | Count |
| GO:00160329 | Breast | Precancer | viral process | 58/1080 | 415/18723 | 3.42e-10 | 3.16e-08 | 58 |
| GO:00190589 | Breast | Precancer | viral life cycle | 47/1080 | 317/18723 | 2.42e-09 | 1.99e-07 | 47 |
| GO:00444039 | Breast | Precancer | biological process involved in symbiotic interaction | 42/1080 | 290/18723 | 3.40e-08 | 2.11e-06 | 42 |
| GO:00521269 | Breast | Precancer | movement in host environment | 29/1080 | 175/18723 | 2.59e-07 | 1.28e-05 | 29 |
| GO:00517019 | Breast | Precancer | biological process involved in interaction with host | 31/1080 | 203/18723 | 6.52e-07 | 2.71e-05 | 31 |
| GO:00507929 | Breast | Precancer | regulation of viral process | 27/1080 | 164/18723 | 7.59e-07 | 3.05e-05 | 27 |
| GO:00444099 | Breast | Precancer | entry into host | 25/1080 | 151/18723 | 1.74e-06 | 6.19e-05 | 25 |
| GO:00467189 | Breast | Precancer | viral entry into host cell | 24/1080 | 144/18723 | 2.46e-06 | 8.35e-05 | 24 |
| GO:00190799 | Breast | Precancer | viral genome replication | 22/1080 | 131/18723 | 5.63e-06 | 1.66e-04 | 22 |
| GO:00439039 | Breast | Precancer | regulation of biological process involved in symbiotic interaction | 15/1080 | 72/18723 | 1.23e-05 | 3.17e-04 | 15 |
| GO:19039009 | Breast | Precancer | regulation of viral life cycle | 23/1080 | 148/18723 | 1.31e-05 | 3.30e-04 | 23 |
| GO:00523727 | Breast | Precancer | modulation by symbiont of entry into host | 12/1080 | 49/18723 | 1.61e-05 | 3.93e-04 | 12 |
| GO:00465964 | Breast | Precancer | regulation of viral entry into host cell | 11/1080 | 42/18723 | 1.83e-05 | 4.35e-04 | 11 |
| GO:00016496 | Breast | Precancer | osteoblast differentiation | 27/1080 | 229/18723 | 3.35e-04 | 4.73e-03 | 27 |
| GO:19039014 | Breast | Precancer | negative regulation of viral life cycle | 7/1080 | 25/18723 | 4.00e-04 | 5.42e-03 | 7 |
| GO:0046597 | Breast | Precancer | negative regulation of viral entry into host cell | 6/1080 | 21/18723 | 9.31e-04 | 1.06e-02 | 6 |
| GO:00450697 | Breast | Precancer | regulation of viral genome replication | 13/1080 | 85/18723 | 1.12e-03 | 1.23e-02 | 13 |
| GO:00485255 | Breast | Precancer | negative regulation of viral process | 12/1080 | 92/18723 | 6.51e-03 | 4.51e-02 | 12 |
| GO:00015036 | Breast | Precancer | ossification | 36/1080 | 408/18723 | 7.53e-03 | 4.98e-02 | 36 |
| GO:001603214 | Breast | IDC | viral process | 75/1434 | 415/18723 | 1.98e-12 | 4.02e-10 | 75 |
| Page: 1 2 3 4 5 6 7 8 9 10 11 12 13 14 15 16 17 18 19 20 21 22 |
| Pathway ID | Tissue | Disease Stage | Description | Gene Ratio | Bg Ratio | pvalue | p.adjust | qvalue | Count |
| hsa04662 | Oral cavity | OSCC | B cell receptor signaling pathway | 48/3704 | 84/8465 | 9.02e-03 | 2.01e-02 | 1.03e-02 | 48 |
| hsa046621 | Oral cavity | OSCC | B cell receptor signaling pathway | 48/3704 | 84/8465 | 9.02e-03 | 2.01e-02 | 1.03e-02 | 48 |
| hsa046622 | Oral cavity | EOLP | B cell receptor signaling pathway | 29/1218 | 84/8465 | 2.75e-06 | 2.11e-05 | 1.25e-05 | 29 |
| hsa046623 | Oral cavity | EOLP | B cell receptor signaling pathway | 29/1218 | 84/8465 | 2.75e-06 | 2.11e-05 | 1.25e-05 | 29 |
| hsa046624 | Oral cavity | NEOLP | B cell receptor signaling pathway | 19/1112 | 84/8465 | 1.13e-02 | 3.72e-02 | 2.34e-02 | 19 |
| hsa046625 | Oral cavity | NEOLP | B cell receptor signaling pathway | 19/1112 | 84/8465 | 1.13e-02 | 3.72e-02 | 2.34e-02 | 19 |
| Page: 1 |
Top |
Cell-cell communication analysis |
| Identification of potential cell-cell interactions between two cell types and their ligand-receptor pairs for different disease states |
| Ligand | Receptor | LRpair | Pathway | Tissue | Disease Stage |
| Page: 1 |
Top |
Single-cell gene regulatory network inference analysis |
| Find out the significant the regulons (TFs) and the target genes of each regulon across cell types for different disease states |
| TF | Cell Type | Tissue | Disease Stage | Target Gene | RSS | Regulon Activity |
| ∗The dot plots of a searched regulon are shown for all cell subpopulations in each disease state of each tissue based on the regulon specific score inferred using pySCENIC and by calculating the average expression. |
| Page: 1 |
Top |
Somatic mutation of malignant transformation related genes |
| Annotation of somatic variants for genes involved in malignant transformation |
| Hugo Symbol | Variant Class | Variant Classification | dbSNP RS | HGVSc | HGVSp | HGVSp Short | SWISSPROT | BIOTYPE | SIFT | PolyPhen | Tumor Sample Barcode | Tissue | Histology | Sex | Age | Stage | Therapy Types | Drugs | Outcome |
| IFITM1 | SNV | Missense_Mutation | c.26N>G | p.Ala9Gly | p.A9G | P13164 | protein_coding | tolerated(0.17) | benign(0.14) | TCGA-AA-3821-01 | Colorectum | colon adenocarcinoma | Female | >=65 | I/II | Unknown | Unknown | SD | |
| IFITM1 | SNV | Missense_Mutation | c.59N>T | p.Pro20Leu | p.P20L | P13164 | protein_coding | tolerated(0.42) | benign(0.02) | TCGA-CM-6171-01 | Colorectum | colon adenocarcinoma | Female | >=65 | I/II | Unknown | Unknown | SD | |
| IFITM1 | deletion | Frame_Shift_Del | c.45delC | p.Ser16AlafsTer9 | p.S16Afs*9 | P13164 | protein_coding | TCGA-D5-6530-01 | Colorectum | colon adenocarcinoma | Male | <65 | I/II | Unknown | Unknown | SD | |||
| IFITM1 | SNV | Missense_Mutation | novel | c.23N>C | p.Val8Ala | p.V8A | P13164 | protein_coding | tolerated(0.06) | benign(0.259) | TCGA-A5-A1OF-01 | Endometrium | uterine corpus endometrioid carcinoma | Female | <65 | I/II | Unknown | Unknown | SD |
| IFITM1 | SNV | Missense_Mutation | rs758516594 | c.52N>G | p.Ile18Val | p.I18V | P13164 | protein_coding | tolerated(0.16) | benign(0.001) | TCGA-BG-A222-01 | Endometrium | uterine corpus endometrioid carcinoma | Female | <65 | I/II | Unknown | Unknown | SD |
| IFITM1 | SNV | Missense_Mutation | rs372454990 | c.319G>A | p.Gly107Ser | p.G107S | P13164 | protein_coding | tolerated(0.2) | benign(0.013) | TCGA-FI-A2D0-01 | Endometrium | uterine corpus endometrioid carcinoma | Female | <65 | I/II | Unknown | Unknown | SD |
| IFITM1 | deletion | In_Frame_Del | novel | c.31_48delNNNNNNNNNNNNNNNNNN | p.Leu11_Ser16del | p.L11_S16del | P13164 | protein_coding | TCGA-ES-A2HS-01 | Liver | liver hepatocellular carcinoma | Male | >=65 | I/II | Unknown | Unknown | SD | ||
| IFITM1 | SNV | Missense_Mutation | novel | c.119C>A | p.Ser40Tyr | p.S40Y | P13164 | protein_coding | deleterious(0) | probably_damaging(0.992) | TCGA-43-2576-01 | Lung | lung squamous cell carcinoma | Female | <65 | III/IV | Chemotherapy | cisplatin | SD |
| IFITM1 | SNV | Missense_Mutation | c.10G>A | p.Glu4Lys | p.E4K | P13164 | protein_coding | deleterious(0.02) | benign(0.178) | TCGA-66-2757-01 | Lung | lung squamous cell carcinoma | Female | >=65 | I/II | Chemotherapy | gemcitabine | PD | |
| IFITM1 | SNV | Missense_Mutation | novel | c.197N>A | p.Arg66Lys | p.R66K | P13164 | protein_coding | deleterious(0.02) | benign(0.364) | TCGA-BR-6452-01 | Stomach | stomach adenocarcinoma | Female | >=65 | I/II | Unknown | Unknown | SD |
| Page: 1 2 |
Top |
Related drugs of malignant transformation related genes |
| Identification of chemicals and drugs interact with genes involved in malignant transfromation |
| (DGIdb 4.0) |
| Entrez ID | Symbol | Category | Interaction Types | Drug Claim Name | Drug Name | PMIDs |
| Page: 1 |

Copyright 2023-Present -The University of Texas Health Science Center at Houston |