
|
|||||
|
 | |
| |
| |
| |
| |
| |
|
Gene: IFIT2 |
Gene summary for IFIT2 |
| Gene information | Species | Human | Gene symbol | IFIT2 | Gene ID | 3433 |
| Gene name | interferon induced protein with tetratricopeptide repeats 2 | |
| Gene Alias | G10P2 | |
| Cytomap | 10q23.31 | |
| Gene Type | protein-coding | GO ID | GO:0002376 | UniProtAcc | P09913 |
Top |
Malignant transformation analysis |
| Identification of the aberrant gene expression in precancerous and cancerous lesions by comparing the gene expression of stem-like cells in diseased tissues with normal stem cells |
| Entrez ID | Symbol | Replicates | Species | Organ | Tissue | Adj P-value | Log2FC | Malignancy |
| 3433 | IFIT2 | LZE24T | Human | Esophagus | ESCC | 4.05e-14 | 1.45e+00 | 0.0596 |
| 3433 | IFIT2 | LZE6T | Human | Esophagus | ESCC | 1.01e-02 | 3.24e-01 | 0.0845 |
| 3433 | IFIT2 | P2T-E | Human | Esophagus | ESCC | 2.10e-06 | 5.54e-01 | 0.1177 |
| 3433 | IFIT2 | P8T-E | Human | Esophagus | ESCC | 3.25e-09 | 8.04e-01 | 0.0889 |
| 3433 | IFIT2 | P9T-E | Human | Esophagus | ESCC | 2.11e-08 | 6.29e-01 | 0.1131 |
| 3433 | IFIT2 | P11T-E | Human | Esophagus | ESCC | 3.04e-05 | 7.71e-01 | 0.1426 |
| 3433 | IFIT2 | P17T-E | Human | Esophagus | ESCC | 1.74e-03 | 7.43e-01 | 0.1278 |
| 3433 | IFIT2 | P20T-E | Human | Esophagus | ESCC | 1.54e-04 | 1.66e+00 | 0.1124 |
| 3433 | IFIT2 | P21T-E | Human | Esophagus | ESCC | 2.56e-02 | 7.58e-01 | 0.1617 |
| 3433 | IFIT2 | P24T-E | Human | Esophagus | ESCC | 1.61e-09 | 8.29e-01 | 0.1287 |
| 3433 | IFIT2 | P27T-E | Human | Esophagus | ESCC | 1.03e-04 | 3.13e-01 | 0.1055 |
| 3433 | IFIT2 | P28T-E | Human | Esophagus | ESCC | 8.33e-11 | 9.40e-01 | 0.1149 |
| 3433 | IFIT2 | P31T-E | Human | Esophagus | ESCC | 6.90e-22 | 1.15e+00 | 0.1251 |
| 3433 | IFIT2 | P36T-E | Human | Esophagus | ESCC | 2.77e-02 | 1.42e-01 | 0.1187 |
| 3433 | IFIT2 | P40T-E | Human | Esophagus | ESCC | 1.49e-07 | 8.07e-01 | 0.109 |
| 3433 | IFIT2 | P52T-E | Human | Esophagus | ESCC | 2.36e-09 | 1.58e+00 | 0.1555 |
| 3433 | IFIT2 | P56T-E | Human | Esophagus | ESCC | 4.66e-03 | 7.52e-01 | 0.1613 |
| 3433 | IFIT2 | P61T-E | Human | Esophagus | ESCC | 2.55e-07 | 2.59e-01 | 0.099 |
| 3433 | IFIT2 | P62T-E | Human | Esophagus | ESCC | 1.39e-07 | 6.30e-01 | 0.1302 |
| 3433 | IFIT2 | P74T-E | Human | Esophagus | ESCC | 3.46e-02 | 1.02e-01 | 0.1479 |
| Page: 1 2 3 |
| Tissue | Expression Dynamics | Abbreviation |
| Esophagus | 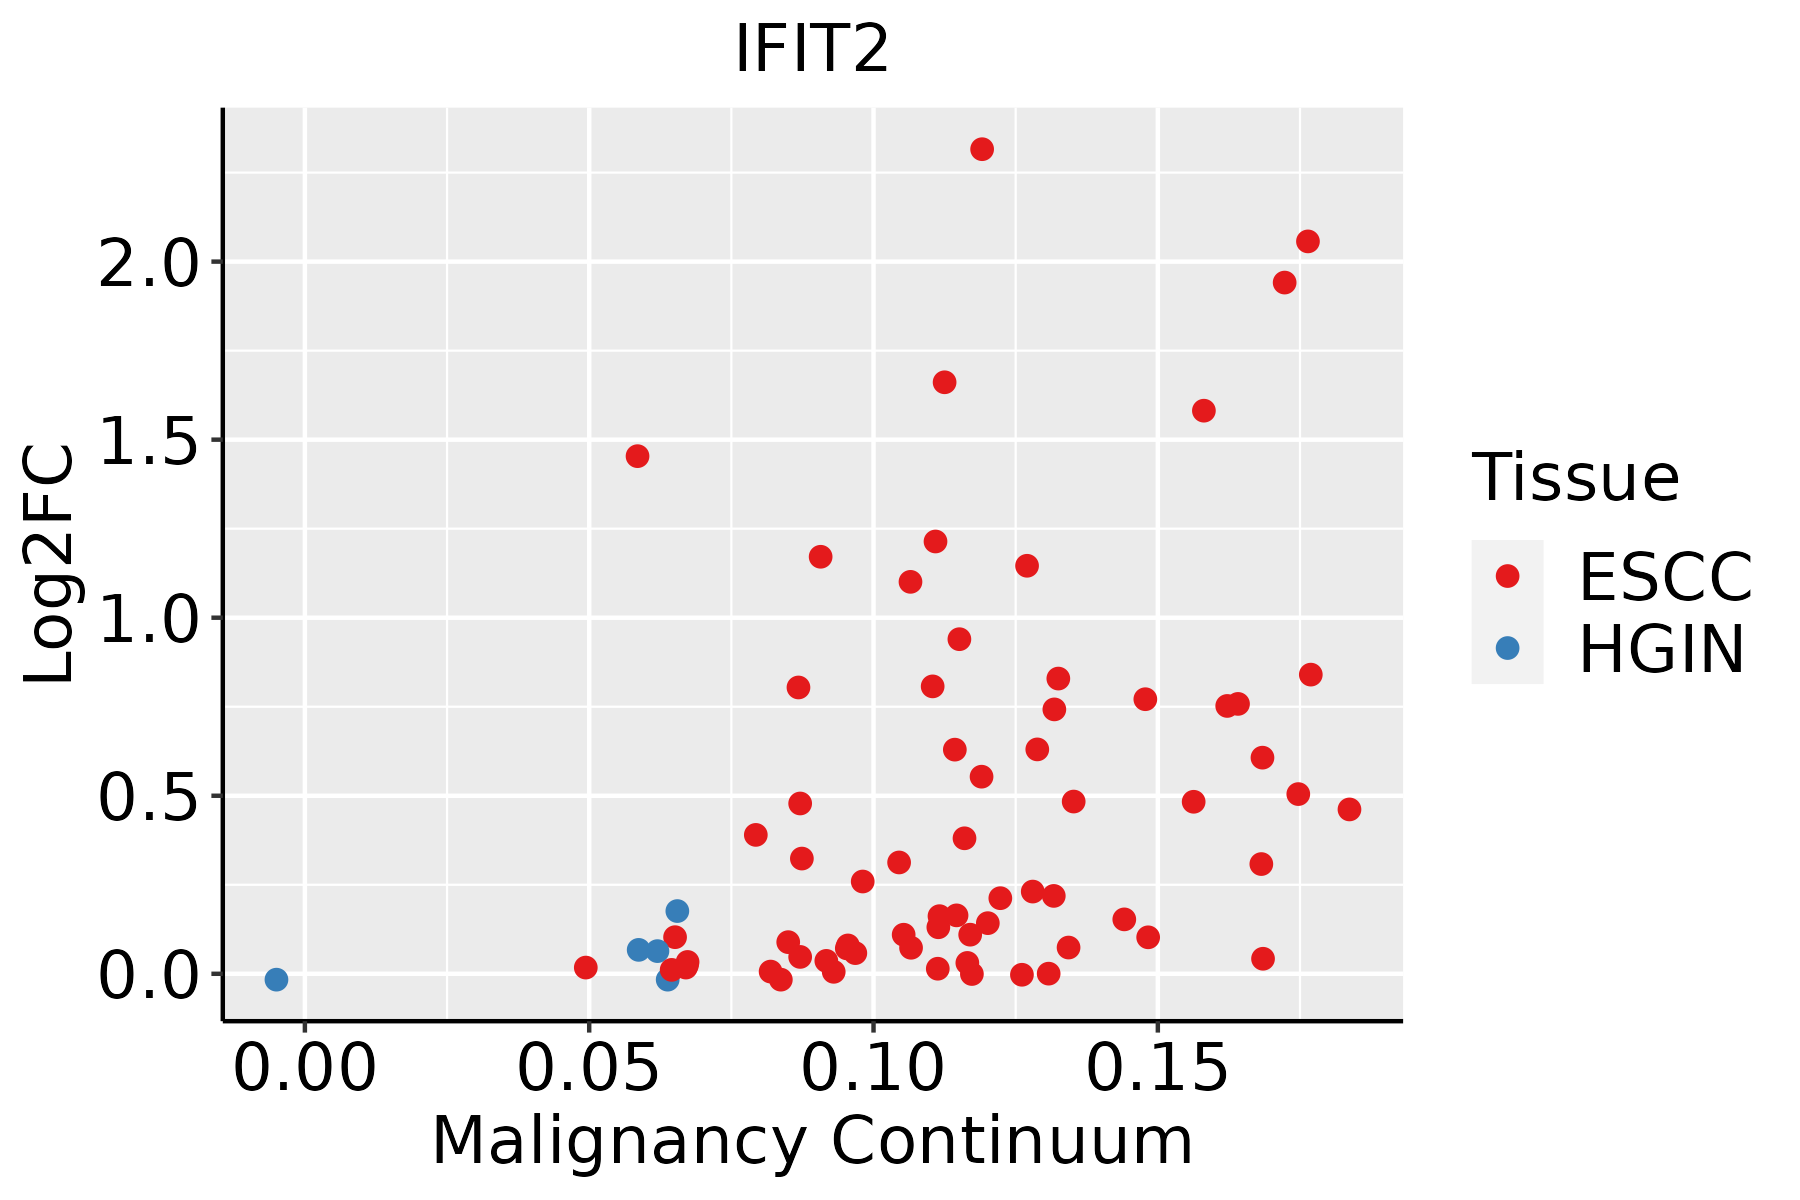 | ESCC: Esophageal squamous cell carcinoma |
| HGIN: High-grade intraepithelial neoplasias | ||
| LGIN: Low-grade intraepithelial neoplasias | ||
| Liver | 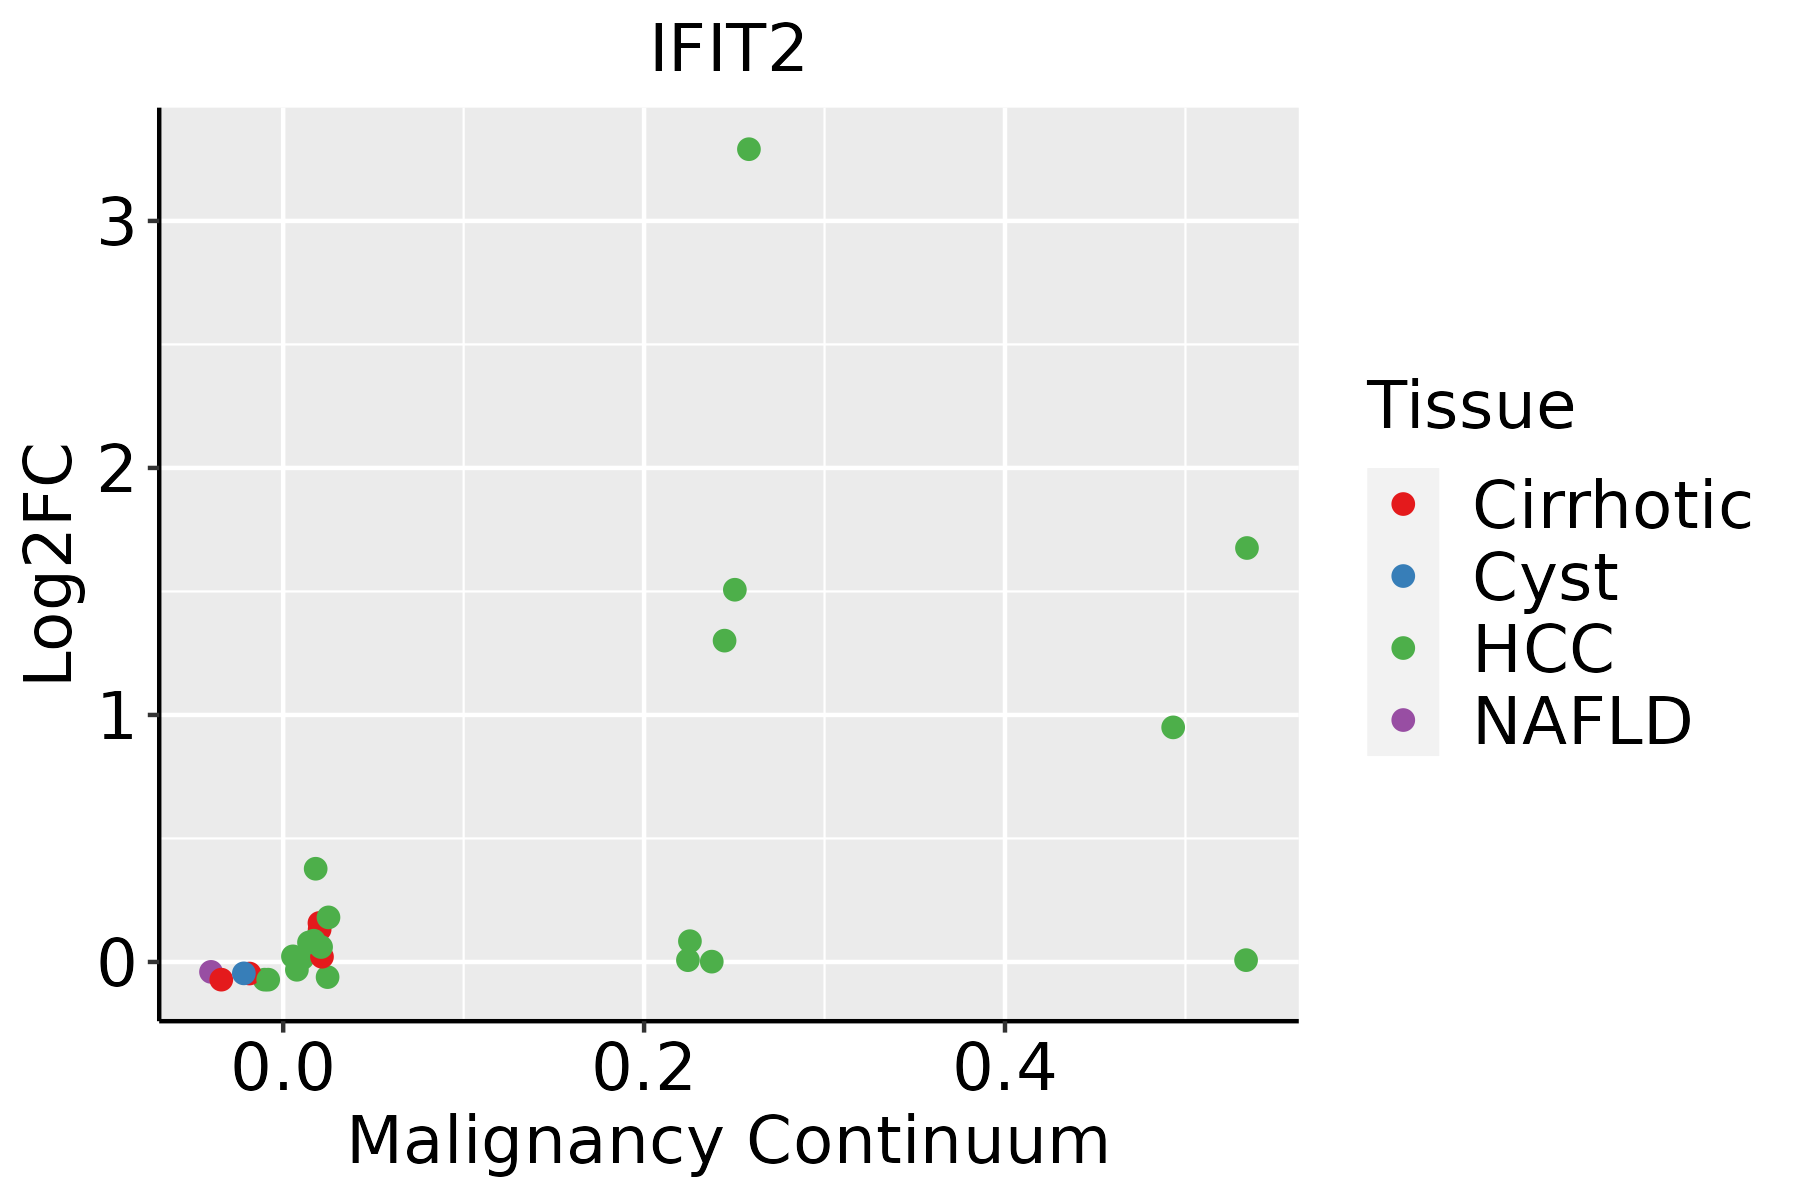 | HCC: Hepatocellular carcinoma |
| NAFLD: Non-alcoholic fatty liver disease | ||
| Oral Cavity |  | EOLP: Erosive Oral lichen planus |
| LP: leukoplakia | ||
| NEOLP: Non-erosive oral lichen planus | ||
| OSCC: Oral squamous cell carcinoma | ||
| Skin |  | AK: Actinic keratosis |
| cSCC: Cutaneous squamous cell carcinoma | ||
| SCCIS:squamous cell carcinoma in situ | ||
| Thyroid |  | ATC: Anaplastic thyroid cancer |
| HT: Hashimoto's thyroiditis | ||
| PTC: Papillary thyroid cancer |
| ∗log2FC in expression of this searched gene in stem-like cells from each diseased tissue sample relative to stem-like cells in normal samples in each tissue plotted against the malignancy continuum. Samples are colored based on if they are from different disease stage. |
Top |
Malignant transformation related pathway analysis |
| Find out the enriched GO biological processes and KEGG pathways involved in transition from healthy to precancer to cancer |
| Tissue | Disease Stage | Enriched GO biological Processes |
| Colorectum | AD |  |
| Colorectum | SER |  |
| Colorectum | MSS |  |
| Colorectum | MSI-H |  |
| Colorectum | FAP |  |
| ∗Top 15 enriched GO BP terms are showed in the bar plot of each disease state in each tissue. Each row represents a significant GO biological process which is colored according to the -log10(p.adjust). |
| Page: 1 2 3 4 5 6 7 8 9 |
| GO ID | Tissue | Disease Stage | Description | Gene Ratio | Bg Ratio | pvalue | p.adjust | Count |
| GO:0051098111 | Esophagus | ESCC | regulation of binding | 251/8552 | 363/18723 | 6.73e-20 | 8.46e-18 | 251 |
| GO:000961518 | Esophagus | ESCC | response to virus | 238/8552 | 367/18723 | 6.65e-14 | 3.32e-12 | 238 |
| GO:0008637110 | Esophagus | ESCC | apoptotic mitochondrial changes | 83/8552 | 107/18723 | 1.43e-11 | 5.08e-10 | 83 |
| GO:004339320 | Esophagus | ESCC | regulation of protein binding | 135/8552 | 196/18723 | 3.69e-11 | 1.22e-09 | 135 |
| GO:00516075 | Esophagus | ESCC | defense response to virus | 171/8552 | 265/18723 | 3.91e-10 | 1.05e-08 | 171 |
| GO:01405465 | Esophagus | ESCC | defense response to symbiont | 171/8552 | 265/18723 | 3.91e-10 | 1.05e-08 | 171 |
| GO:0051100111 | Esophagus | ESCC | negative regulation of binding | 109/8552 | 162/18723 | 2.10e-08 | 4.03e-07 | 109 |
| GO:003209116 | Esophagus | ESCC | negative regulation of protein binding | 65/8552 | 94/18723 | 3.46e-06 | 3.82e-05 | 65 |
| GO:00354555 | Esophagus | ESCC | response to interferon-alpha | 17/8552 | 21/18723 | 1.03e-03 | 5.19e-03 | 17 |
| GO:005109812 | Liver | Cirrhotic | regulation of binding | 148/4634 | 363/18723 | 9.14e-12 | 5.97e-10 | 148 |
| GO:004339312 | Liver | Cirrhotic | regulation of protein binding | 83/4634 | 196/18723 | 4.44e-08 | 1.42e-06 | 83 |
| GO:00086377 | Liver | Cirrhotic | apoptotic mitochondrial changes | 47/4634 | 107/18723 | 1.10e-05 | 1.57e-04 | 47 |
| GO:00096155 | Liver | Cirrhotic | response to virus | 126/4634 | 367/18723 | 2.10e-05 | 2.77e-04 | 126 |
| GO:00511006 | Liver | Cirrhotic | negative regulation of binding | 63/4634 | 162/18723 | 4.54e-05 | 5.31e-04 | 63 |
| GO:00320914 | Liver | Cirrhotic | negative regulation of protein binding | 40/4634 | 94/18723 | 1.14e-04 | 1.14e-03 | 40 |
| GO:0035455 | Liver | Cirrhotic | response to interferon-alpha | 11/4634 | 21/18723 | 5.89e-03 | 2.95e-02 | 11 |
| GO:0051607 | Liver | Cirrhotic | defense response to virus | 84/4634 | 265/18723 | 6.02e-03 | 3.00e-02 | 84 |
| GO:0140546 | Liver | Cirrhotic | defense response to symbiont | 84/4634 | 265/18723 | 6.02e-03 | 3.00e-02 | 84 |
| GO:005109822 | Liver | HCC | regulation of binding | 225/7958 | 363/18723 | 3.78e-14 | 2.37e-12 | 225 |
| GO:004339322 | Liver | HCC | regulation of protein binding | 129/7958 | 196/18723 | 3.27e-11 | 1.26e-09 | 129 |
| Page: 1 2 3 4 |
| Pathway ID | Tissue | Disease Stage | Description | Gene Ratio | Bg Ratio | pvalue | p.adjust | qvalue | Count |
| Page: 1 |
Top |
Cell-cell communication analysis |
| Identification of potential cell-cell interactions between two cell types and their ligand-receptor pairs for different disease states |
| Ligand | Receptor | LRpair | Pathway | Tissue | Disease Stage |
| Page: 1 |
Top |
Single-cell gene regulatory network inference analysis |
| Find out the significant the regulons (TFs) and the target genes of each regulon across cell types for different disease states |
| TF | Cell Type | Tissue | Disease Stage | Target Gene | RSS | Regulon Activity |
| ∗The dot plots of a searched regulon are shown for all cell subpopulations in each disease state of each tissue based on the regulon specific score inferred using pySCENIC and by calculating the average expression. |
| Page: 1 |
Top |
Somatic mutation of malignant transformation related genes |
| Annotation of somatic variants for genes involved in malignant transformation |
| Hugo Symbol | Variant Class | Variant Classification | dbSNP RS | HGVSc | HGVSp | HGVSp Short | SWISSPROT | BIOTYPE | SIFT | PolyPhen | Tumor Sample Barcode | Tissue | Histology | Sex | Age | Stage | Therapy Types | Drugs | Outcome |
| IFIT2 | SNV | Missense_Mutation | c.586N>A | p.Asp196Asn | p.D196N | P09913 | protein_coding | tolerated(0.26) | benign(0.003) | TCGA-BH-A0DZ-01 | Breast | breast invasive carcinoma | Female | <65 | I/II | Chemotherapy | docetaxel | SD | |
| IFIT2 | SNV | Missense_Mutation | novel | c.1354G>C | p.Asp452His | p.D452H | P09913 | protein_coding | tolerated(0.58) | benign(0.293) | TCGA-LL-A73Y-01 | Breast | breast invasive carcinoma | Female | >=65 | I/II | Chemotherapy | taxotere | SD |
| IFIT2 | insertion | Frame_Shift_Ins | novel | c.289_290insG | p.Asn99LysfsTer27 | p.N99Kfs*27 | P09913 | protein_coding | TCGA-AC-A5XU-01 | Breast | breast invasive carcinoma | Female | >=65 | I/II | Hormone Therapy | letrozole | SD | ||
| IFIT2 | insertion | Nonsense_Mutation | novel | c.557_558insTTAACTCTT | p.Asp186_Asn187insTer | p.D186_N187ins* | P09913 | protein_coding | TCGA-AR-A0U0-01 | Breast | breast invasive carcinoma | Female | >=65 | I/II | Unknown | Unknown | SD | ||
| IFIT2 | SNV | Missense_Mutation | c.730N>T | p.Pro244Ser | p.P244S | P09913 | protein_coding | tolerated(0.22) | possibly_damaging(0.514) | TCGA-EK-A2RO-01 | Cervix | cervical & endocervical cancer | Female | <65 | I/II | Unknown | Unknown | SD | |
| IFIT2 | SNV | Missense_Mutation | c.1213N>G | p.Ser405Ala | p.S405A | P09913 | protein_coding | deleterious(0.03) | benign(0.192) | TCGA-FU-A3HZ-01 | Cervix | cervical & endocervical cancer | Female | <65 | I/II | Chemotherapy | cisplatin | CR | |
| IFIT2 | SNV | Missense_Mutation | novel | c.1250N>C | p.Lys417Thr | p.K417T | P09913 | protein_coding | deleterious(0.04) | benign(0.015) | TCGA-AA-3984-01 | Colorectum | colon adenocarcinoma | Female | <65 | I/II | Unknown | Unknown | SD |
| IFIT2 | SNV | Missense_Mutation | c.901C>G | p.Leu301Val | p.L301V | P09913 | protein_coding | tolerated(0.27) | benign(0) | TCGA-AY-A8YK-01 | Colorectum | colon adenocarcinoma | Male | <65 | I/II | Chemotherapy | 5-fu | CR | |
| IFIT2 | SNV | Missense_Mutation | c.199N>C | p.Asn67His | p.N67H | P09913 | protein_coding | tolerated(0.14) | benign(0.037) | TCGA-CA-6717-01 | Colorectum | colon adenocarcinoma | Male | <65 | I/II | Chemotherapy | oxaliplatin | CR | |
| IFIT2 | SNV | Missense_Mutation | rs537050168 | c.751N>T | p.Arg251Cys | p.R251C | P09913 | protein_coding | tolerated(0.16) | benign(0.019) | TCGA-CA-6718-01 | Colorectum | colon adenocarcinoma | Male | <65 | I/II | Unknown | Unknown | PD |
| Page: 1 2 3 4 5 6 7 8 |
Top |
Related drugs of malignant transformation related genes |
| Identification of chemicals and drugs interact with genes involved in malignant transfromation |
| (DGIdb 4.0) |
| Entrez ID | Symbol | Category | Interaction Types | Drug Claim Name | Drug Name | PMIDs |
| 3433 | IFIT2 | CLINICALLY ACTIONABLE | IFN | 12433283 |
| Page: 1 |

Copyright 2023-Present -The University of Texas Health Science Center at Houston |