
|
|||||
|
 | |
| |
| |
| |
| |
| |
|
Gene: IFIH1 |
Gene summary for IFIH1 |
| Gene information | Species | Human | Gene symbol | IFIH1 | Gene ID | 64135 |
| Gene name | interferon induced with helicase C domain 1 | |
| Gene Alias | AGS7 | |
| Cytomap | 2q24.2 | |
| Gene Type | protein-coding | GO ID | GO:0001816 | UniProtAcc | Q9BYX4 |
Top |
Malignant transformation analysis |
| Identification of the aberrant gene expression in precancerous and cancerous lesions by comparing the gene expression of stem-like cells in diseased tissues with normal stem cells |
| Entrez ID | Symbol | Replicates | Species | Organ | Tissue | Adj P-value | Log2FC | Malignancy |
| 64135 | IFIH1 | LZE22T | Human | Esophagus | ESCC | 4.14e-02 | 1.89e-01 | 0.068 |
| 64135 | IFIH1 | LZE24T | Human | Esophagus | ESCC | 4.26e-21 | 6.80e-01 | 0.0596 |
| 64135 | IFIH1 | P1T-E | Human | Esophagus | ESCC | 3.81e-05 | 2.62e-01 | 0.0875 |
| 64135 | IFIH1 | P2T-E | Human | Esophagus | ESCC | 1.24e-36 | 7.11e-01 | 0.1177 |
| 64135 | IFIH1 | P4T-E | Human | Esophagus | ESCC | 2.82e-09 | 3.48e-01 | 0.1323 |
| 64135 | IFIH1 | P5T-E | Human | Esophagus | ESCC | 2.23e-06 | 1.35e-01 | 0.1327 |
| 64135 | IFIH1 | P8T-E | Human | Esophagus | ESCC | 2.39e-06 | 1.35e-01 | 0.0889 |
| 64135 | IFIH1 | P9T-E | Human | Esophagus | ESCC | 1.49e-18 | 4.40e-01 | 0.1131 |
| 64135 | IFIH1 | P11T-E | Human | Esophagus | ESCC | 1.30e-20 | 9.67e-01 | 0.1426 |
| 64135 | IFIH1 | P12T-E | Human | Esophagus | ESCC | 1.26e-08 | 2.16e-01 | 0.1122 |
| 64135 | IFIH1 | P15T-E | Human | Esophagus | ESCC | 1.05e-07 | 2.46e-01 | 0.1149 |
| 64135 | IFIH1 | P16T-E | Human | Esophagus | ESCC | 1.12e-07 | 1.46e-01 | 0.1153 |
| 64135 | IFIH1 | P17T-E | Human | Esophagus | ESCC | 5.00e-12 | 5.76e-01 | 0.1278 |
| 64135 | IFIH1 | P20T-E | Human | Esophagus | ESCC | 3.24e-13 | 5.79e-01 | 0.1124 |
| 64135 | IFIH1 | P21T-E | Human | Esophagus | ESCC | 1.58e-15 | 3.98e-01 | 0.1617 |
| 64135 | IFIH1 | P22T-E | Human | Esophagus | ESCC | 1.64e-03 | 8.18e-02 | 0.1236 |
| 64135 | IFIH1 | P23T-E | Human | Esophagus | ESCC | 1.11e-16 | 4.76e-01 | 0.108 |
| 64135 | IFIH1 | P24T-E | Human | Esophagus | ESCC | 1.31e-40 | 1.01e+00 | 0.1287 |
| 64135 | IFIH1 | P26T-E | Human | Esophagus | ESCC | 5.26e-10 | 2.07e-01 | 0.1276 |
| 64135 | IFIH1 | P27T-E | Human | Esophagus | ESCC | 1.52e-07 | 2.32e-01 | 0.1055 |
| Page: 1 2 3 4 5 |
| Tissue | Expression Dynamics | Abbreviation |
| Esophagus | 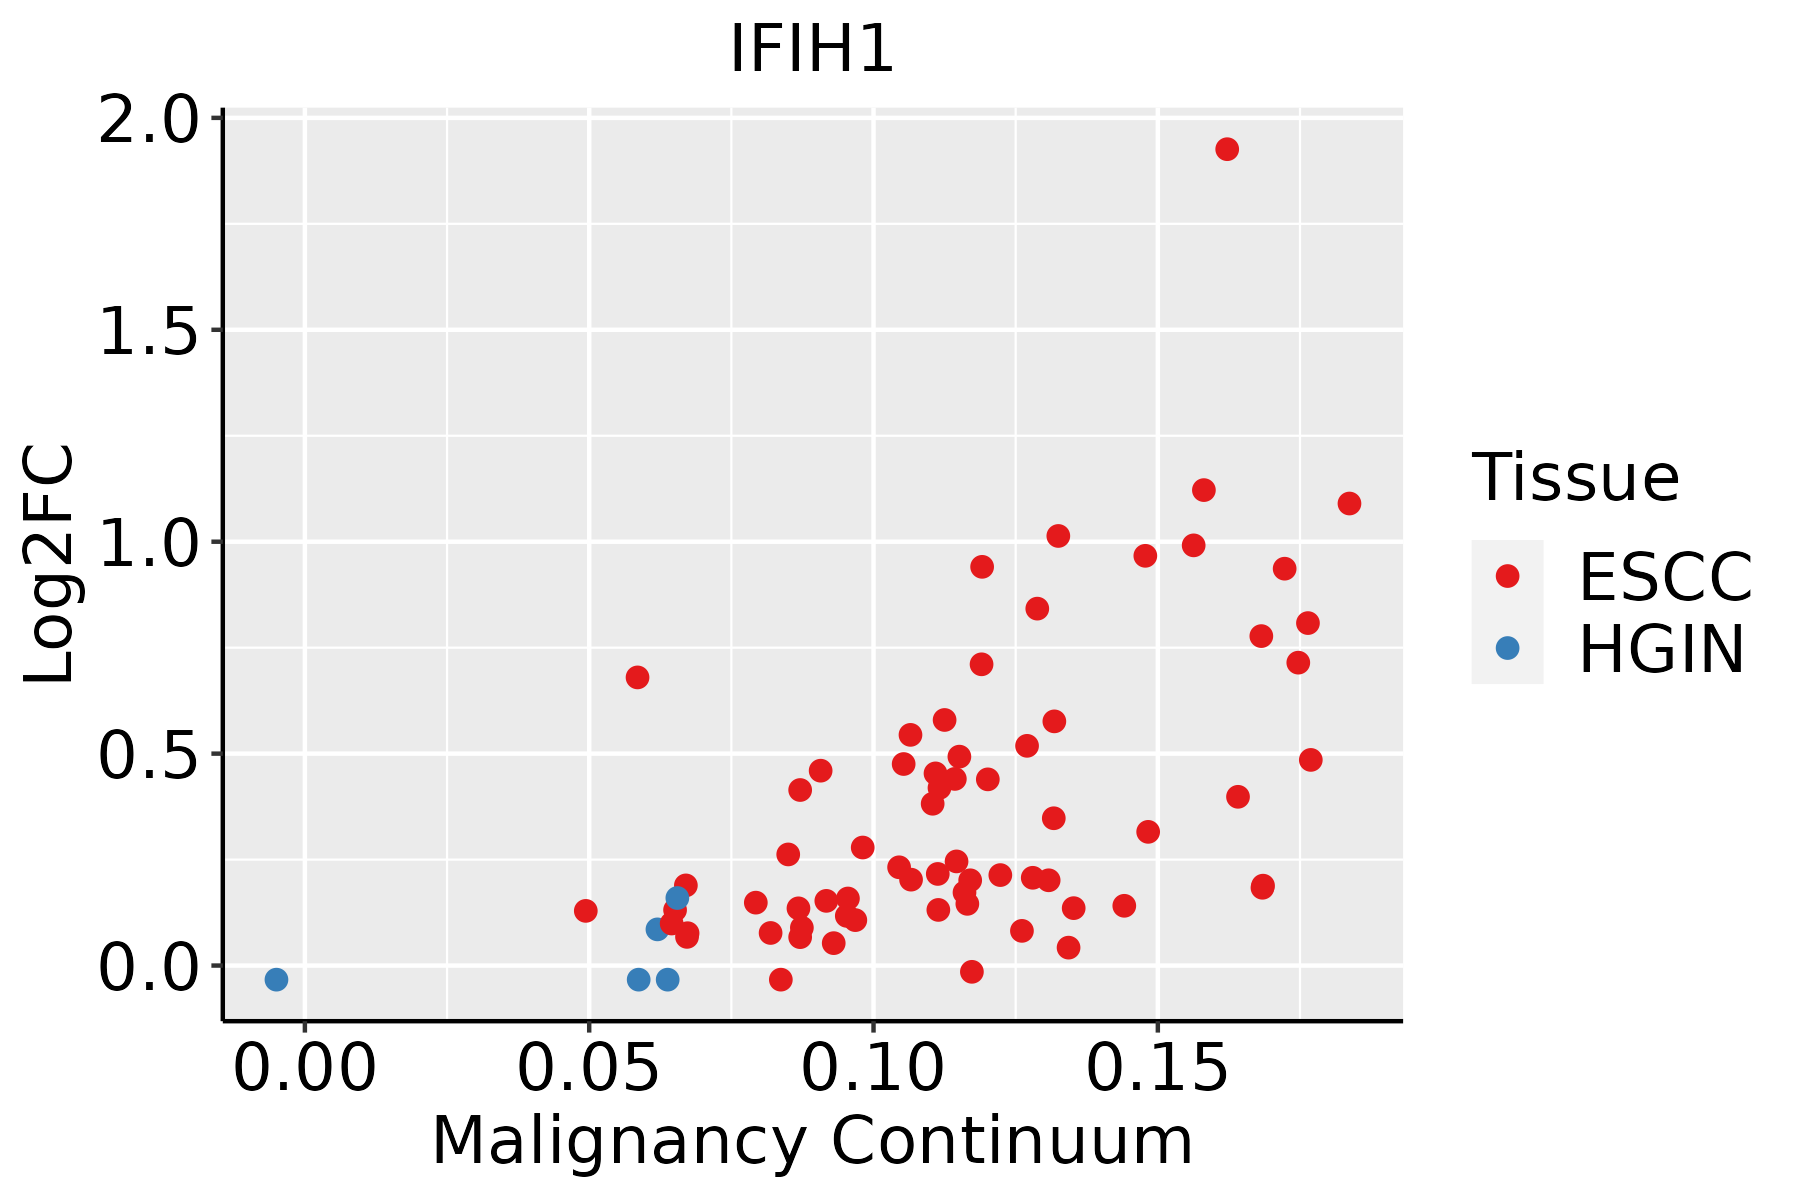 | ESCC: Esophageal squamous cell carcinoma |
| HGIN: High-grade intraepithelial neoplasias | ||
| LGIN: Low-grade intraepithelial neoplasias | ||
| Liver | 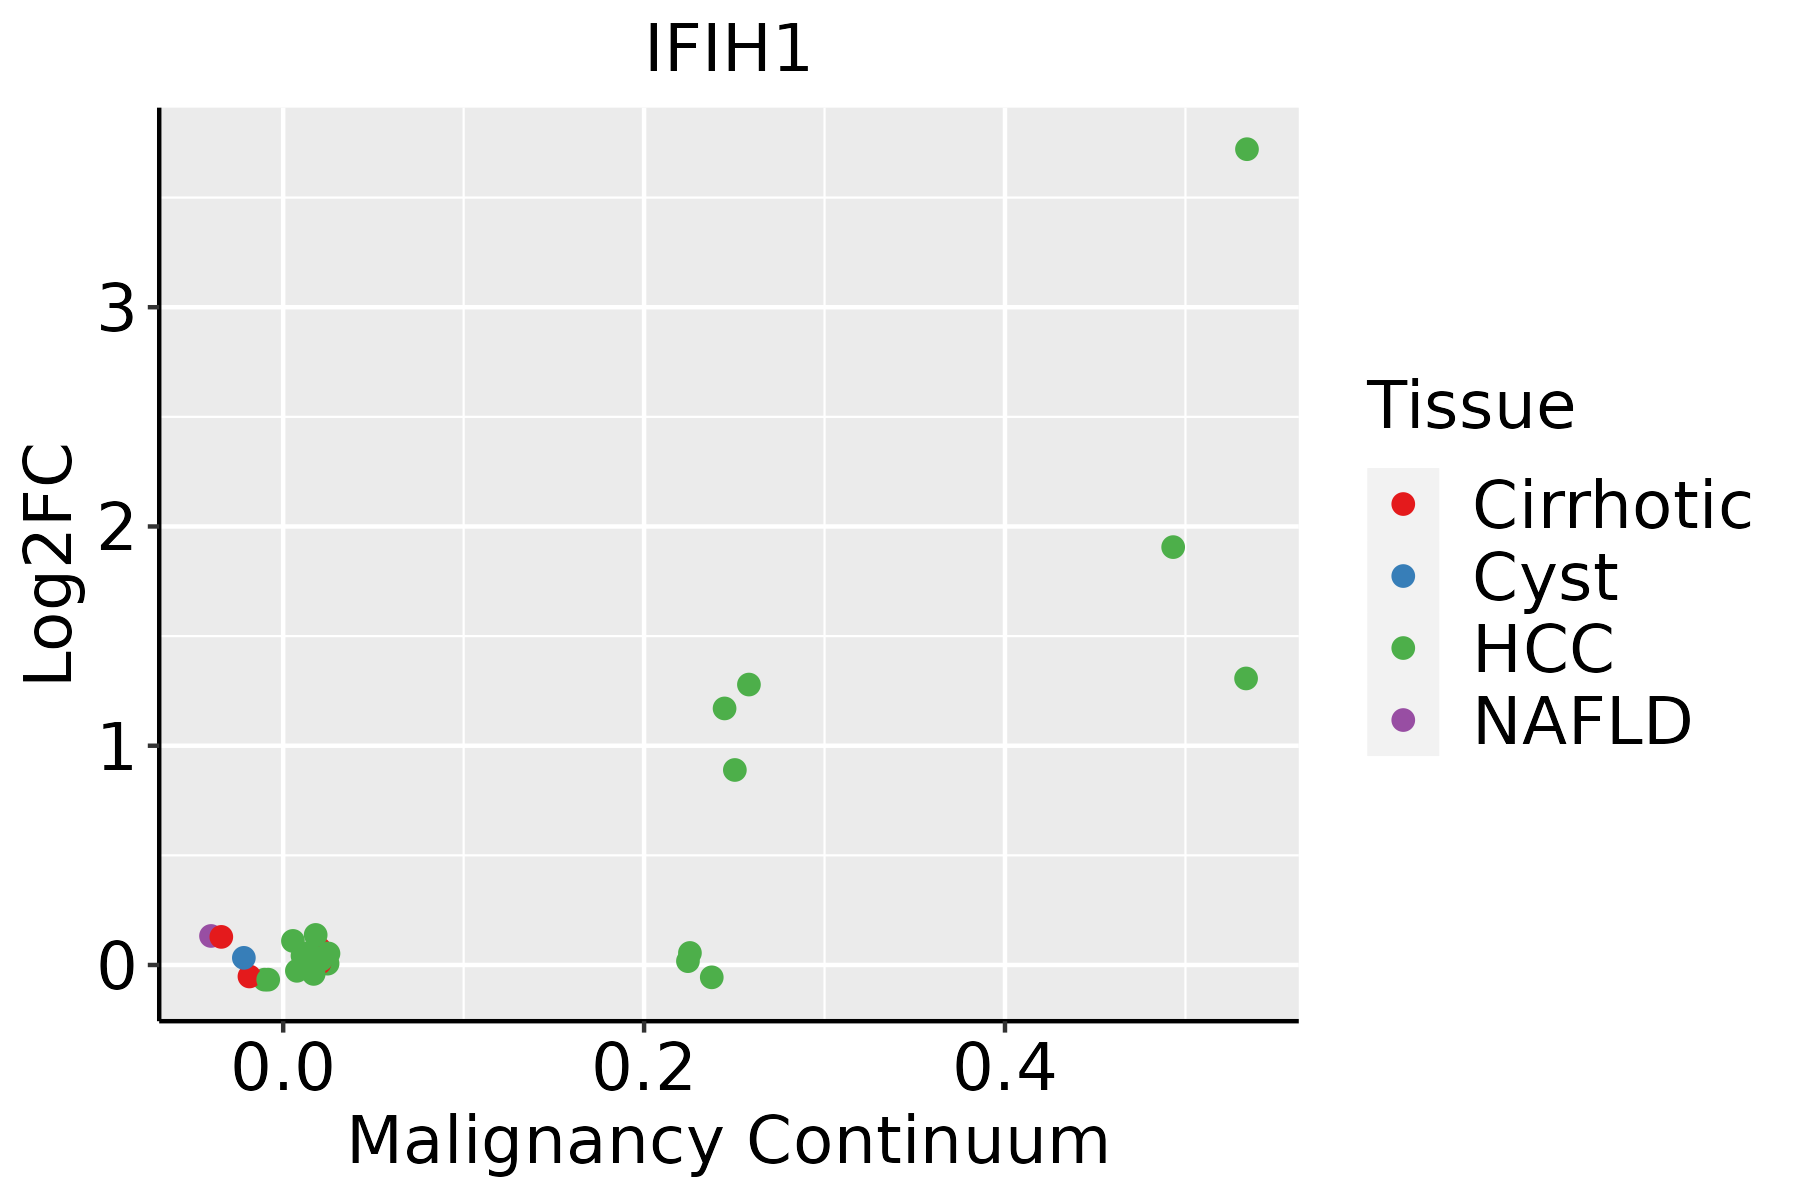 | HCC: Hepatocellular carcinoma |
| NAFLD: Non-alcoholic fatty liver disease | ||
| Oral Cavity | 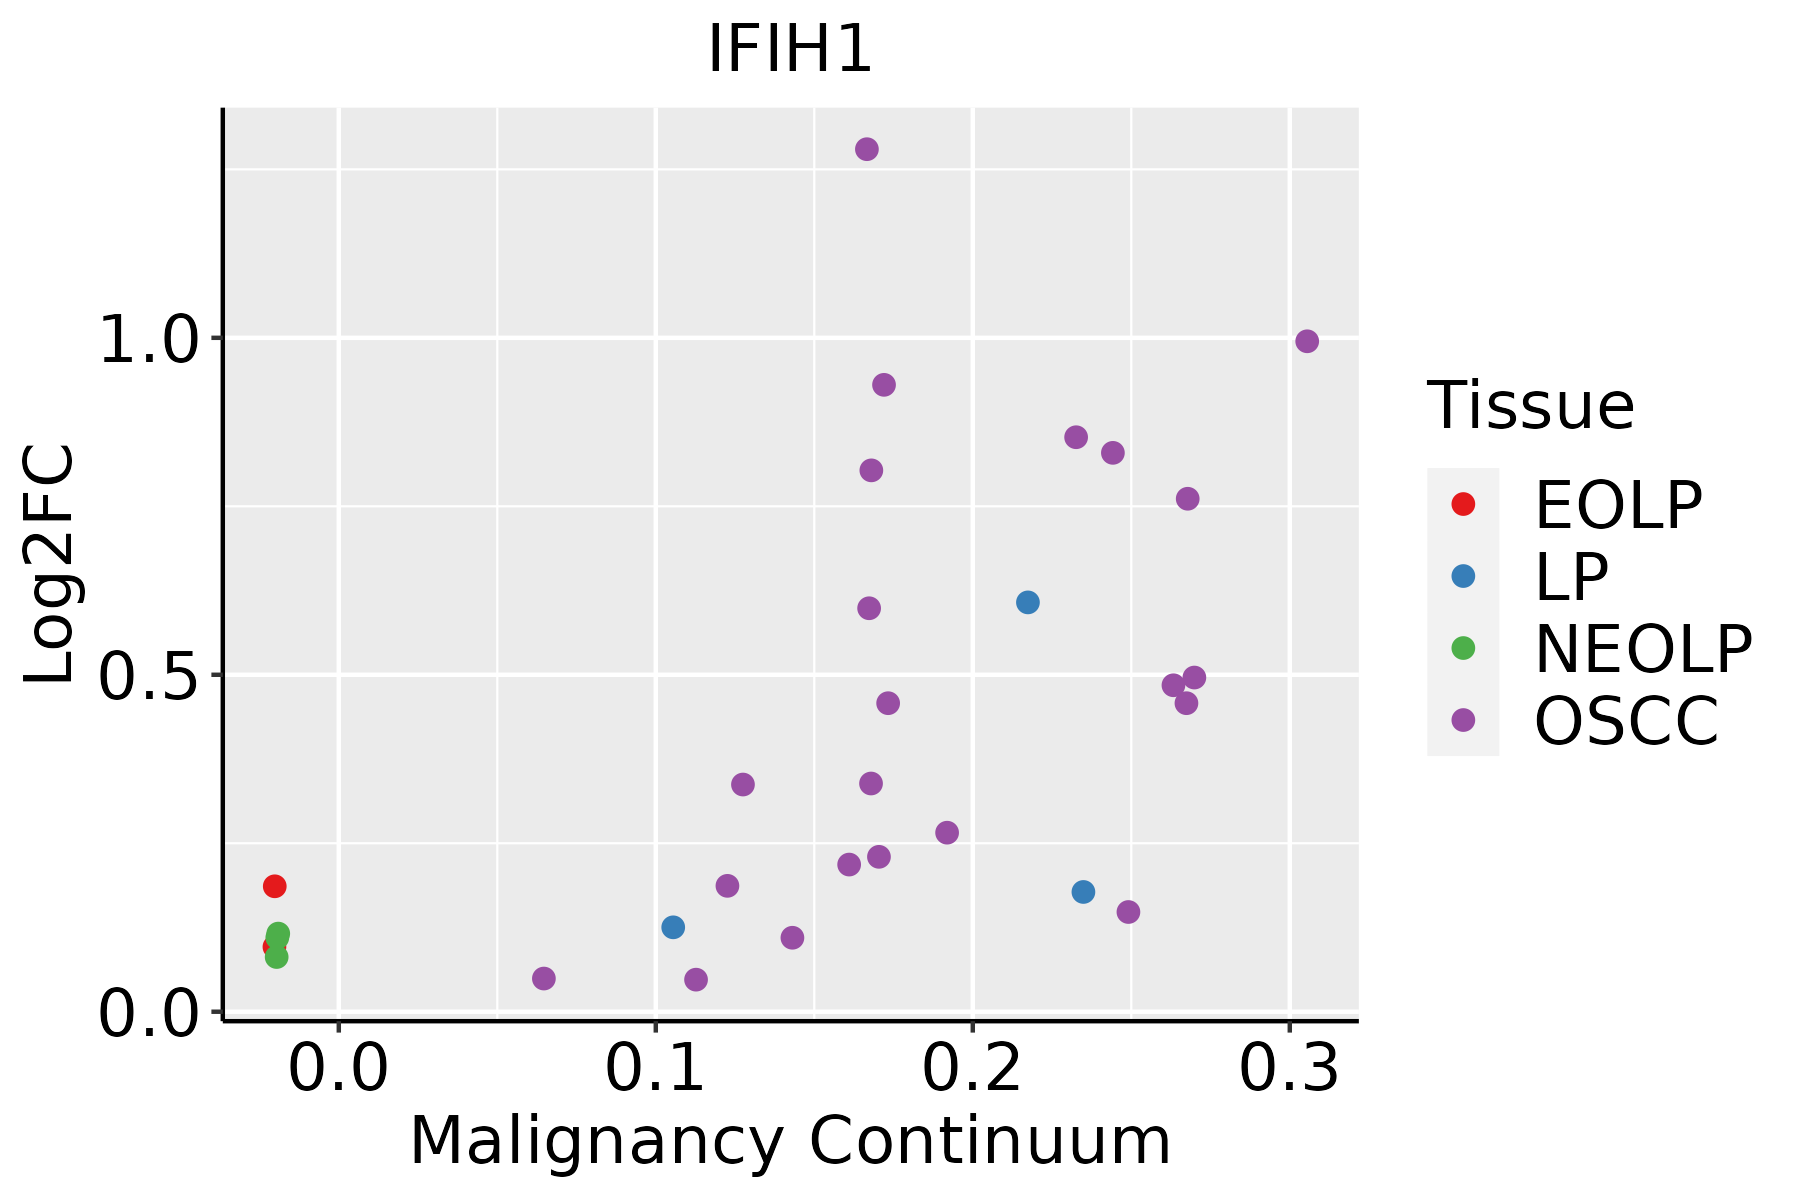 | EOLP: Erosive Oral lichen planus |
| LP: leukoplakia | ||
| NEOLP: Non-erosive oral lichen planus | ||
| OSCC: Oral squamous cell carcinoma | ||
| Skin | 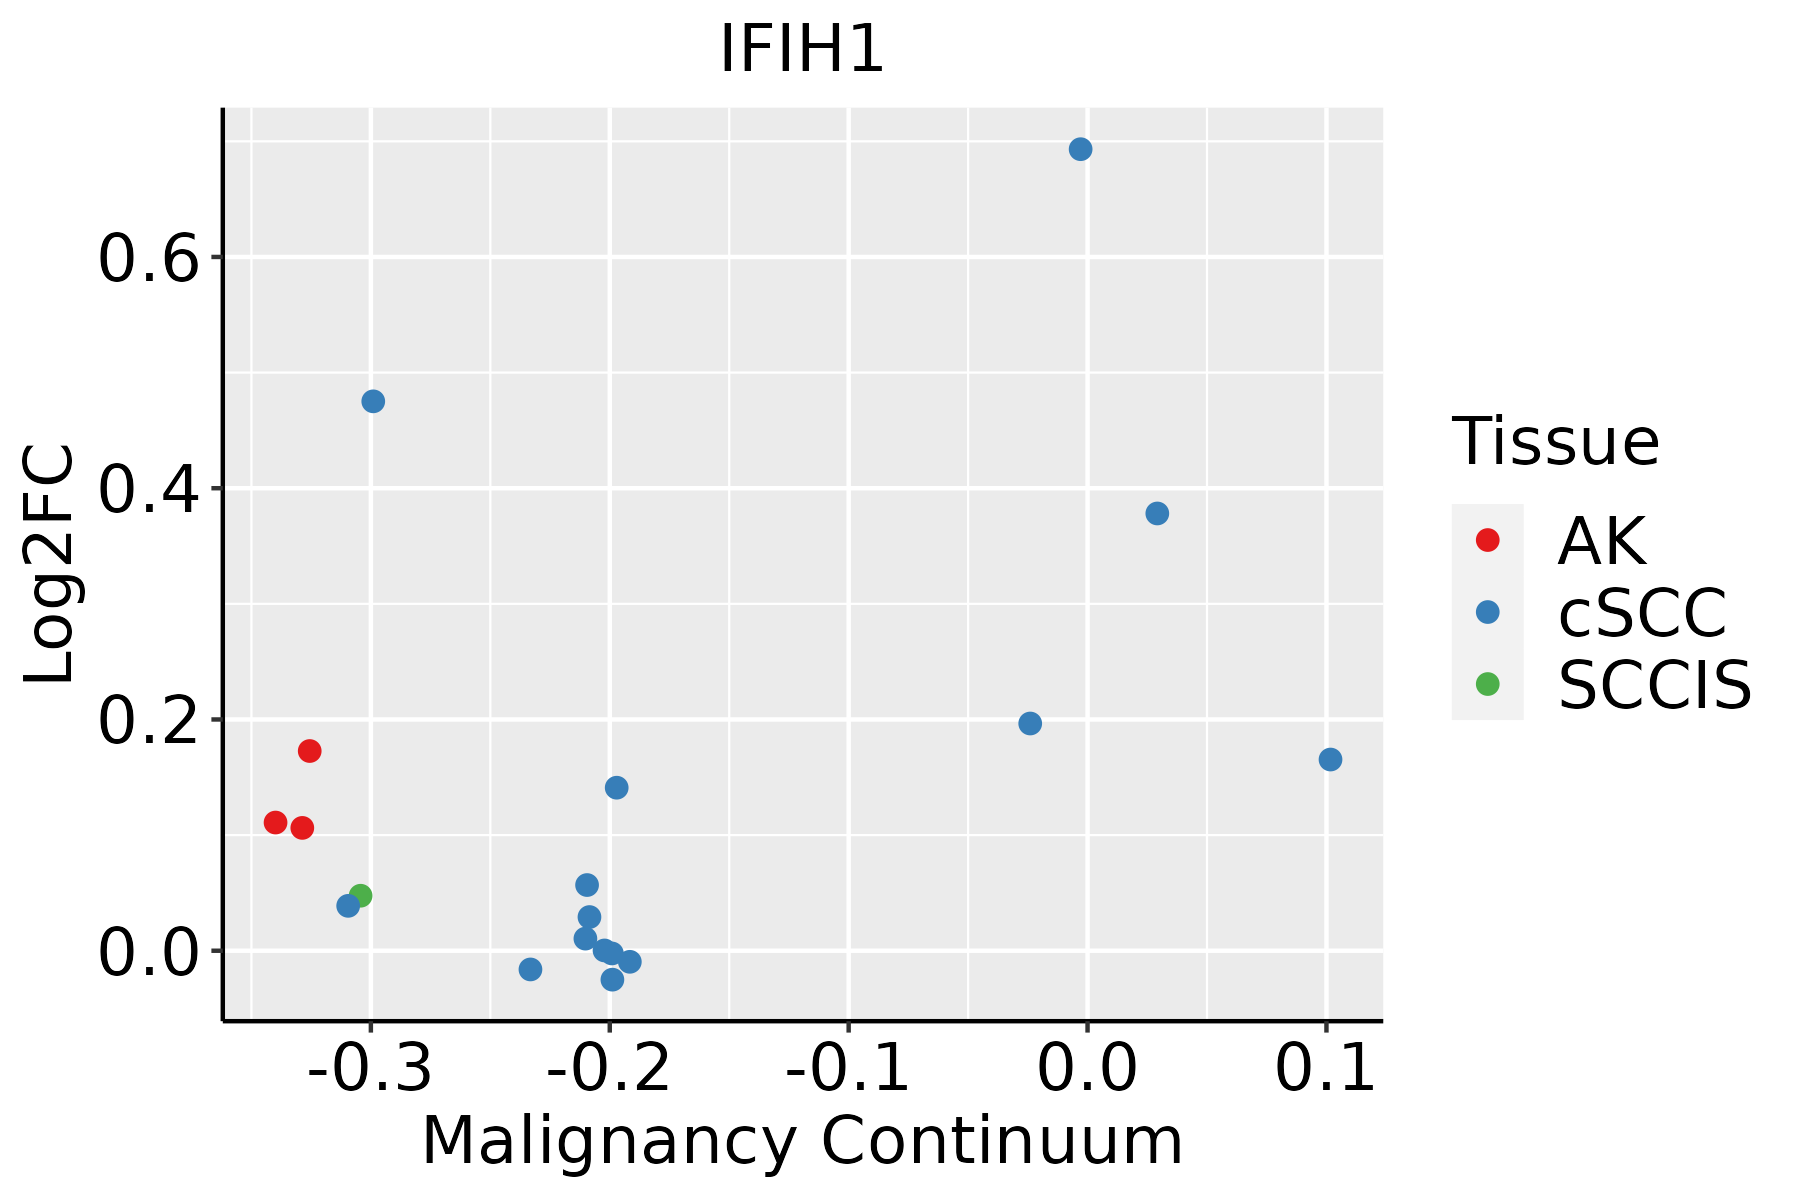 | AK: Actinic keratosis |
| cSCC: Cutaneous squamous cell carcinoma | ||
| SCCIS:squamous cell carcinoma in situ | ||
| Thyroid | 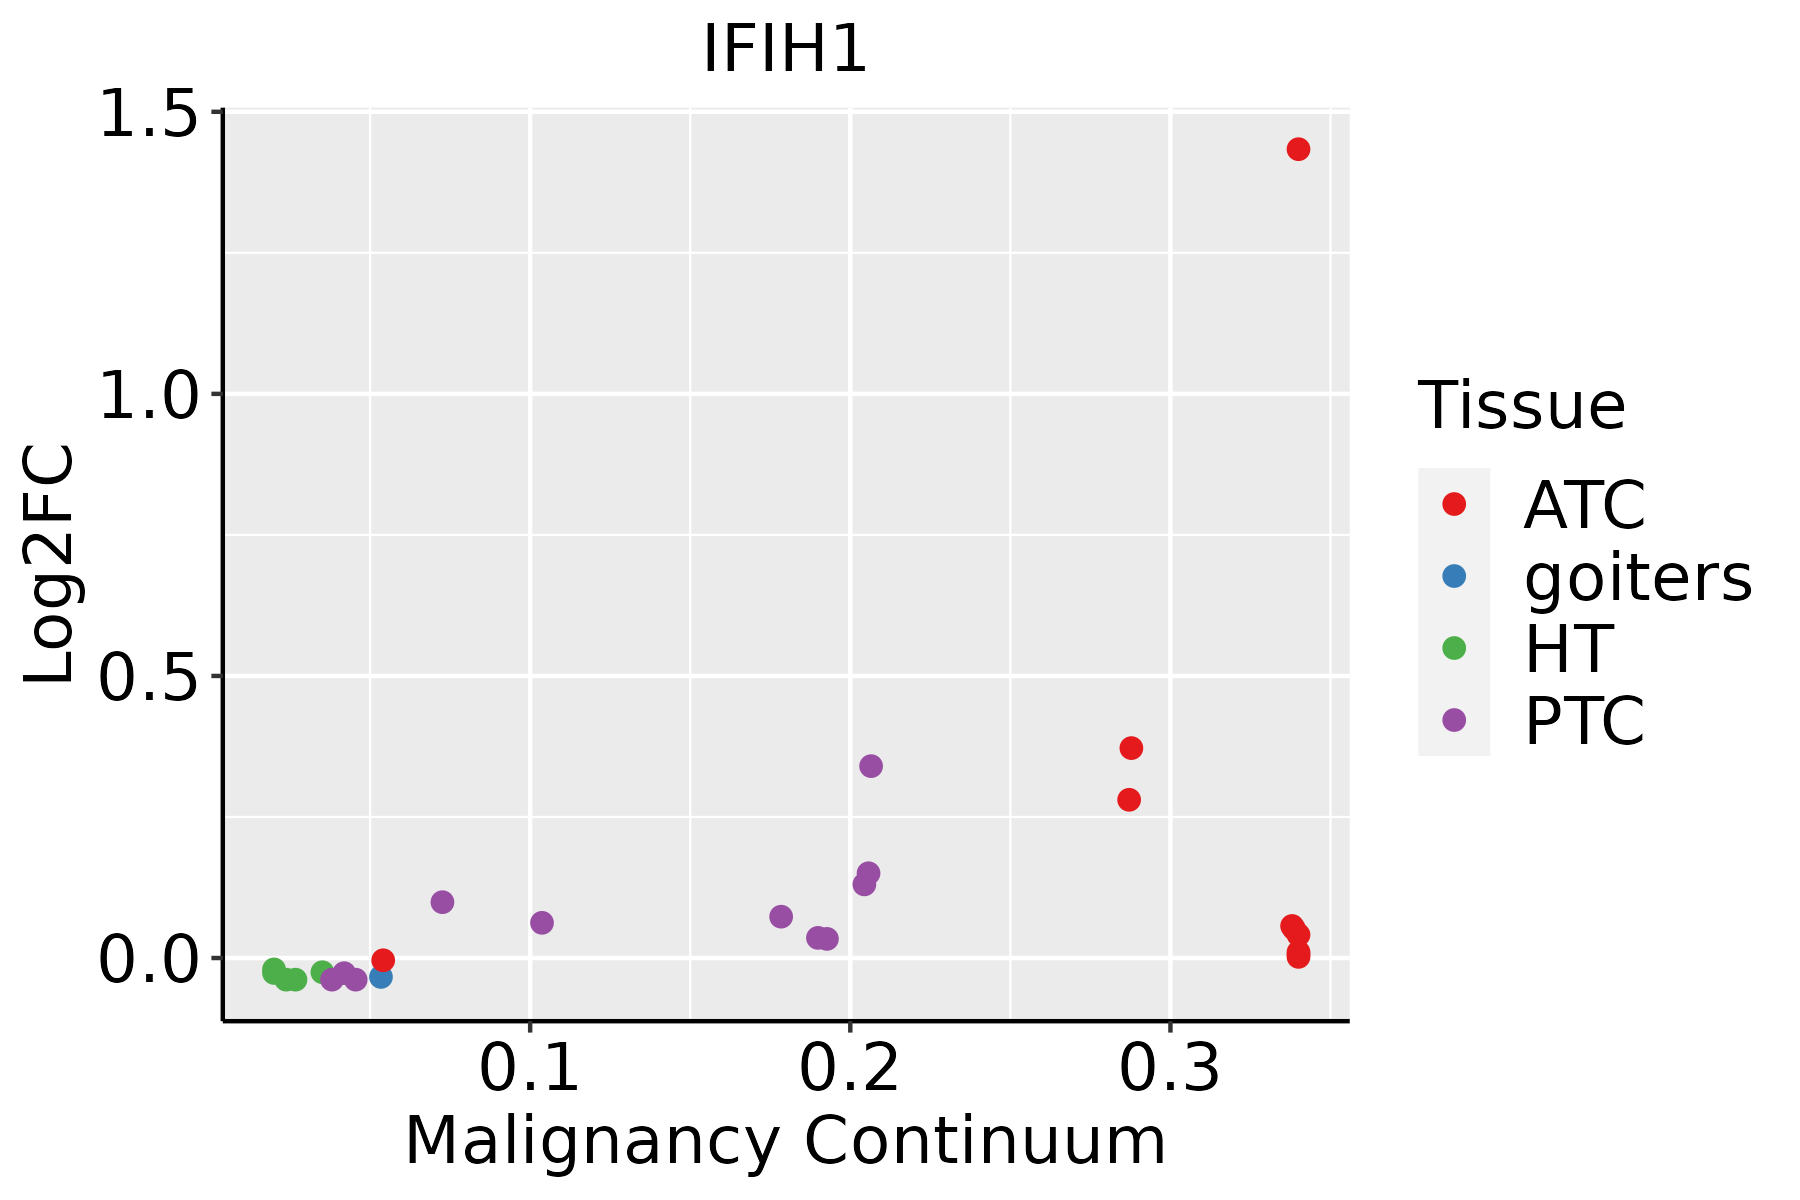 | ATC: Anaplastic thyroid cancer |
| HT: Hashimoto's thyroiditis | ||
| PTC: Papillary thyroid cancer |
| ∗log2FC in expression of this searched gene in stem-like cells from each diseased tissue sample relative to stem-like cells in normal samples in each tissue plotted against the malignancy continuum. Samples are colored based on if they are from different disease stage. |
Top |
Malignant transformation related pathway analysis |
| Find out the enriched GO biological processes and KEGG pathways involved in transition from healthy to precancer to cancer |
| Tissue | Disease Stage | Enriched GO biological Processes |
| Colorectum | AD |  |
| Colorectum | SER |  |
| Colorectum | MSS |  |
| Colorectum | MSI-H |  |
| Colorectum | FAP |  |
| ∗Top 15 enriched GO BP terms are showed in the bar plot of each disease state in each tissue. Each row represents a significant GO biological process which is colored according to the -log10(p.adjust). |
| Page: 1 2 3 4 5 6 7 8 9 |
| GO ID | Tissue | Disease Stage | Description | Gene Ratio | Bg Ratio | pvalue | p.adjust | Count |
| GO:0016032111 | Esophagus | ESCC | viral process | 301/8552 | 415/18723 | 3.34e-29 | 1.32e-26 | 301 |
| GO:0019058111 | Esophagus | ESCC | viral life cycle | 226/8552 | 317/18723 | 1.17e-20 | 1.76e-18 | 226 |
| GO:001820514 | Esophagus | ESCC | peptidyl-lysine modification | 259/8552 | 376/18723 | 3.90e-20 | 5.26e-18 | 259 |
| GO:0019079111 | Esophagus | ESCC | viral genome replication | 102/8552 | 131/18723 | 4.31e-14 | 2.19e-12 | 102 |
| GO:000961518 | Esophagus | ESCC | response to virus | 238/8552 | 367/18723 | 6.65e-14 | 3.32e-12 | 238 |
| GO:0050792111 | Esophagus | ESCC | regulation of viral process | 119/8552 | 164/18723 | 2.19e-12 | 9.03e-11 | 119 |
| GO:1903900111 | Esophagus | ESCC | regulation of viral life cycle | 106/8552 | 148/18723 | 1.26e-10 | 3.72e-09 | 106 |
| GO:0045069110 | Esophagus | ESCC | regulation of viral genome replication | 67/8552 | 85/18723 | 3.81e-10 | 1.04e-08 | 67 |
| GO:00516075 | Esophagus | ESCC | defense response to virus | 171/8552 | 265/18723 | 3.91e-10 | 1.05e-08 | 171 |
| GO:01405465 | Esophagus | ESCC | defense response to symbiont | 171/8552 | 265/18723 | 3.91e-10 | 1.05e-08 | 171 |
| GO:0030522110 | Esophagus | ESCC | intracellular receptor signaling pathway | 170/8552 | 265/18723 | 8.58e-10 | 2.09e-08 | 170 |
| GO:004852516 | Esophagus | ESCC | negative regulation of viral process | 66/8552 | 92/18723 | 3.49e-07 | 4.88e-06 | 66 |
| GO:004507114 | Esophagus | ESCC | negative regulation of viral genome replication | 44/8552 | 56/18723 | 4.84e-07 | 6.50e-06 | 44 |
| GO:001692512 | Esophagus | ESCC | protein sumoylation | 41/8552 | 53/18723 | 2.49e-06 | 2.86e-05 | 41 |
| GO:00607595 | Esophagus | ESCC | regulation of response to cytokine stimulus | 103/8552 | 162/18723 | 3.14e-06 | 3.53e-05 | 103 |
| GO:003952813 | Esophagus | ESCC | cytoplasmic pattern recognition receptor signaling pathway in response to virus | 28/8552 | 34/18723 | 1.21e-05 | 1.12e-04 | 28 |
| GO:003248112 | Esophagus | ESCC | positive regulation of type I interferon production | 42/8552 | 58/18723 | 3.27e-05 | 2.70e-04 | 42 |
| GO:009858613 | Esophagus | ESCC | cellular response to virus | 56/8552 | 84/18723 | 8.20e-05 | 6.01e-04 | 56 |
| GO:00326084 | Esophagus | ESCC | interferon-beta production | 40/8552 | 56/18723 | 8.36e-05 | 6.08e-04 | 40 |
| GO:00326484 | Esophagus | ESCC | regulation of interferon-beta production | 40/8552 | 56/18723 | 8.36e-05 | 6.08e-04 | 40 |
| Page: 1 2 3 4 5 6 7 8 9 10 11 |
| Pathway ID | Tissue | Disease Stage | Description | Gene Ratio | Bg Ratio | pvalue | p.adjust | qvalue | Count |
| hsa0516425 | Esophagus | ESCC | Influenza A | 122/4205 | 171/8465 | 5.01e-09 | 4.79e-08 | 2.45e-08 | 122 |
| hsa05171211 | Esophagus | ESCC | Coronavirus disease - COVID-19 | 156/4205 | 232/8465 | 3.18e-08 | 2.68e-07 | 1.37e-07 | 156 |
| hsa051619 | Esophagus | ESCC | Hepatitis B | 108/4205 | 162/8465 | 7.68e-06 | 4.15e-05 | 2.12e-05 | 108 |
| hsa051629 | Esophagus | ESCC | Measles | 90/4205 | 139/8465 | 2.16e-04 | 7.87e-04 | 4.03e-04 | 90 |
| hsa0516435 | Esophagus | ESCC | Influenza A | 122/4205 | 171/8465 | 5.01e-09 | 4.79e-08 | 2.45e-08 | 122 |
| hsa05171310 | Esophagus | ESCC | Coronavirus disease - COVID-19 | 156/4205 | 232/8465 | 3.18e-08 | 2.68e-07 | 1.37e-07 | 156 |
| hsa0516114 | Esophagus | ESCC | Hepatitis B | 108/4205 | 162/8465 | 7.68e-06 | 4.15e-05 | 2.12e-05 | 108 |
| hsa0516213 | Esophagus | ESCC | Measles | 90/4205 | 139/8465 | 2.16e-04 | 7.87e-04 | 4.03e-04 | 90 |
| hsa0517142 | Liver | HCC | Coronavirus disease - COVID-19 | 167/4020 | 232/8465 | 1.50e-14 | 4.19e-13 | 2.33e-13 | 167 |
| hsa0516421 | Liver | HCC | Influenza A | 101/4020 | 171/8465 | 1.41e-03 | 5.07e-03 | 2.82e-03 | 101 |
| hsa051612 | Liver | HCC | Hepatitis B | 91/4020 | 162/8465 | 1.56e-02 | 3.76e-02 | 2.09e-02 | 91 |
| hsa0517152 | Liver | HCC | Coronavirus disease - COVID-19 | 167/4020 | 232/8465 | 1.50e-14 | 4.19e-13 | 2.33e-13 | 167 |
| hsa0516431 | Liver | HCC | Influenza A | 101/4020 | 171/8465 | 1.41e-03 | 5.07e-03 | 2.82e-03 | 101 |
| hsa0516111 | Liver | HCC | Hepatitis B | 91/4020 | 162/8465 | 1.56e-02 | 3.76e-02 | 2.09e-02 | 91 |
| hsa0517130 | Oral cavity | OSCC | Coronavirus disease - COVID-19 | 156/3704 | 232/8465 | 2.30e-13 | 5.14e-12 | 2.62e-12 | 156 |
| hsa0516418 | Oral cavity | OSCC | Influenza A | 116/3704 | 171/8465 | 1.23e-10 | 1.78e-09 | 9.08e-10 | 116 |
| hsa051618 | Oral cavity | OSCC | Hepatitis B | 103/3704 | 162/8465 | 2.34e-07 | 1.51e-06 | 7.69e-07 | 103 |
| hsa051628 | Oral cavity | OSCC | Measles | 90/3704 | 139/8465 | 4.10e-07 | 2.50e-06 | 1.27e-06 | 90 |
| hsa04622 | Oral cavity | OSCC | RIG-I-like receptor signaling pathway | 41/3704 | 71/8465 | 1.20e-02 | 2.63e-02 | 1.34e-02 | 41 |
| hsa05171114 | Oral cavity | OSCC | Coronavirus disease - COVID-19 | 156/3704 | 232/8465 | 2.30e-13 | 5.14e-12 | 2.62e-12 | 156 |
| Page: 1 2 |
Top |
Cell-cell communication analysis |
| Identification of potential cell-cell interactions between two cell types and their ligand-receptor pairs for different disease states |
| Ligand | Receptor | LRpair | Pathway | Tissue | Disease Stage |
| Page: 1 |
Top |
Single-cell gene regulatory network inference analysis |
| Find out the significant the regulons (TFs) and the target genes of each regulon across cell types for different disease states |
| TF | Cell Type | Tissue | Disease Stage | Target Gene | RSS | Regulon Activity |
| ∗The dot plots of a searched regulon are shown for all cell subpopulations in each disease state of each tissue based on the regulon specific score inferred using pySCENIC and by calculating the average expression. |
| Page: 1 |
Top |
Somatic mutation of malignant transformation related genes |
| Annotation of somatic variants for genes involved in malignant transformation |
| Hugo Symbol | Variant Class | Variant Classification | dbSNP RS | HGVSc | HGVSp | HGVSp Short | SWISSPROT | BIOTYPE | SIFT | PolyPhen | Tumor Sample Barcode | Tissue | Histology | Sex | Age | Stage | Therapy Types | Drugs | Outcome |
| IFIH1 | SNV | Missense_Mutation | novel | c.630G>C | p.Glu210Asp | p.E210D | Q9BYX4 | protein_coding | tolerated(0.18) | benign(0.001) | TCGA-5L-AAT1-01 | Breast | breast invasive carcinoma | Female | <65 | III/IV | Hormone Therapy | letrozol | SD |
| IFIH1 | SNV | Missense_Mutation | rs200810568 | c.2456N>A | p.Ala819Asp | p.A819D | Q9BYX4 | protein_coding | deleterious(0) | probably_damaging(0.995) | TCGA-A2-A4S0-01 | Breast | breast invasive carcinoma | Female | >=65 | I/II | Unknown | Unknown | SD |
| IFIH1 | SNV | Missense_Mutation | novel | c.264N>G | p.Ser88Arg | p.S88R | Q9BYX4 | protein_coding | tolerated(0.13) | benign(0.074) | TCGA-AN-A049-01 | Breast | breast invasive carcinoma | Female | <65 | I/II | Unknown | Unknown | SD |
| IFIH1 | SNV | Missense_Mutation | c.2553G>C | p.Glu851Asp | p.E851D | Q9BYX4 | protein_coding | deleterious(0) | possibly_damaging(0.864) | TCGA-B6-A0RV-01 | Breast | breast invasive carcinoma | Female | <65 | III/IV | Unknown | Unknown | SD | |
| IFIH1 | SNV | Missense_Mutation | rs376785582 | c.2559G>A | p.Met853Ile | p.M853I | Q9BYX4 | protein_coding | deleterious(0) | probably_damaging(0.991) | TCGA-BH-A18U-01 | Breast | breast invasive carcinoma | Female | >=65 | III/IV | Unknown | Unknown | SD |
| IFIH1 | SNV | Missense_Mutation | rs762115082 | c.121N>C | p.Glu41Gln | p.E41Q | Q9BYX4 | protein_coding | tolerated(0.08) | benign(0.262) | TCGA-C8-A274-01 | Breast | breast invasive carcinoma | Female | <65 | I/II | Hormone Therapy | tamoxiphen | SD |
| IFIH1 | SNV | Missense_Mutation | rs769742165 | c.2431N>G | p.Thr811Ala | p.T811A | Q9BYX4 | protein_coding | deleterious(0.03) | probably_damaging(0.936) | TCGA-EW-A1IZ-01 | Breast | breast invasive carcinoma | Female | <65 | III/IV | Chemotherapy | taxotere | SD |
| IFIH1 | SNV | Missense_Mutation | novel | c.2317G>A | p.Glu773Lys | p.E773K | Q9BYX4 | protein_coding | deleterious(0.01) | possibly_damaging(0.577) | TCGA-LL-A5YM-01 | Breast | breast invasive carcinoma | Female | >=65 | III/IV | Unspecific | letrozole | PD |
| IFIH1 | insertion | In_Frame_Ins | novel | c.262_263insATGTTTTCACTGAAGTAAAAA | p.Gly87_Ser88insAsnValPheThrGluValLys | p.G87_S88insNVFTEVK | Q9BYX4 | protein_coding | TCGA-AN-A049-01 | Breast | breast invasive carcinoma | Female | <65 | I/II | Unknown | Unknown | SD | ||
| IFIH1 | insertion | Frame_Shift_Ins | novel | c.207_208insCAGAAACCGGGTAGGT | p.Val70GlnfsTer34 | p.V70Qfs*34 | Q9BYX4 | protein_coding | TCGA-B6-A0IM-01 | Breast | breast invasive carcinoma | Female | >=65 | I/II | Unknown | Unknown | SD |
| Page: 1 2 3 4 5 6 7 8 9 10 |
Top |
Related drugs of malignant transformation related genes |
| Identification of chemicals and drugs interact with genes involved in malignant transfromation |
| (DGIdb 4.0) |
| Entrez ID | Symbol | Category | Interaction Types | Drug Claim Name | Drug Name | PMIDs |
| Page: 1 |

Copyright 2023-Present -The University of Texas Health Science Center at Houston |