
|
|||||
|
 | |
| |
| |
| |
| |
| |
|
Gene: IFI6 |
Gene summary for IFI6 |
| Gene information | Species | Human | Gene symbol | IFI6 | Gene ID | 2537 |
| Gene name | interferon alpha inducible protein 6 | |
| Gene Alias | 6-16 | |
| Cytomap | 1p35.3 | |
| Gene Type | protein-coding | GO ID | GO:0001836 | UniProtAcc | P09912 |
Top |
Malignant transformation analysis |
| Identification of the aberrant gene expression in precancerous and cancerous lesions by comparing the gene expression of stem-like cells in diseased tissues with normal stem cells |
| Entrez ID | Symbol | Replicates | Species | Organ | Tissue | Adj P-value | Log2FC | Malignancy |
| 2537 | IFI6 | GSM4909281 | Human | Breast | IDC | 9.91e-110 | 1.58e+00 | 0.21 |
| 2537 | IFI6 | GSM4909282 | Human | Breast | IDC | 6.94e-03 | 1.89e-01 | -0.0288 |
| 2537 | IFI6 | GSM4909285 | Human | Breast | IDC | 4.30e-12 | 5.17e-01 | 0.21 |
| 2537 | IFI6 | GSM4909287 | Human | Breast | IDC | 6.14e-37 | 8.84e-01 | 0.2057 |
| 2537 | IFI6 | GSM4909288 | Human | Breast | IDC | 2.27e-12 | 7.67e-01 | 0.0988 |
| 2537 | IFI6 | GSM4909290 | Human | Breast | IDC | 3.06e-22 | 6.16e-01 | 0.2096 |
| 2537 | IFI6 | GSM4909291 | Human | Breast | IDC | 6.85e-03 | 2.60e-01 | 0.1753 |
| 2537 | IFI6 | GSM4909293 | Human | Breast | IDC | 1.69e-28 | 6.55e-01 | 0.1581 |
| 2537 | IFI6 | GSM4909294 | Human | Breast | IDC | 2.48e-06 | 4.02e-01 | 0.2022 |
| 2537 | IFI6 | GSM4909295 | Human | Breast | IDC | 3.27e-24 | 9.57e-01 | 0.0898 |
| 2537 | IFI6 | GSM4909297 | Human | Breast | IDC | 1.01e-54 | 1.30e+00 | 0.1517 |
| 2537 | IFI6 | GSM4909300 | Human | Breast | IDC | 2.76e-04 | 3.77e-01 | 0.0334 |
| 2537 | IFI6 | GSM4909301 | Human | Breast | IDC | 1.22e-17 | 5.18e-01 | 0.1577 |
| 2537 | IFI6 | GSM4909302 | Human | Breast | IDC | 2.00e-10 | 3.81e-01 | 0.1545 |
| 2537 | IFI6 | GSM4909304 | Human | Breast | IDC | 4.77e-46 | 8.61e-01 | 0.1636 |
| 2537 | IFI6 | GSM4909305 | Human | Breast | IDC | 4.29e-28 | 7.08e-01 | 0.0436 |
| 2537 | IFI6 | GSM4909306 | Human | Breast | IDC | 2.12e-52 | 9.68e-01 | 0.1564 |
| 2537 | IFI6 | GSM4909307 | Human | Breast | IDC | 1.17e-99 | 1.50e+00 | 0.1569 |
| 2537 | IFI6 | GSM4909308 | Human | Breast | IDC | 3.32e-120 | 1.63e+00 | 0.158 |
| 2537 | IFI6 | GSM4909309 | Human | Breast | IDC | 1.70e-87 | 1.54e+00 | 0.0483 |
| Page: 1 2 3 4 5 6 7 8 9 10 11 12 13 |
| Tissue | Expression Dynamics | Abbreviation |
| Breast | 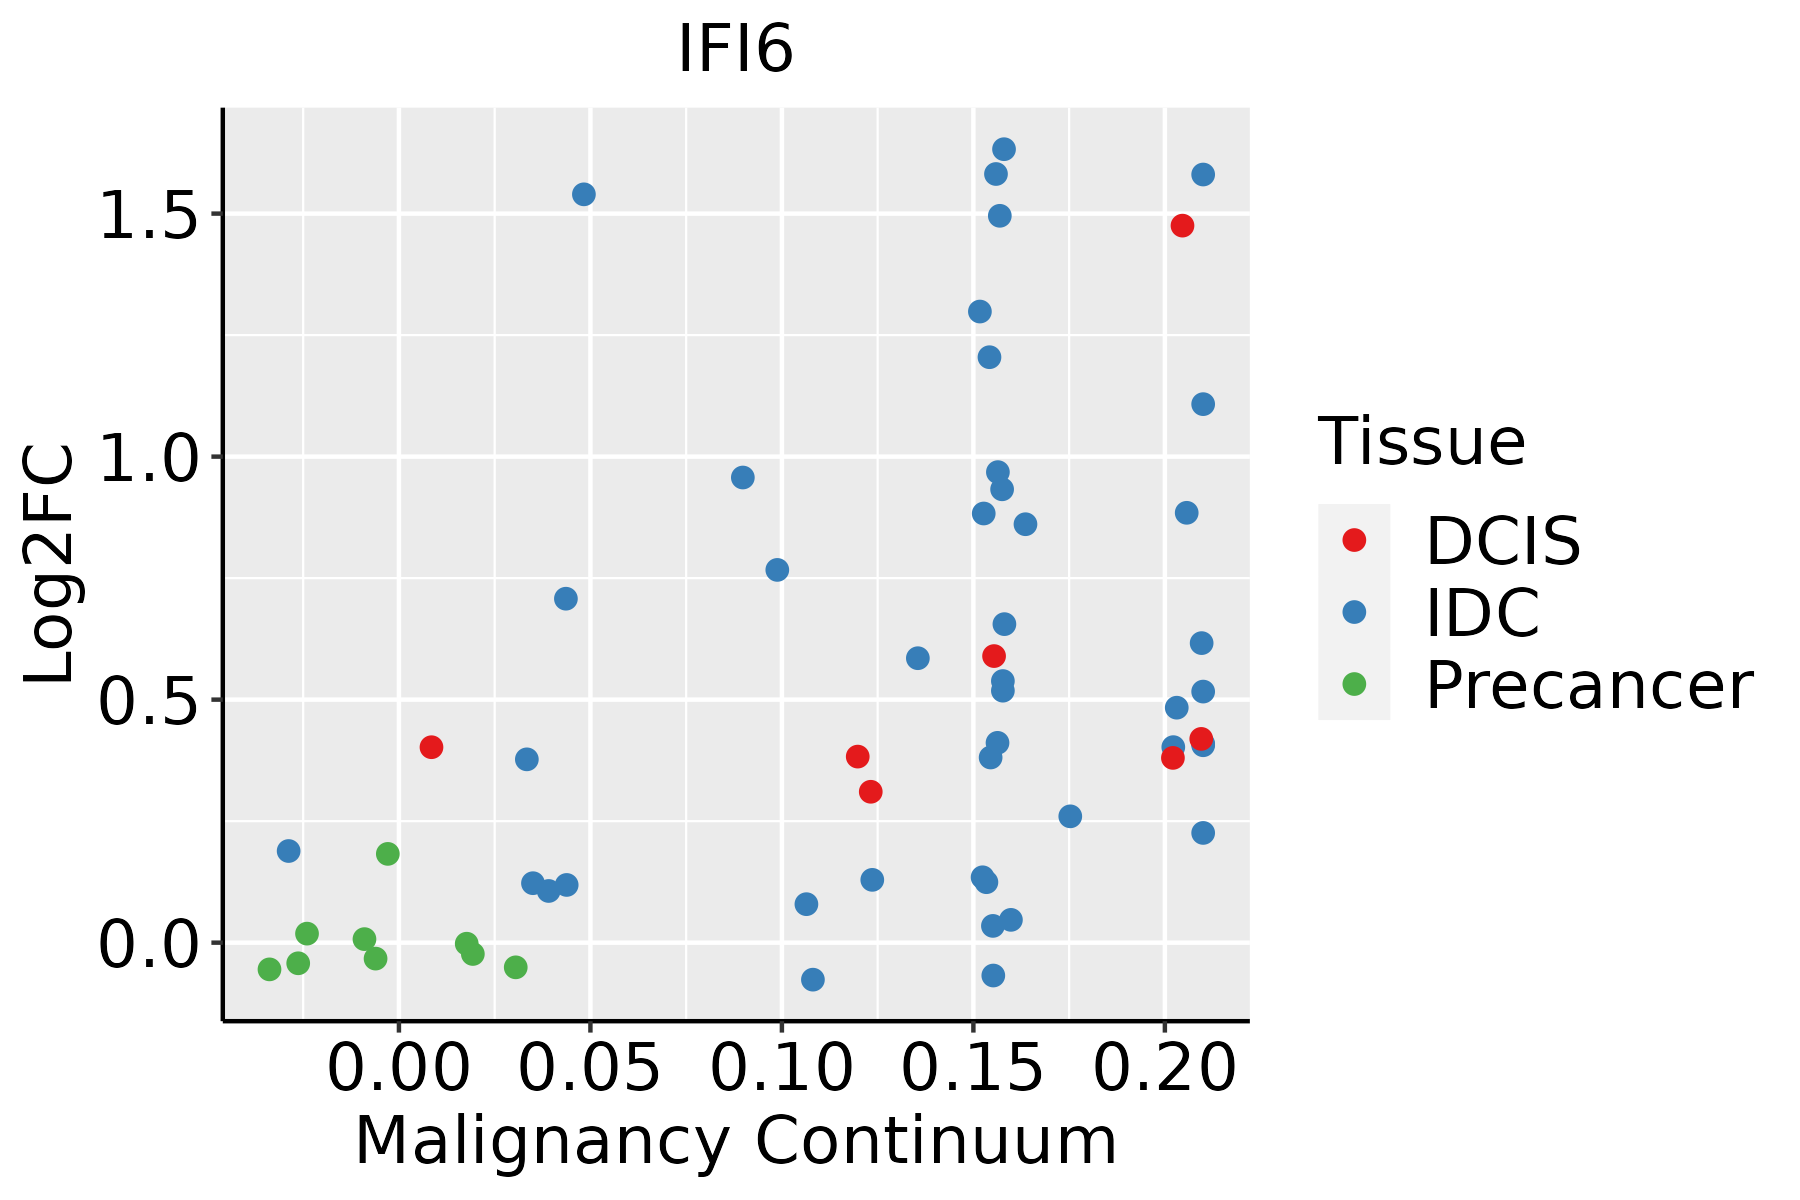 | IDC: Invasive ductal carcinoma |
| DCIS: Ductal carcinoma in situ | ||
| Precancer(BRCA1-mut): Precancerous lesion from BRCA1 mutation carriers | ||
| Cervix |  | CC: Cervix cancer |
| HSIL_HPV: HPV-infected high-grade squamous intraepithelial lesions | ||
| N_HPV: HPV-infected normal cervix | ||
| Colorectum (GSE201348) | 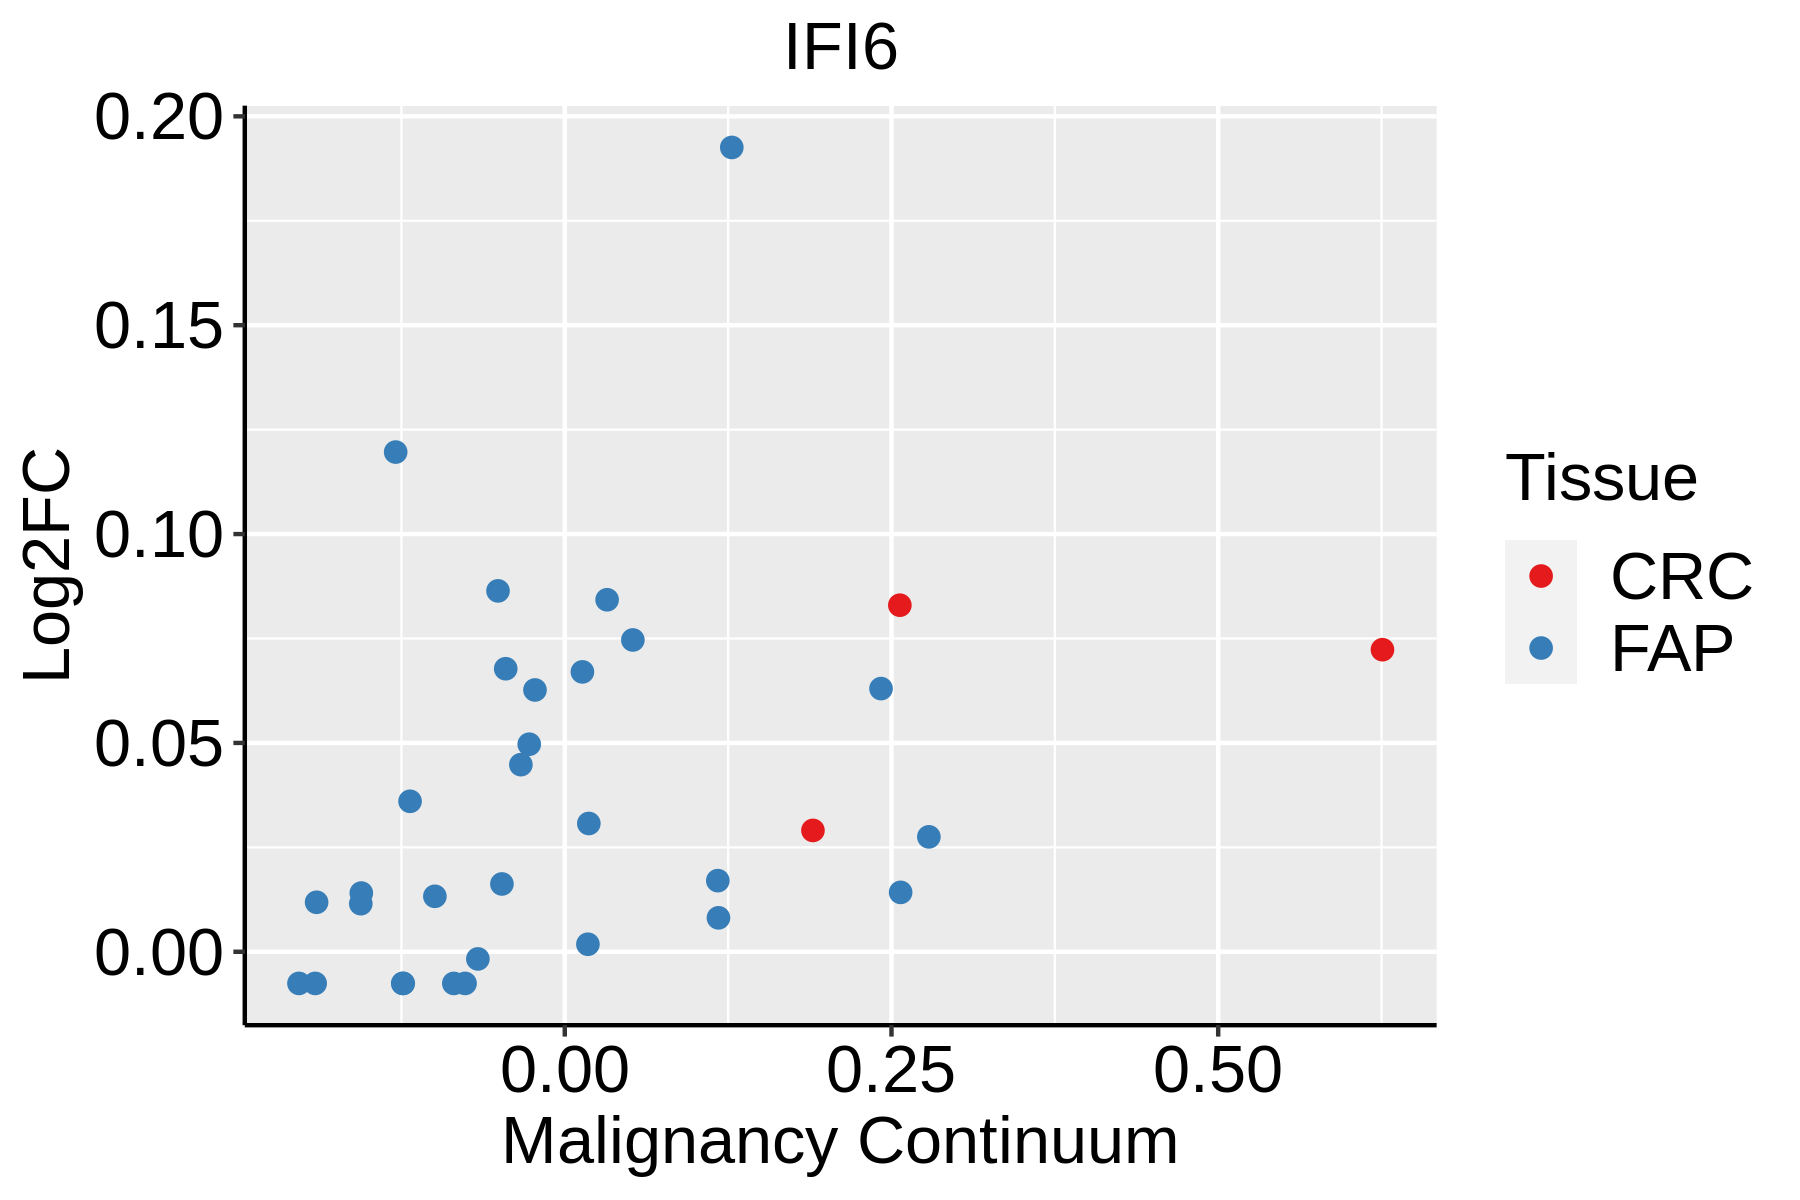 | FAP: Familial adenomatous polyposis |
| CRC: Colorectal cancer | ||
| Colorectum (HTA11) |  | AD: Adenomas |
| SER: Sessile serrated lesions | ||
| MSI-H: Microsatellite-high colorectal cancer | ||
| MSS: Microsatellite stable colorectal cancer | ||
| Endometrium | 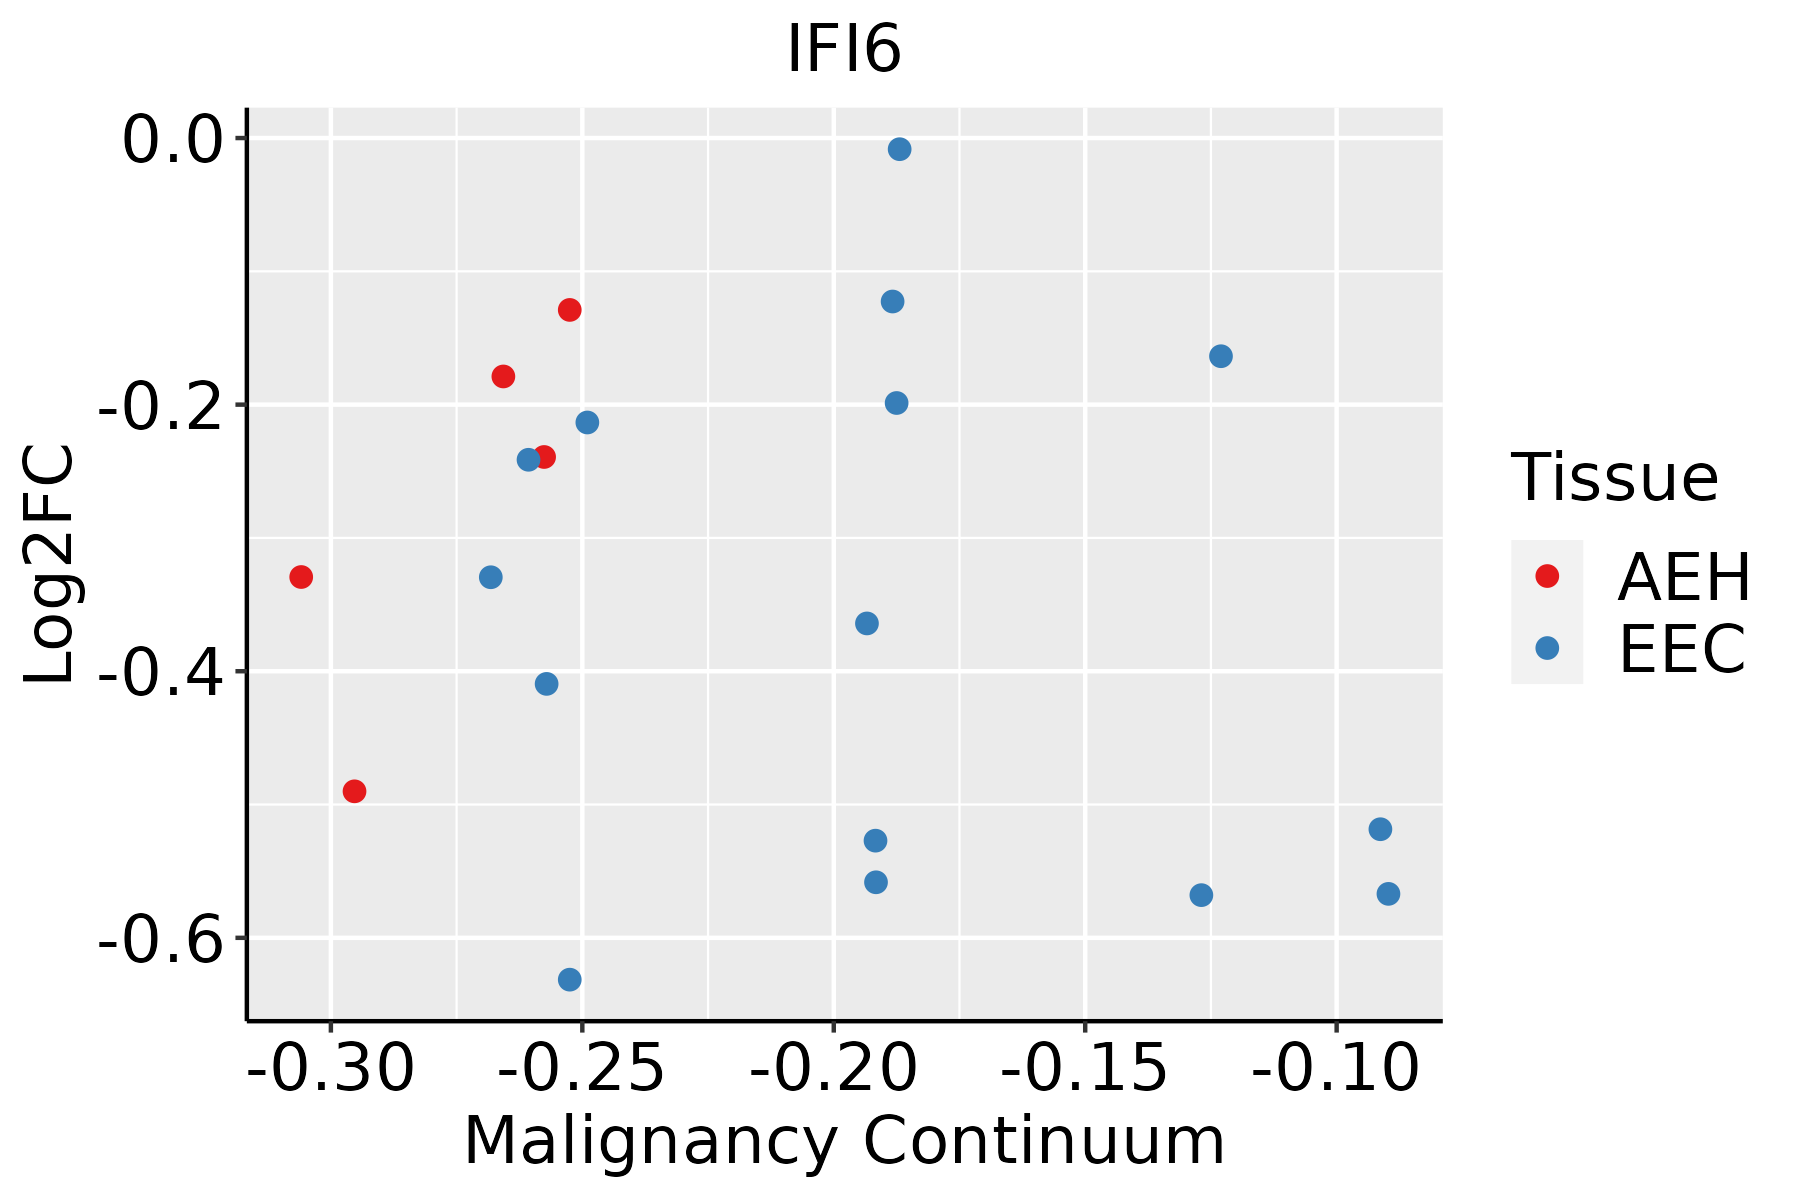 | AEH: Atypical endometrial hyperplasia |
| EEC: Endometrioid Cancer | ||
| Esophagus | 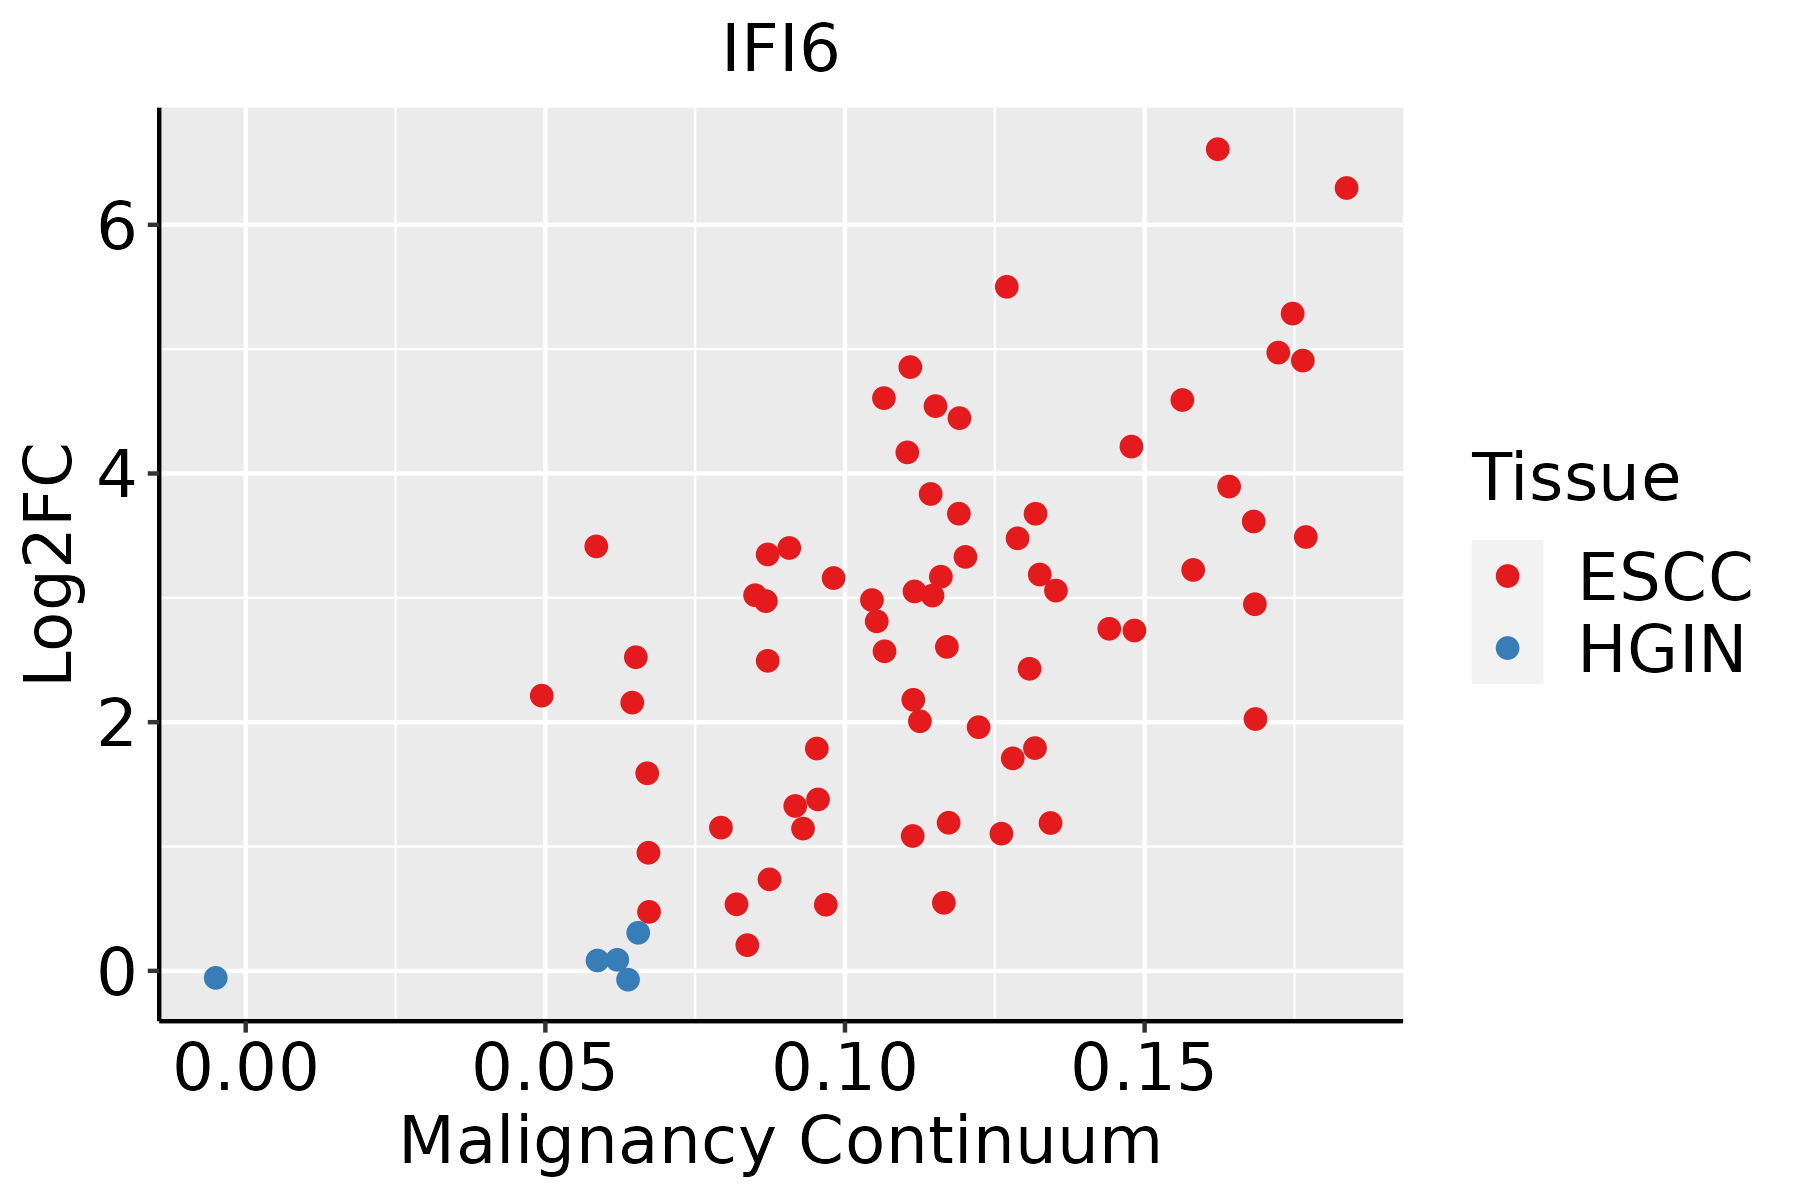 | ESCC: Esophageal squamous cell carcinoma |
| HGIN: High-grade intraepithelial neoplasias | ||
| LGIN: Low-grade intraepithelial neoplasias | ||
| GC | 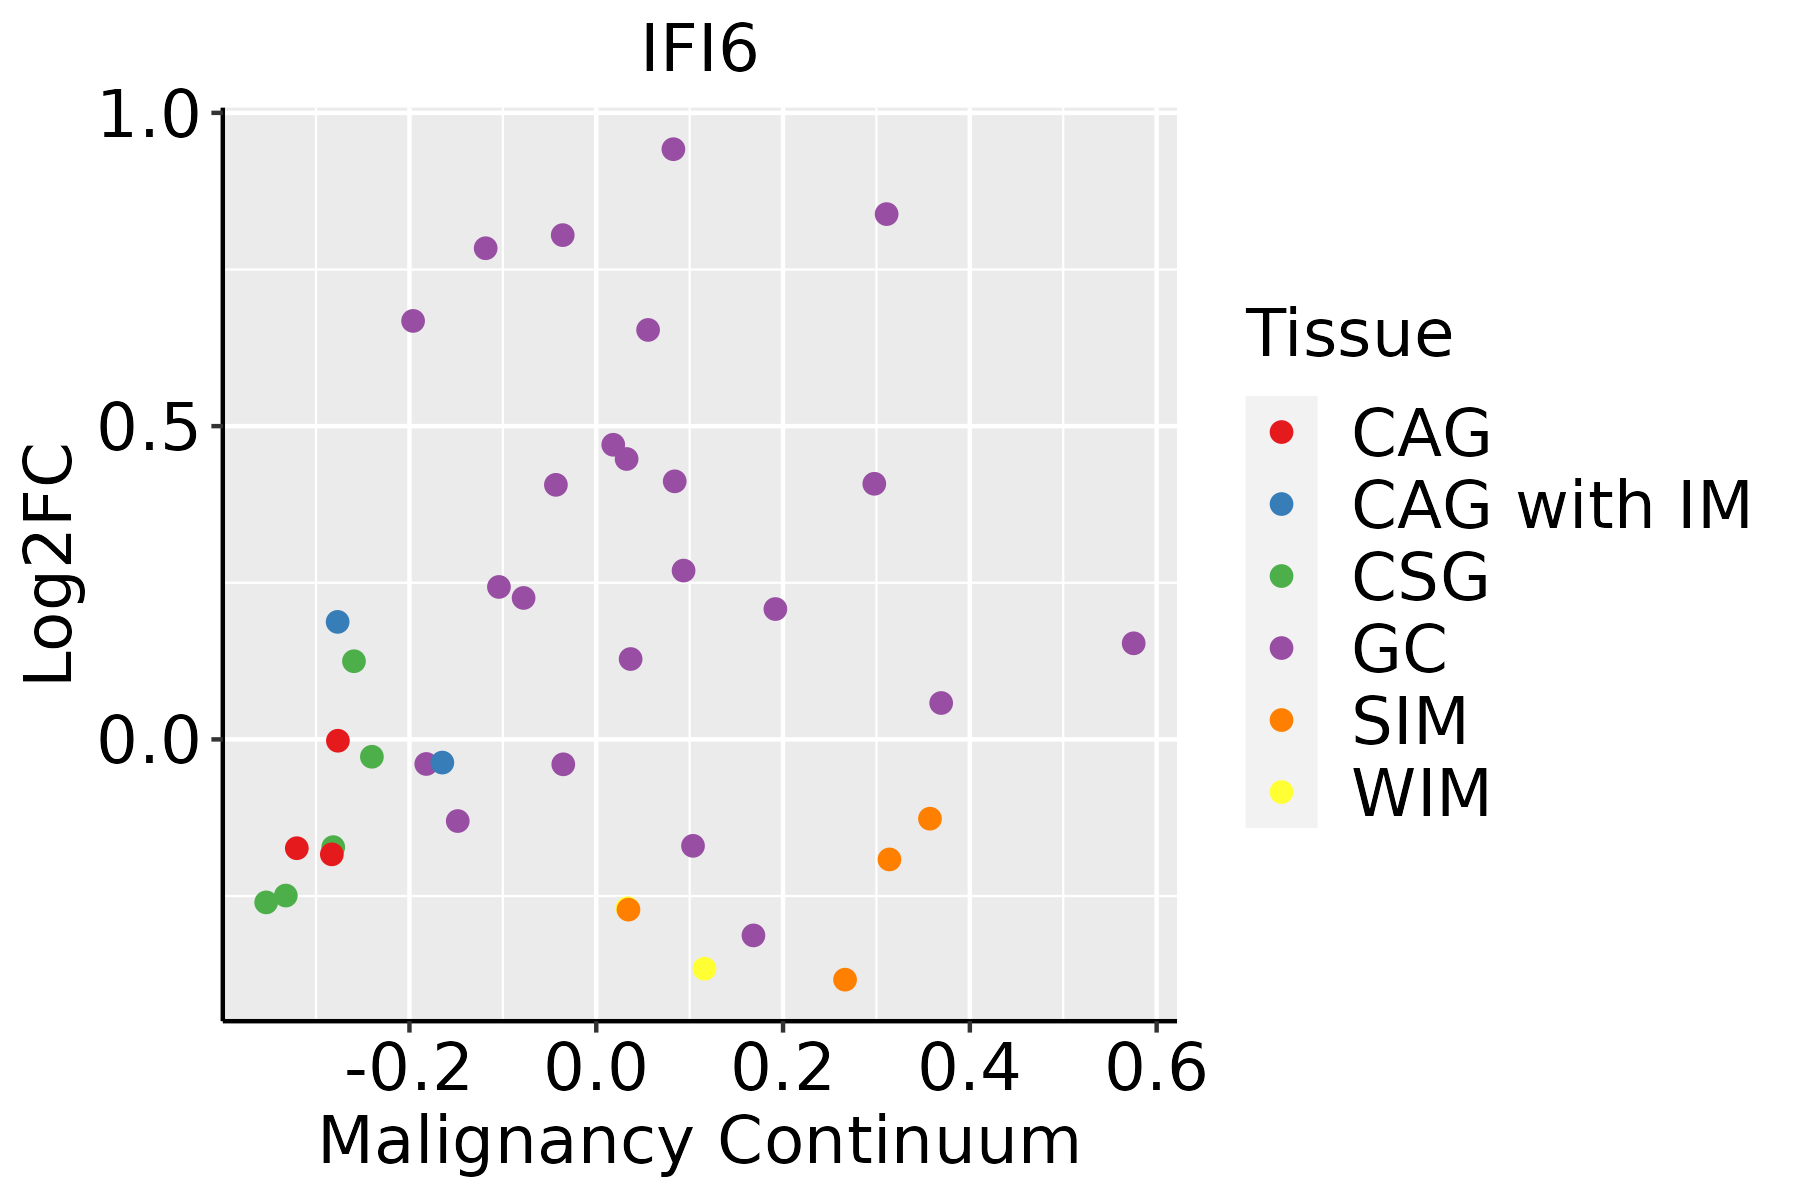 | CAG: Chronic atrophic gastritis |
| CAG with IM: Chronic atrophic gastritis with intestinal metaplasia | ||
| CSG: Chronic superficial gastritis | ||
| GC: Gastric cancer | ||
| SIM: Severe intestinal metaplasia | ||
| WIM: Wild intestinal metaplasia | ||
| Liver |  | HCC: Hepatocellular carcinoma |
| NAFLD: Non-alcoholic fatty liver disease | ||
| Lung | 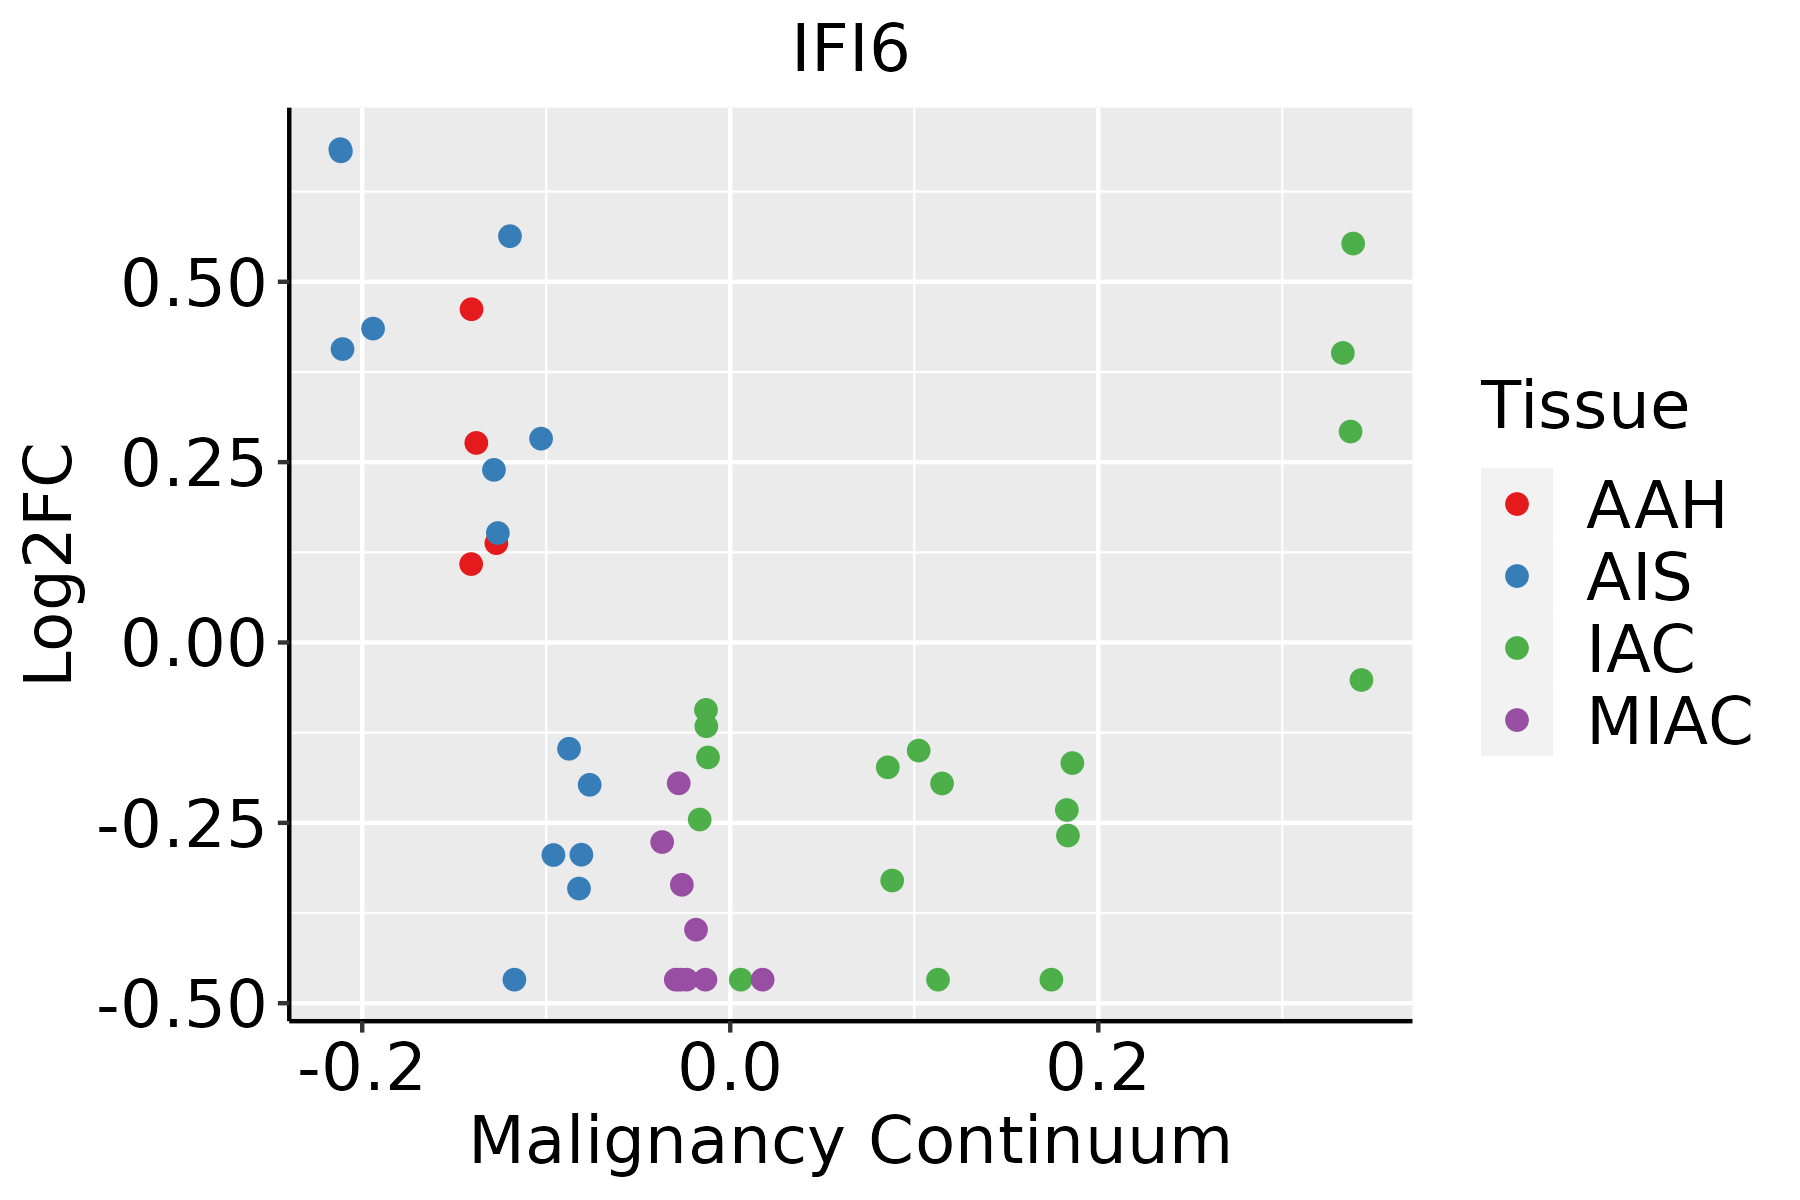 | AAH: Atypical adenomatous hyperplasia |
| AIS: Adenocarcinoma in situ | ||
| IAC: Invasive lung adenocarcinoma | ||
| MIA: Minimally invasive adenocarcinoma | ||
| Oral Cavity | 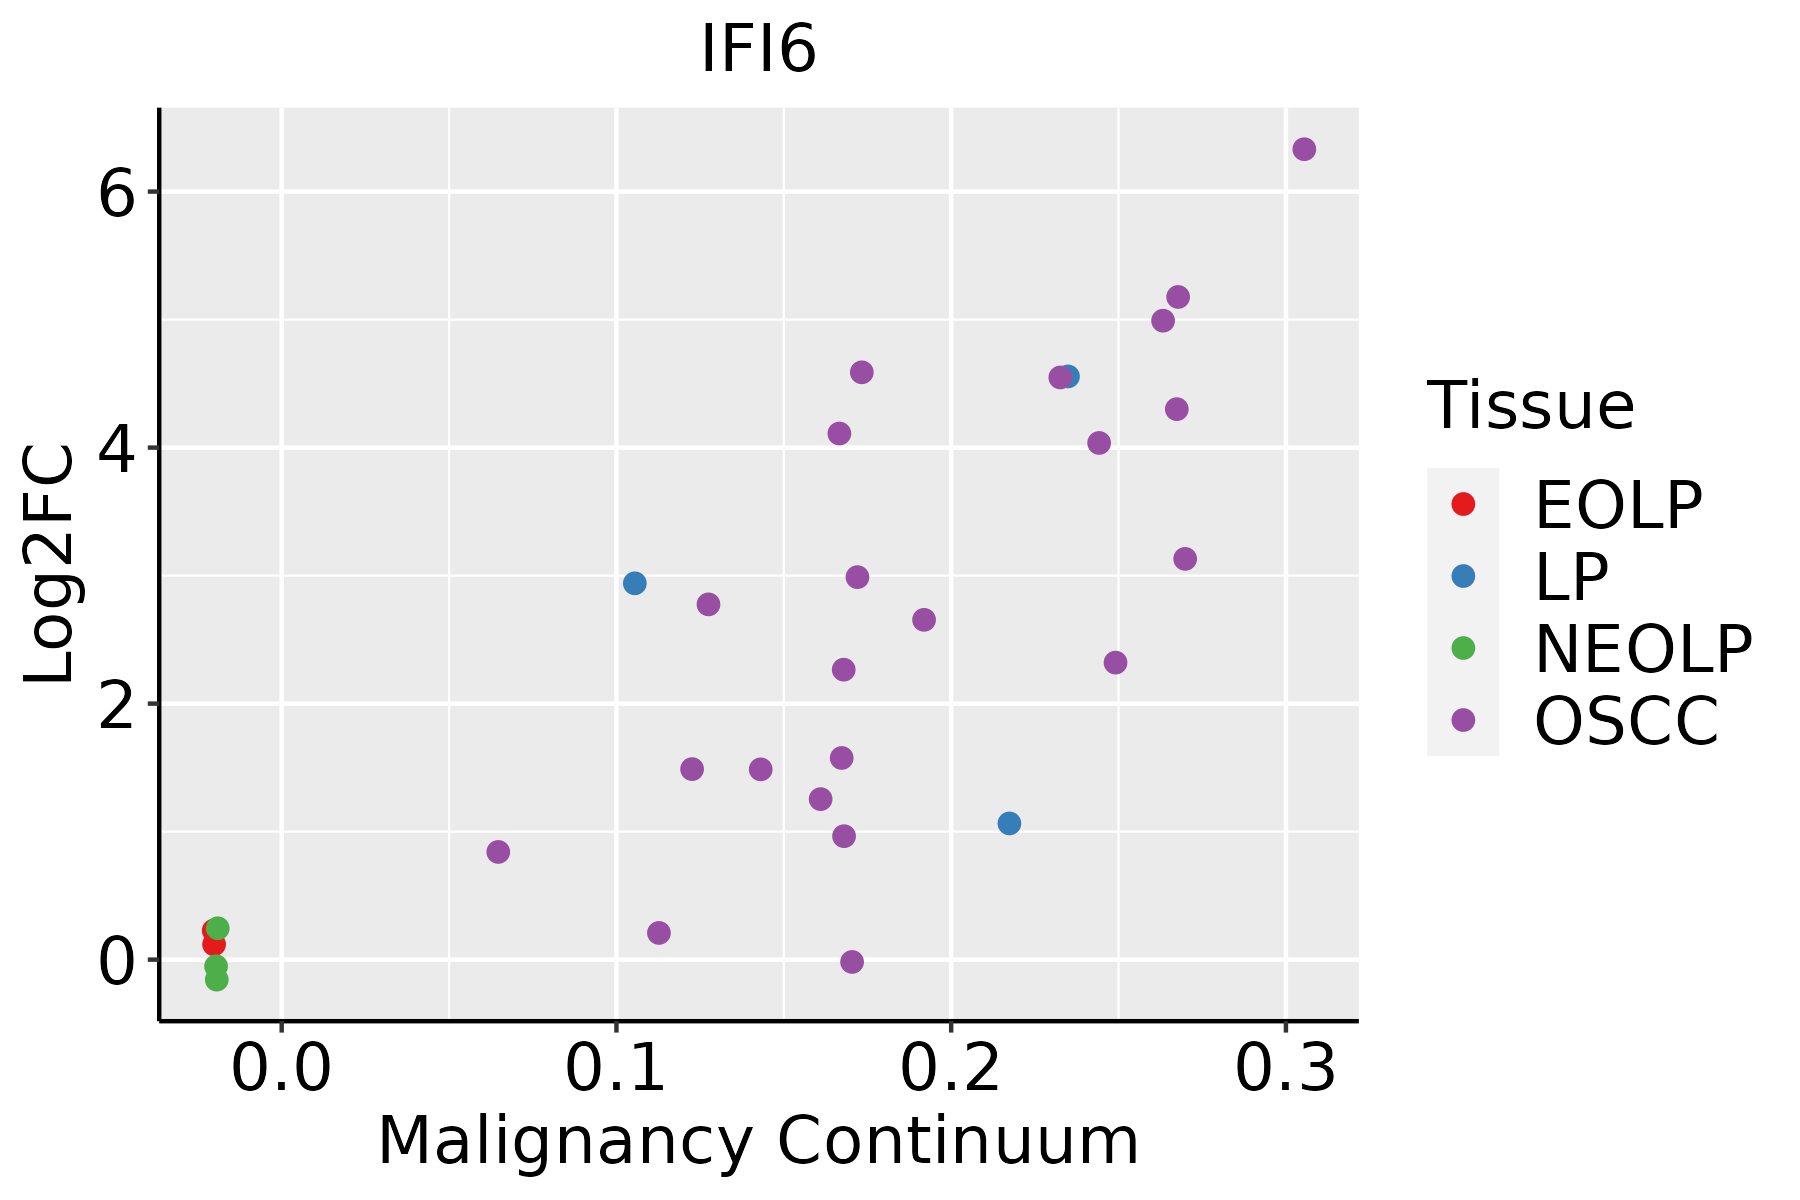 | EOLP: Erosive Oral lichen planus |
| LP: leukoplakia | ||
| NEOLP: Non-erosive oral lichen planus | ||
| OSCC: Oral squamous cell carcinoma | ||
| Prostate |  | BPH: Benign Prostatic Hyperplasia |
| Skin | 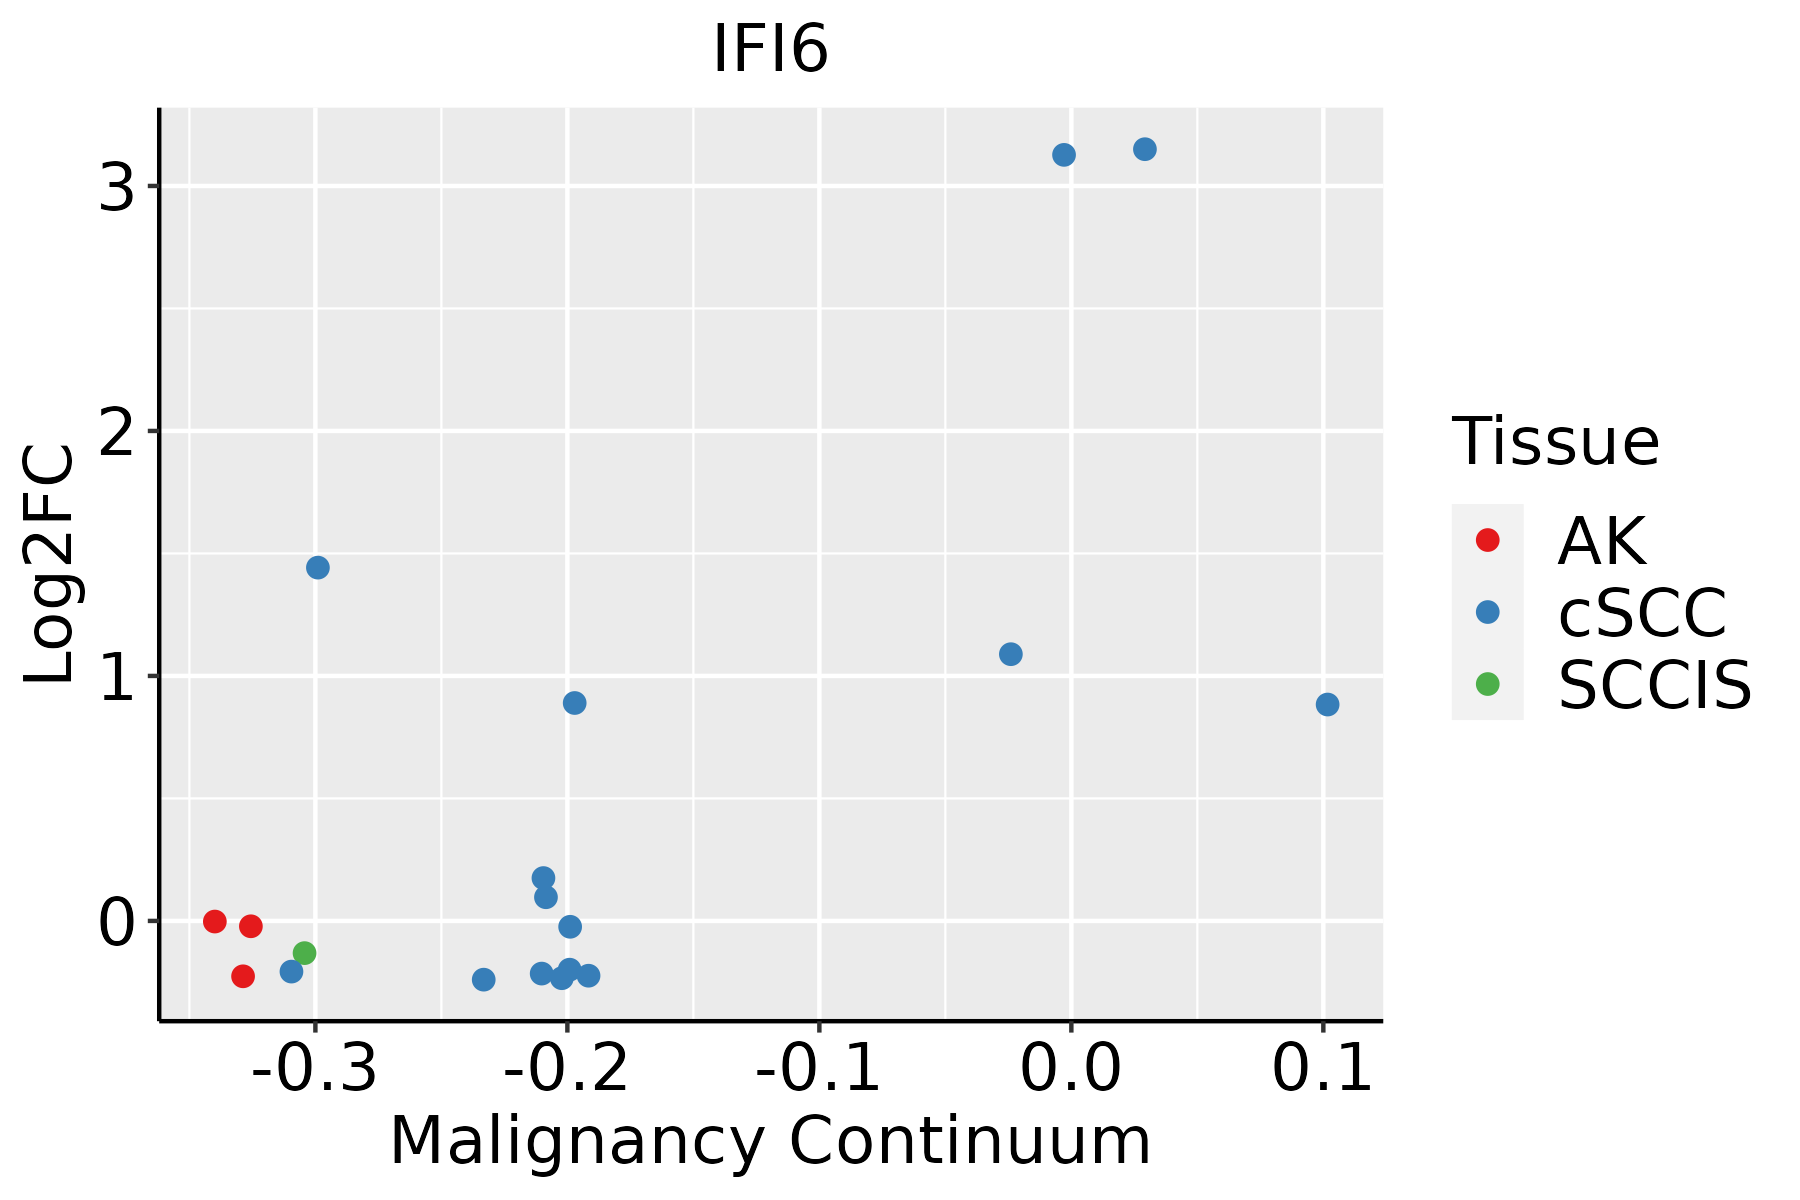 | AK: Actinic keratosis |
| cSCC: Cutaneous squamous cell carcinoma | ||
| SCCIS:squamous cell carcinoma in situ | ||
| Thyroid | 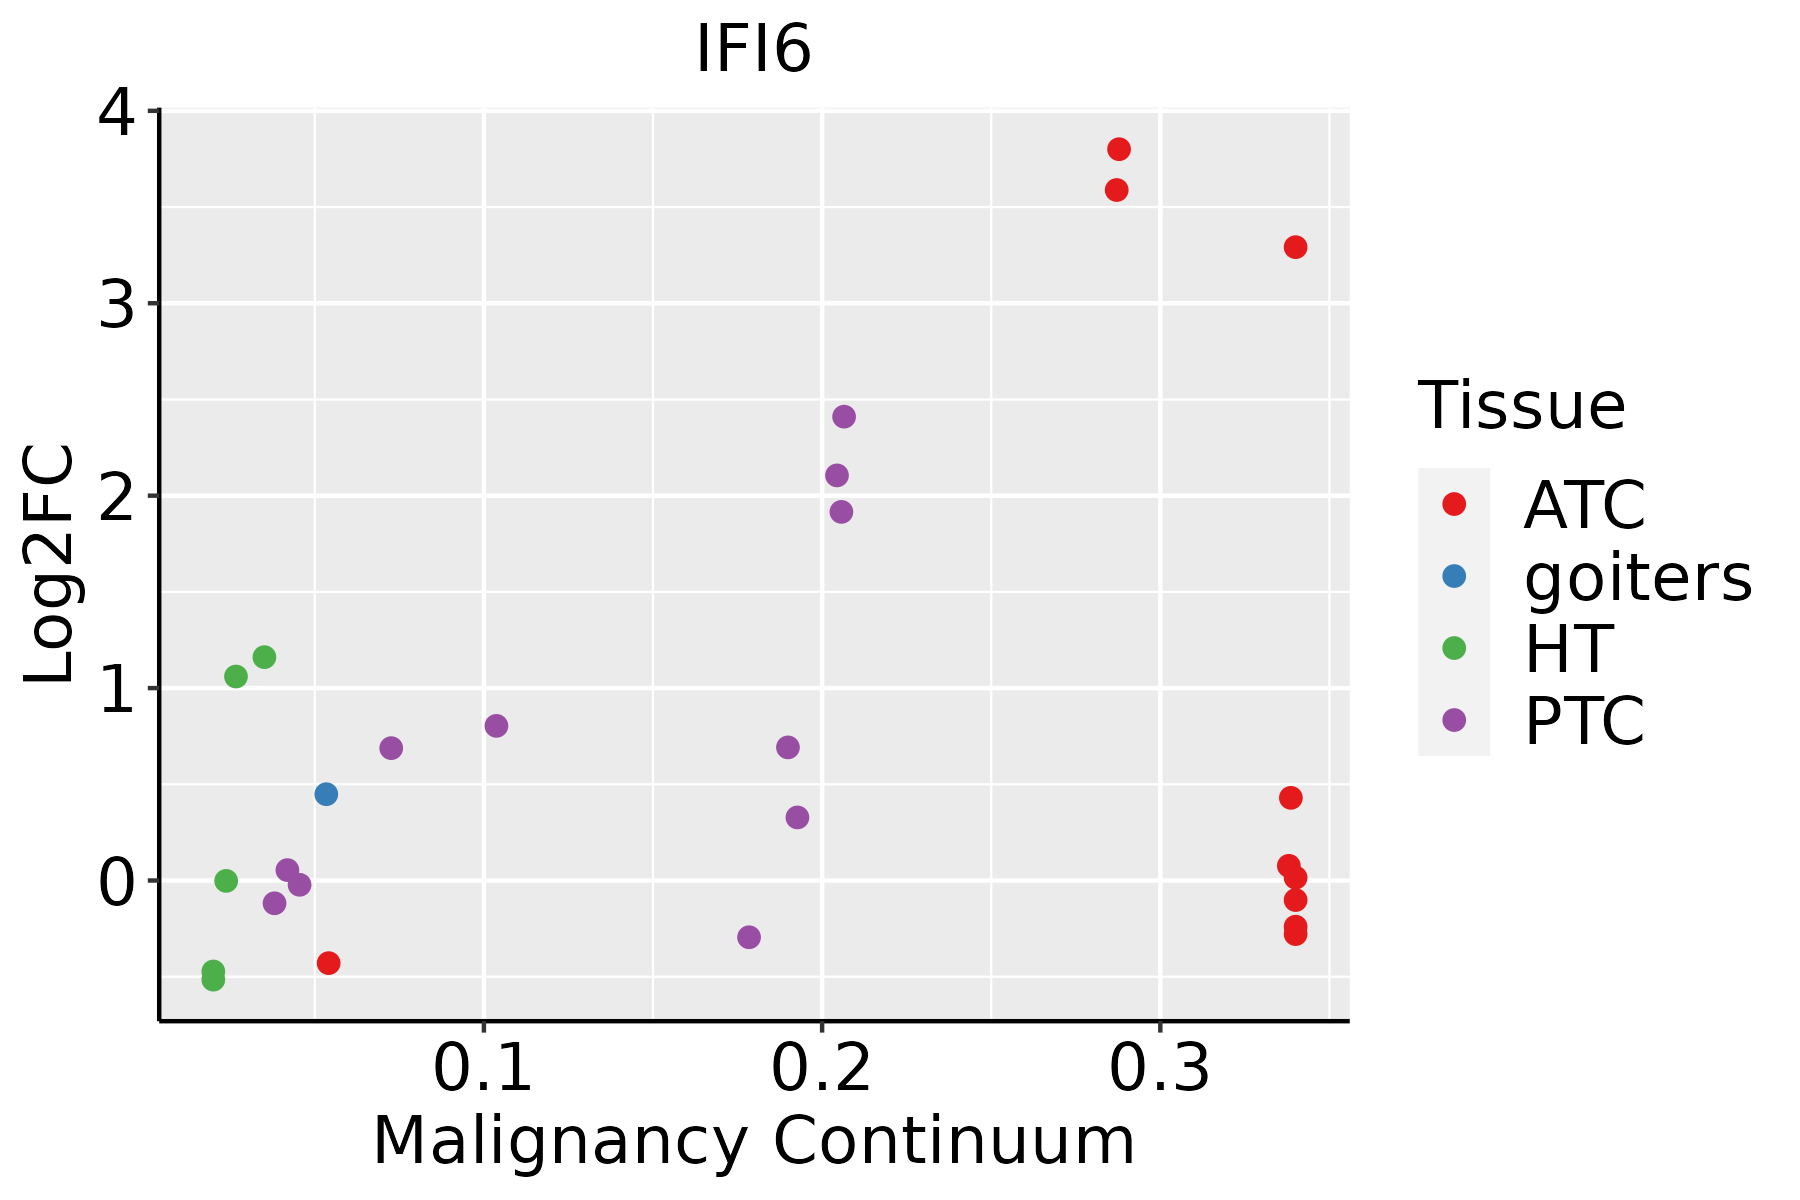 | ATC: Anaplastic thyroid cancer |
| HT: Hashimoto's thyroiditis | ||
| PTC: Papillary thyroid cancer |
| ∗log2FC in expression of this searched gene in stem-like cells from each diseased tissue sample relative to stem-like cells in normal samples in each tissue plotted against the malignancy continuum. Samples are colored based on if they are from different disease stage. |
Top |
Malignant transformation related pathway analysis |
| Find out the enriched GO biological processes and KEGG pathways involved in transition from healthy to precancer to cancer |
| Tissue | Disease Stage | Enriched GO biological Processes |
| Colorectum | AD |  |
| Colorectum | SER |  |
| Colorectum | MSS |  |
| Colorectum | MSI-H |  |
| Colorectum | FAP |  |
| ∗Top 15 enriched GO BP terms are showed in the bar plot of each disease state in each tissue. Each row represents a significant GO biological process which is colored according to the -log10(p.adjust). |
| Page: 1 2 3 4 5 6 7 8 9 |
| GO ID | Tissue | Disease Stage | Description | Gene Ratio | Bg Ratio | pvalue | p.adjust | Count |
| GO:200123314 | Breast | IDC | regulation of apoptotic signaling pathway | 82/1434 | 356/18723 | 6.27e-20 | 5.93e-17 | 82 |
| GO:005254714 | Breast | IDC | regulation of peptidase activity | 96/1434 | 461/18723 | 7.58e-20 | 6.15e-17 | 96 |
| GO:009719314 | Breast | IDC | intrinsic apoptotic signaling pathway | 69/1434 | 288/18723 | 6.32e-18 | 2.99e-15 | 69 |
| GO:005254814 | Breast | IDC | regulation of endopeptidase activity | 88/1434 | 432/18723 | 1.20e-17 | 4.85e-15 | 88 |
| GO:200011614 | Breast | IDC | regulation of cysteine-type endopeptidase activity | 55/1434 | 235/18723 | 4.25e-14 | 1.21e-11 | 55 |
| GO:004586114 | Breast | IDC | negative regulation of proteolysis | 70/1434 | 351/18723 | 8.21e-14 | 2.22e-11 | 70 |
| GO:004328114 | Breast | IDC | regulation of cysteine-type endopeptidase activity involved in apoptotic process | 50/1434 | 209/18723 | 2.49e-13 | 6.14e-11 | 50 |
| GO:005134613 | Breast | IDC | negative regulation of hydrolase activity | 71/1434 | 379/18723 | 1.33e-12 | 2.90e-10 | 71 |
| GO:001046613 | Breast | IDC | negative regulation of peptidase activity | 56/1434 | 262/18723 | 1.39e-12 | 2.92e-10 | 56 |
| GO:200123414 | Breast | IDC | negative regulation of apoptotic signaling pathway | 49/1434 | 224/18723 | 1.45e-11 | 2.58e-09 | 49 |
| GO:001095112 | Breast | IDC | negative regulation of endopeptidase activity | 52/1434 | 252/18723 | 3.53e-11 | 5.57e-09 | 52 |
| GO:200011713 | Breast | IDC | negative regulation of cysteine-type endopeptidase activity | 25/1434 | 86/18723 | 3.31e-09 | 2.77e-07 | 25 |
| GO:000863713 | Breast | IDC | apoptotic mitochondrial changes | 27/1434 | 107/18723 | 2.29e-08 | 1.57e-06 | 27 |
| GO:009719114 | Breast | IDC | extrinsic apoptotic signaling pathway | 42/1434 | 219/18723 | 2.56e-08 | 1.73e-06 | 42 |
| GO:004315413 | Breast | IDC | negative regulation of cysteine-type endopeptidase activity involved in apoptotic process | 22/1434 | 78/18723 | 5.26e-08 | 3.32e-06 | 22 |
| GO:200123614 | Breast | IDC | regulation of extrinsic apoptotic signaling pathway | 32/1434 | 151/18723 | 1.07e-07 | 6.26e-06 | 32 |
| GO:000183613 | Breast | IDC | release of cytochrome c from mitochondria | 17/1434 | 59/18723 | 1.23e-06 | 5.44e-05 | 17 |
| GO:005188113 | Breast | IDC | regulation of mitochondrial membrane potential | 19/1434 | 74/18723 | 2.04e-06 | 8.27e-05 | 19 |
| GO:007259313 | Breast | IDC | reactive oxygen species metabolic process | 36/1434 | 239/18723 | 7.16e-05 | 1.43e-03 | 36 |
| GO:200123714 | Breast | IDC | negative regulation of extrinsic apoptotic signaling pathway | 19/1434 | 97/18723 | 1.22e-04 | 2.25e-03 | 19 |
| Page: 1 2 3 4 5 6 7 8 9 10 11 12 13 14 15 16 17 18 19 20 21 22 23 24 25 26 27 28 29 30 31 32 33 34 35 |
| Pathway ID | Tissue | Disease Stage | Description | Gene Ratio | Bg Ratio | pvalue | p.adjust | qvalue | Count |
| Page: 1 |
Top |
Cell-cell communication analysis |
| Identification of potential cell-cell interactions between two cell types and their ligand-receptor pairs for different disease states |
| Ligand | Receptor | LRpair | Pathway | Tissue | Disease Stage |
| Page: 1 |
Top |
Single-cell gene regulatory network inference analysis |
| Find out the significant the regulons (TFs) and the target genes of each regulon across cell types for different disease states |
| TF | Cell Type | Tissue | Disease Stage | Target Gene | RSS | Regulon Activity |
| ∗The dot plots of a searched regulon are shown for all cell subpopulations in each disease state of each tissue based on the regulon specific score inferred using pySCENIC and by calculating the average expression. |
| Page: 1 |
Top |
Somatic mutation of malignant transformation related genes |
| Annotation of somatic variants for genes involved in malignant transformation |
| Hugo Symbol | Variant Class | Variant Classification | dbSNP RS | HGVSc | HGVSp | HGVSp Short | SWISSPROT | BIOTYPE | SIFT | PolyPhen | Tumor Sample Barcode | Tissue | Histology | Sex | Age | Stage | Therapy Types | Drugs | Outcome |
| IFI6 | insertion | Frame_Shift_Ins | novel | c.352_353insT | p.Asn118IlefsTer16 | p.N118Ifs*16 | P09912 | protein_coding | TCGA-E9-A22H-01 | Breast | breast invasive carcinoma | Female | <65 | I/II | Chemotherapy | doxorubicin | SD | ||
| IFI6 | insertion | In_Frame_Ins | novel | c.350_351insCACCAA | p.Gly117_Asn118insThrAsn | p.G117_N118insTN | P09912 | protein_coding | TCGA-E9-A22H-01 | Breast | breast invasive carcinoma | Female | <65 | I/II | Chemotherapy | doxorubicin | SD | ||
| IFI6 | SNV | Missense_Mutation | novel | c.239N>A | p.Ala80Asp | p.A80D | P09912 | protein_coding | deleterious(0) | probably_damaging(0.998) | TCGA-5M-AAT4-01 | Colorectum | colon adenocarcinoma | Male | >=65 | III/IV | Unknown | Unknown | PD |
| IFI6 | SNV | Missense_Mutation | novel | c.349N>T | p.Gly117Cys | p.G117C | P09912 | protein_coding | deleterious(0.01) | probably_damaging(0.923) | TCGA-AA-3811-01 | Colorectum | colon adenocarcinoma | Female | >=65 | III/IV | Unknown | Unknown | PD |
| IFI6 | SNV | Missense_Mutation | c.50N>T | p.Thr17Ile | p.T17I | P09912 | protein_coding | deleterious_low_confidence(0) | possibly_damaging(0.525) | TCGA-AU-6004-01 | Colorectum | colon adenocarcinoma | Female | >=65 | I/II | Unknown | Unknown | SD | |
| IFI6 | deletion | Frame_Shift_Del | novel | c.48_52delNNNNN | p.Phe16LeufsTer8 | p.F16Lfs*8 | P09912 | protein_coding | TCGA-AA-3877-01 | Colorectum | colon adenocarcinoma | Female | >=65 | I/II | Unknown | Unknown | SD | ||
| IFI6 | SNV | Missense_Mutation | novel | c.91N>A | p.Ala31Thr | p.A31T | P09912 | protein_coding | tolerated(0.51) | benign(0.003) | TCGA-AP-A0LM-01 | Endometrium | uterine corpus endometrioid carcinoma | Female | <65 | III/IV | Chemotherapy | cisplatin | SD |
| IFI6 | SNV | Missense_Mutation | novel | c.376N>A | p.Ala126Thr | p.A126T | P09912 | protein_coding | tolerated(1) | benign(0) | TCGA-AP-A1DV-01 | Endometrium | uterine corpus endometrioid carcinoma | Female | <65 | I/II | Unknown | Unknown | SD |
| IFI6 | SNV | Missense_Mutation | c.332G>A | p.Gly111Asp | p.G111D | P09912 | protein_coding | deleterious(0) | possibly_damaging(0.8) | TCGA-B5-A11E-01 | Endometrium | uterine corpus endometrioid carcinoma | Female | <65 | I/II | Unknown | Unknown | SD | |
| IFI6 | SNV | Missense_Mutation | novel | c.44T>C | p.Leu15Pro | p.L15P | P09912 | protein_coding | deleterious(0) | probably_damaging(0.976) | TCGA-FI-A2D0-01 | Endometrium | uterine corpus endometrioid carcinoma | Female | <65 | I/II | Unknown | Unknown | SD |
| Page: 1 2 |
Top |
Related drugs of malignant transformation related genes |
| Identification of chemicals and drugs interact with genes involved in malignant transfromation |
| (DGIdb 4.0) |
| Entrez ID | Symbol | Category | Interaction Types | Drug Claim Name | Drug Name | PMIDs |
| Page: 1 |

Copyright 2023-Present -The University of Texas Health Science Center at Houston |