
|
|||||
|
 | |
| |
| |
| |
| |
| |
|
Gene: IFI44L |
Gene summary for IFI44L |
| Gene information | Species | Human | Gene symbol | IFI44L | Gene ID | 10964 |
| Gene name | interferon induced protein 44 like | |
| Gene Alias | C1orf29 | |
| Cytomap | 1p31.1 | |
| Gene Type | protein-coding | GO ID | GO:0002376 | UniProtAcc | Q53G44 |
Top |
Malignant transformation analysis |
| Identification of the aberrant gene expression in precancerous and cancerous lesions by comparing the gene expression of stem-like cells in diseased tissues with normal stem cells |
| Entrez ID | Symbol | Replicates | Species | Organ | Tissue | Adj P-value | Log2FC | Malignancy |
| 10964 | IFI44L | CA_HPV_1 | Human | Cervix | CC | 8.07e-34 | 9.30e-01 | 0.0264 |
| 10964 | IFI44L | CA_HPV_2 | Human | Cervix | CC | 3.05e-19 | 5.30e-01 | 0.0391 |
| 10964 | IFI44L | CCI_2 | Human | Cervix | CC | 8.49e-04 | 4.65e-01 | 0.5249 |
| 10964 | IFI44L | CCI_3 | Human | Cervix | CC | 2.65e-02 | 4.06e-01 | 0.516 |
| 10964 | IFI44L | Tumor | Human | Cervix | CC | 2.97e-30 | 5.61e-01 | 0.1241 |
| 10964 | IFI44L | sample3 | Human | Cervix | CC | 4.71e-39 | 7.18e-01 | 0.1387 |
| 10964 | IFI44L | H2 | Human | Cervix | HSIL_HPV | 1.52e-05 | 2.85e-01 | 0.0632 |
| 10964 | IFI44L | T3 | Human | Cervix | CC | 1.22e-43 | 7.07e-01 | 0.1389 |
| 10964 | IFI44L | LZE5T | Human | Esophagus | ESCC | 1.05e-04 | 5.21e-01 | 0.0514 |
| 10964 | IFI44L | LZE8T | Human | Esophagus | ESCC | 5.65e-03 | 1.61e-01 | 0.067 |
| 10964 | IFI44L | LZE20T | Human | Esophagus | ESCC | 5.40e-12 | 5.67e-01 | 0.0662 |
| 10964 | IFI44L | LZE24T | Human | Esophagus | ESCC | 5.89e-30 | 9.82e-01 | 0.0596 |
| 10964 | IFI44L | P1T-E | Human | Esophagus | ESCC | 7.34e-06 | 8.08e-01 | 0.0875 |
| 10964 | IFI44L | P2T-E | Human | Esophagus | ESCC | 6.15e-58 | 1.26e+00 | 0.1177 |
| 10964 | IFI44L | P5T-E | Human | Esophagus | ESCC | 2.36e-13 | 3.69e-01 | 0.1327 |
| 10964 | IFI44L | P8T-E | Human | Esophagus | ESCC | 7.10e-26 | 6.57e-01 | 0.0889 |
| 10964 | IFI44L | P9T-E | Human | Esophagus | ESCC | 5.53e-34 | 9.52e-01 | 0.1131 |
| 10964 | IFI44L | P11T-E | Human | Esophagus | ESCC | 4.57e-20 | 1.01e+00 | 0.1426 |
| 10964 | IFI44L | P15T-E | Human | Esophagus | ESCC | 1.23e-12 | 5.13e-01 | 0.1149 |
| 10964 | IFI44L | P17T-E | Human | Esophagus | ESCC | 3.27e-16 | 1.04e+00 | 0.1278 |
| Page: 1 2 3 4 5 |
| Tissue | Expression Dynamics | Abbreviation |
| Cervix | 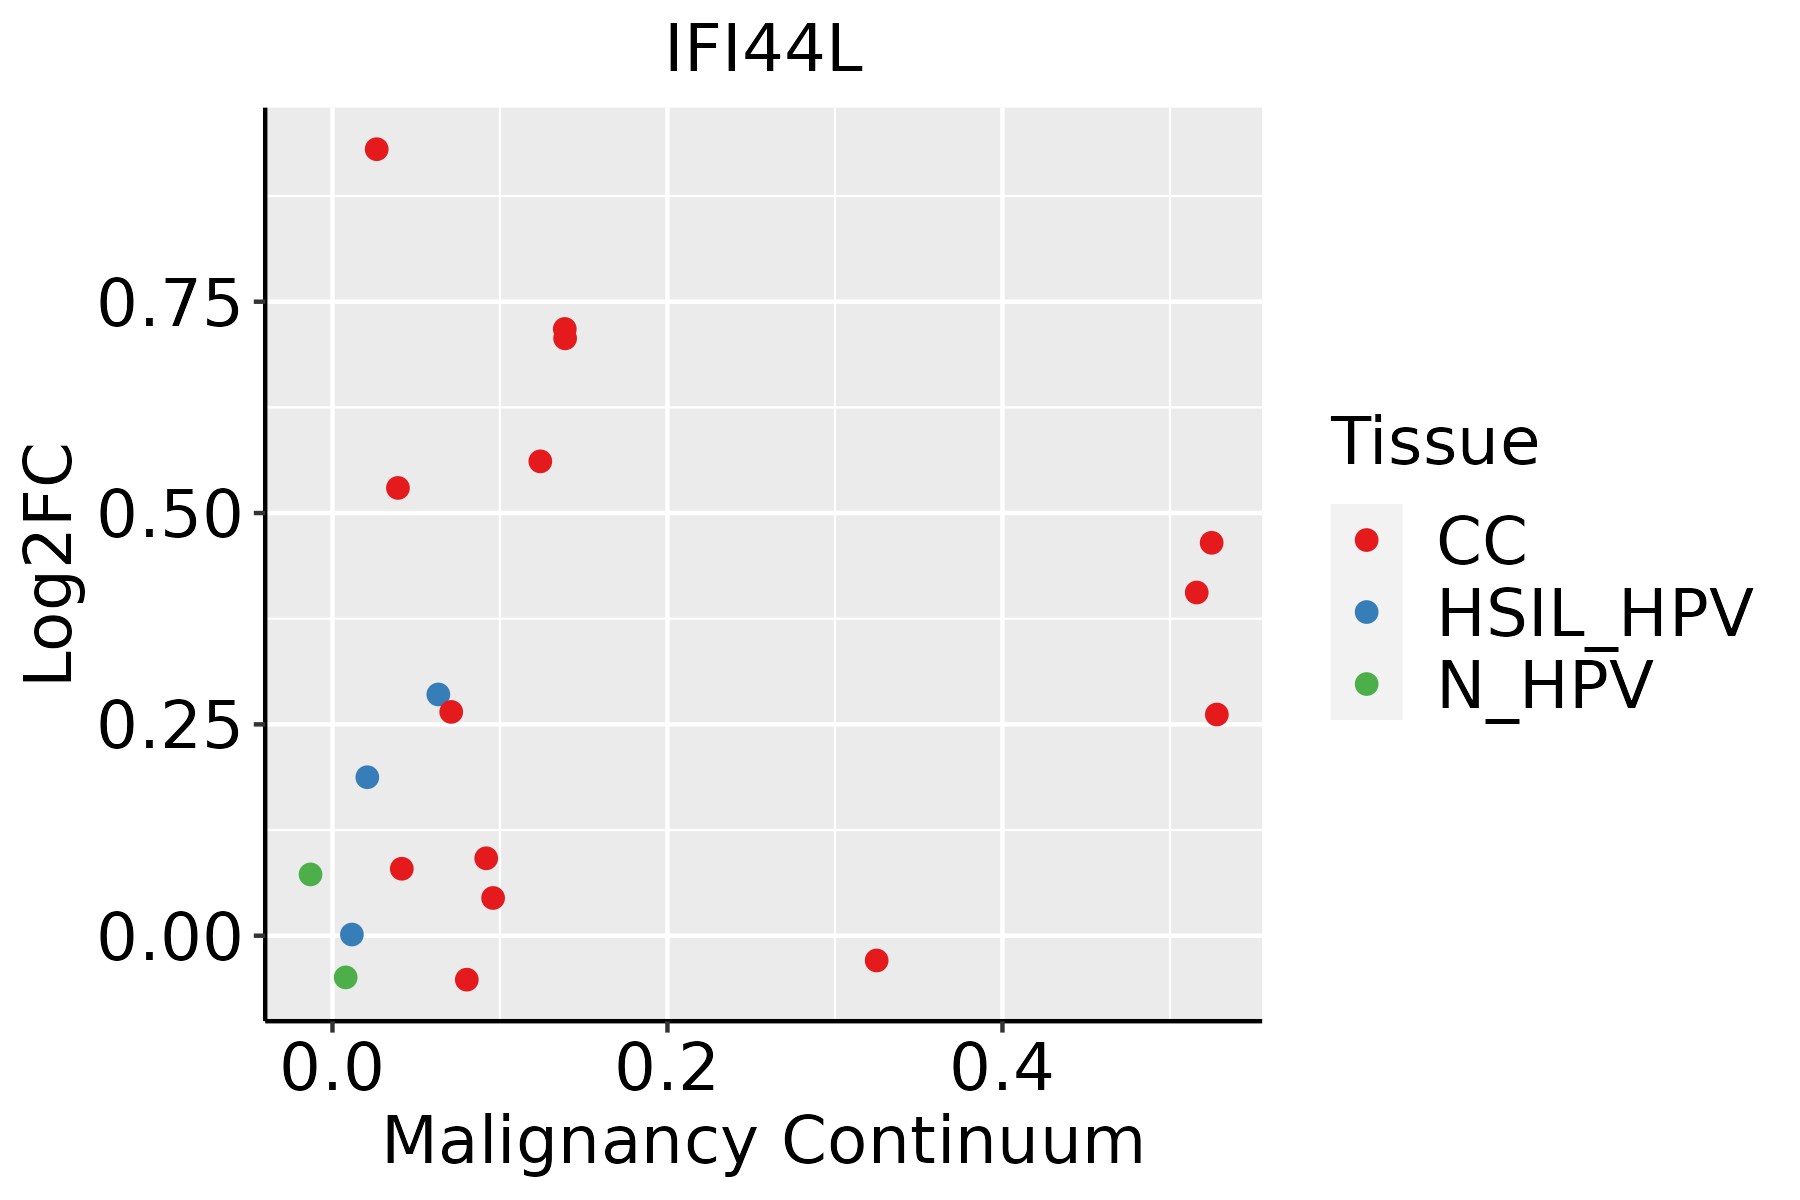 | CC: Cervix cancer |
| HSIL_HPV: HPV-infected high-grade squamous intraepithelial lesions | ||
| N_HPV: HPV-infected normal cervix | ||
| Esophagus | 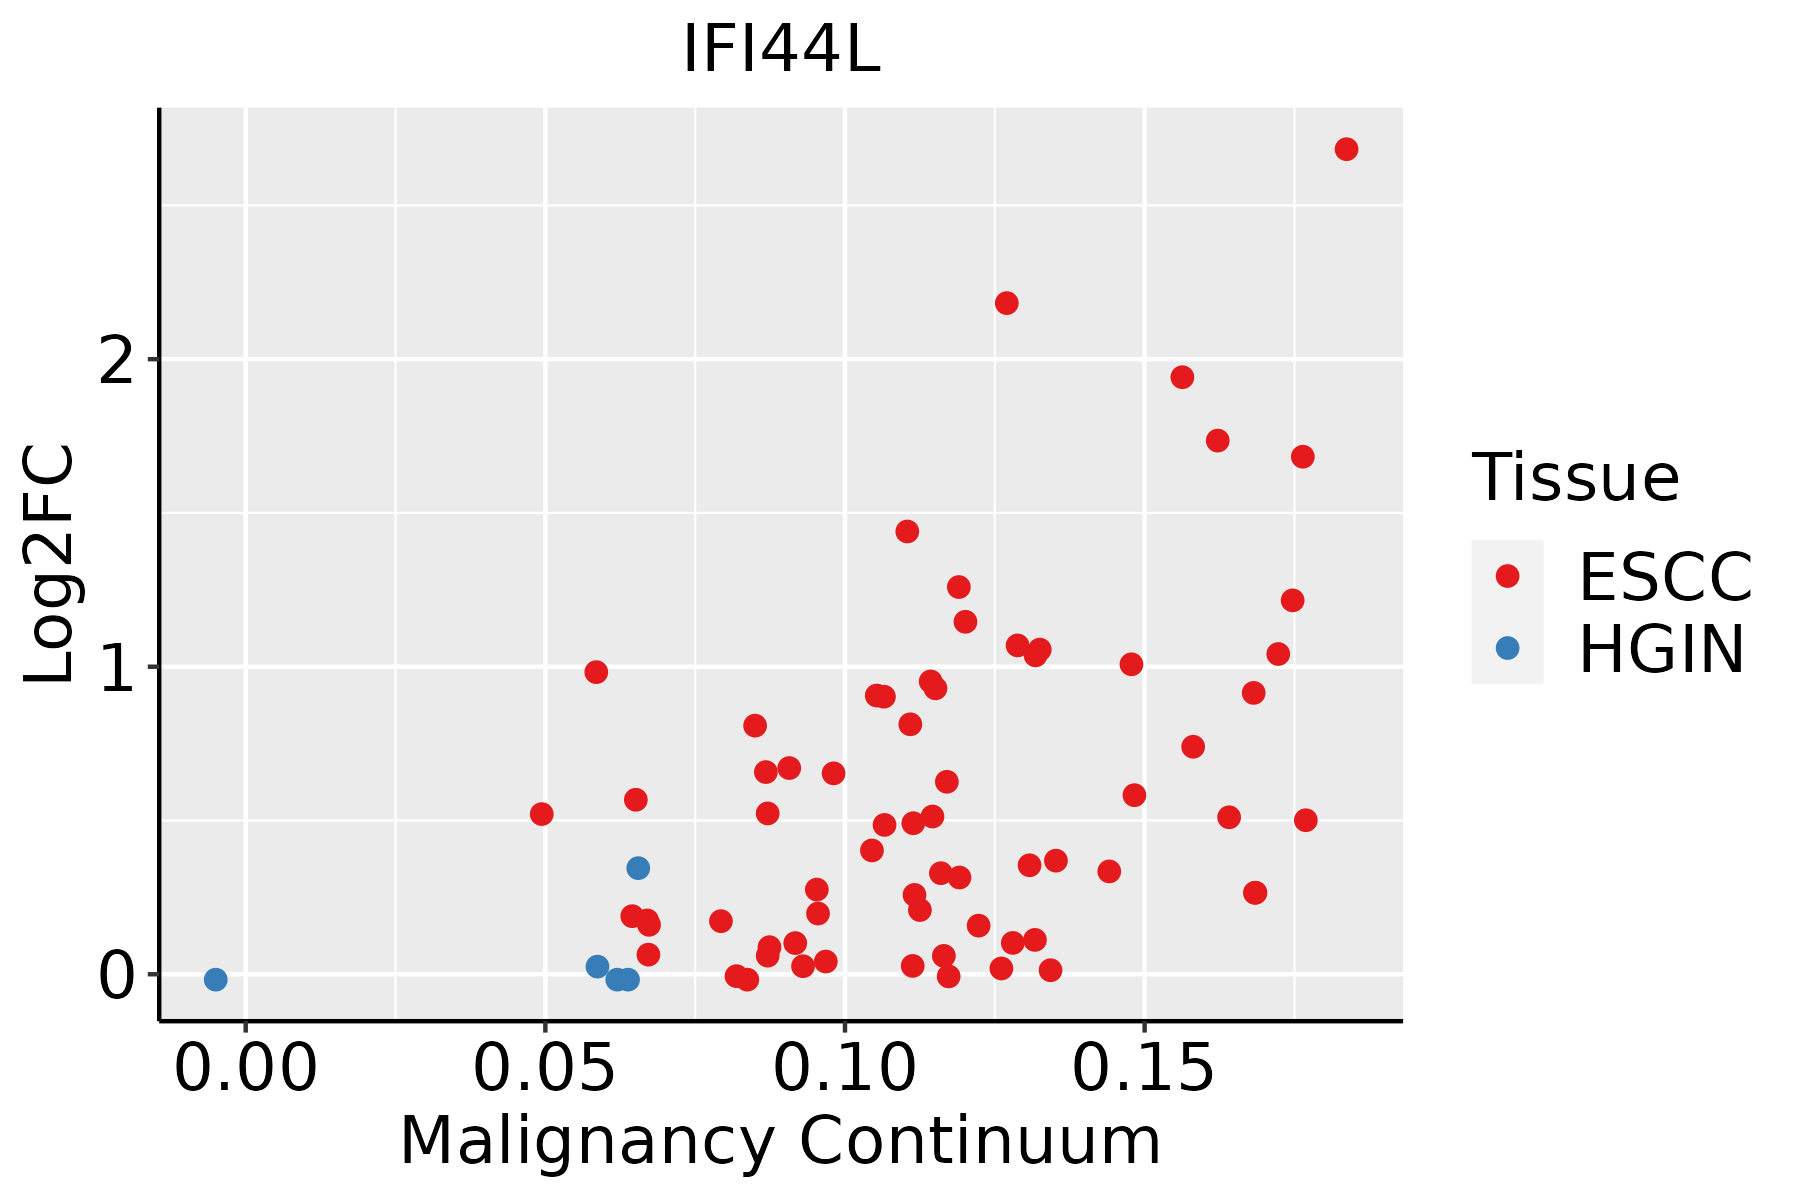 | ESCC: Esophageal squamous cell carcinoma |
| HGIN: High-grade intraepithelial neoplasias | ||
| LGIN: Low-grade intraepithelial neoplasias | ||
| Liver |  | HCC: Hepatocellular carcinoma |
| NAFLD: Non-alcoholic fatty liver disease | ||
| Oral Cavity | 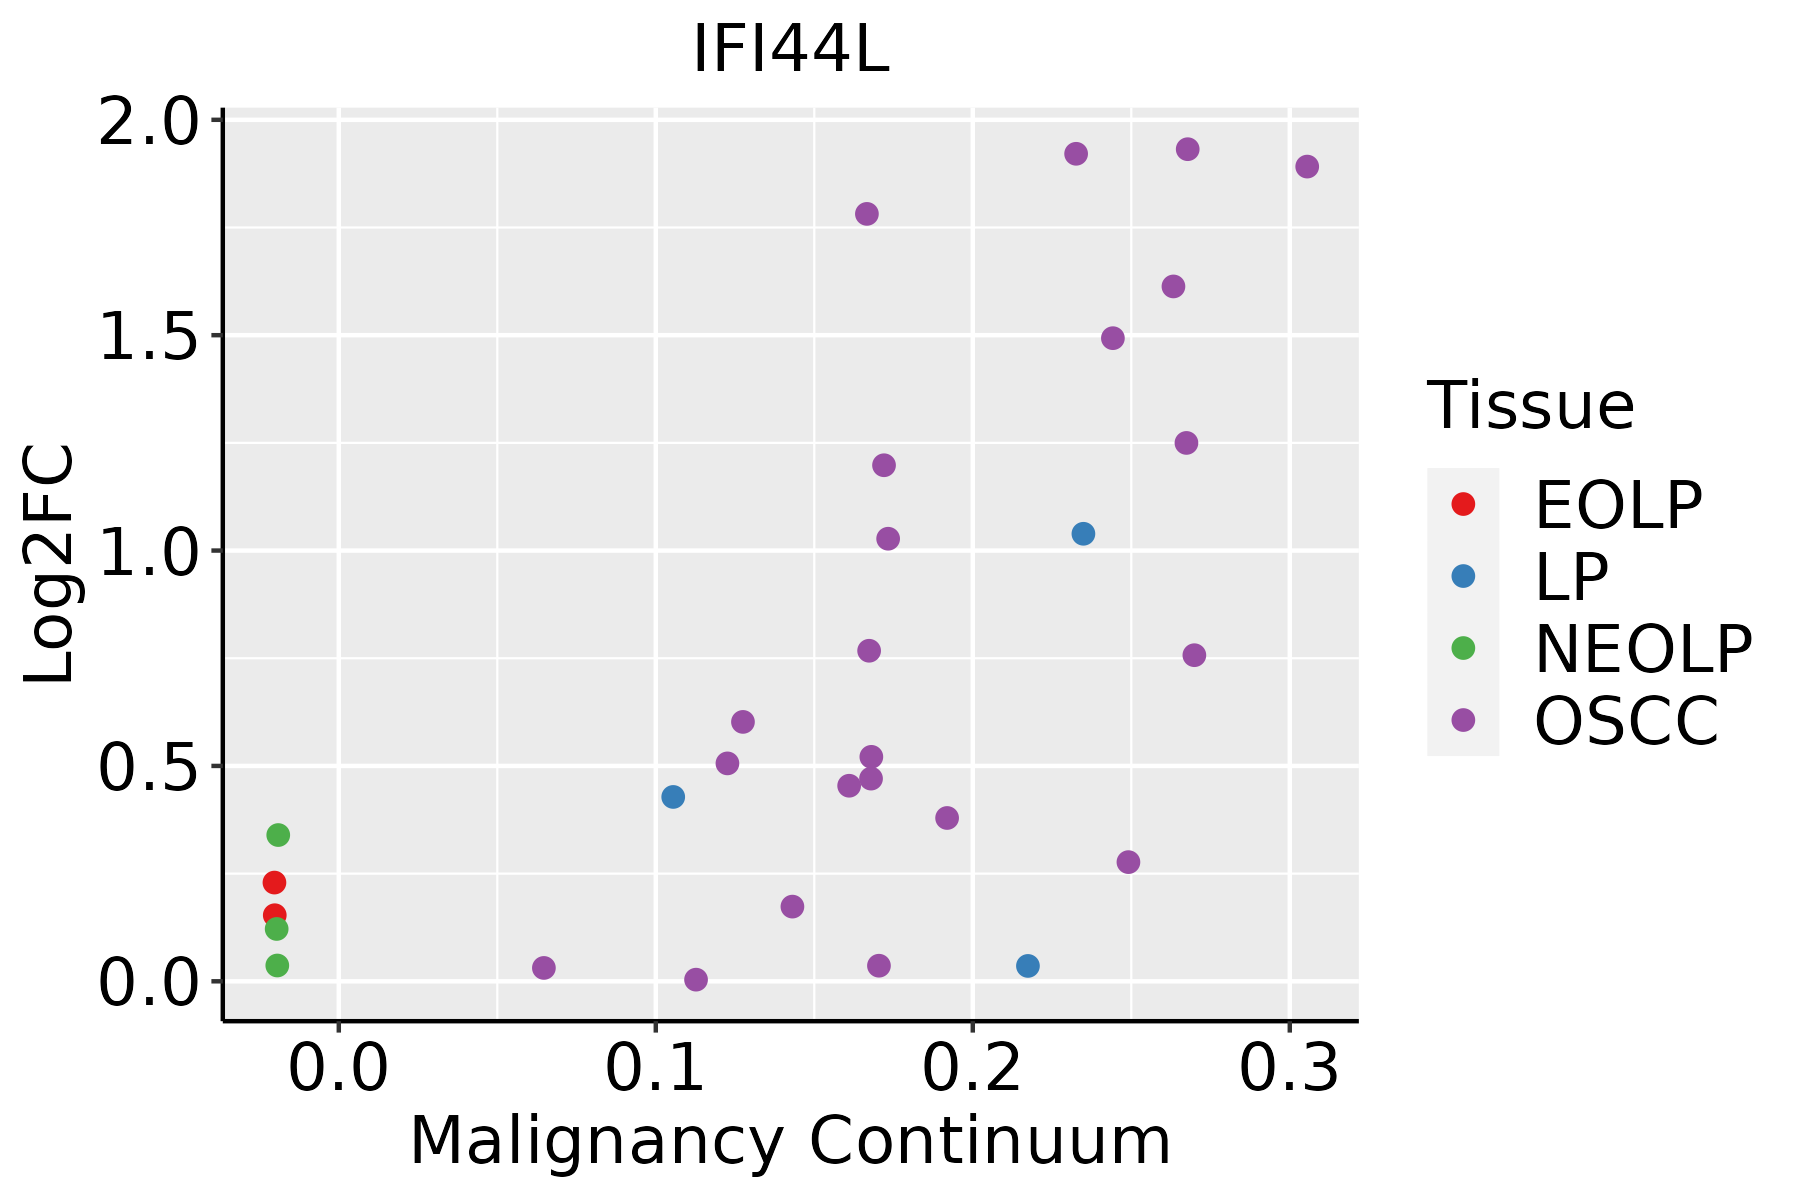 | EOLP: Erosive Oral lichen planus |
| LP: leukoplakia | ||
| NEOLP: Non-erosive oral lichen planus | ||
| OSCC: Oral squamous cell carcinoma | ||
| Skin | 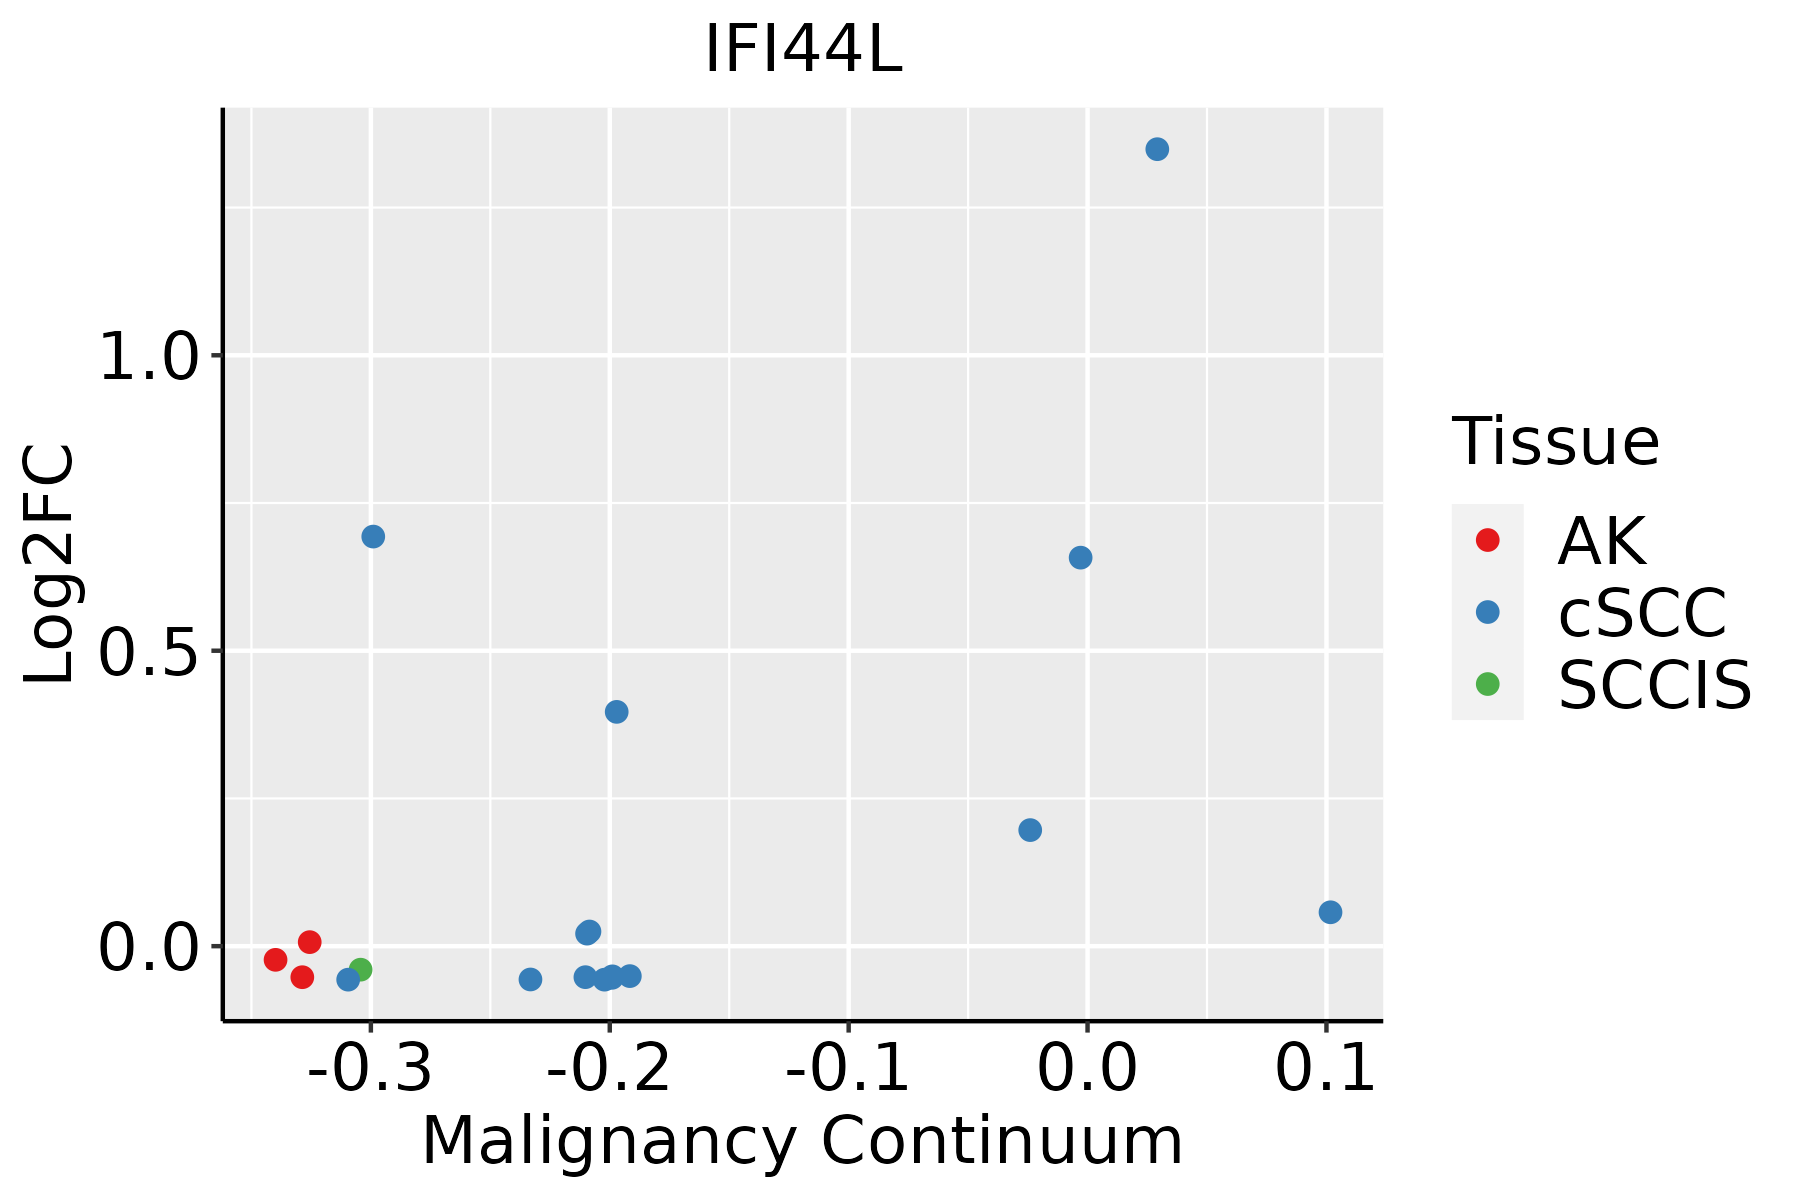 | AK: Actinic keratosis |
| cSCC: Cutaneous squamous cell carcinoma | ||
| SCCIS:squamous cell carcinoma in situ | ||
| Thyroid |  | ATC: Anaplastic thyroid cancer |
| HT: Hashimoto's thyroiditis | ||
| PTC: Papillary thyroid cancer |
| ∗log2FC in expression of this searched gene in stem-like cells from each diseased tissue sample relative to stem-like cells in normal samples in each tissue plotted against the malignancy continuum. Samples are colored based on if they are from different disease stage. |
Top |
Malignant transformation related pathway analysis |
| Find out the enriched GO biological processes and KEGG pathways involved in transition from healthy to precancer to cancer |
| Tissue | Disease Stage | Enriched GO biological Processes |
| Colorectum | AD |  |
| Colorectum | SER |  |
| Colorectum | MSS |  |
| Colorectum | MSI-H |  |
| Colorectum | FAP |  |
| ∗Top 15 enriched GO BP terms are showed in the bar plot of each disease state in each tissue. Each row represents a significant GO biological process which is colored according to the -log10(p.adjust). |
| Page: 1 2 3 4 5 6 7 8 9 |
| GO ID | Tissue | Disease Stage | Description | Gene Ratio | Bg Ratio | pvalue | p.adjust | Count |
| GO:00096158 | Cervix | CC | response to virus | 73/2311 | 367/18723 | 2.22e-05 | 3.95e-04 | 73 |
| GO:00516072 | Cervix | CC | defense response to virus | 46/2311 | 265/18723 | 1.04e-02 | 4.97e-02 | 46 |
| GO:01405462 | Cervix | CC | defense response to symbiont | 46/2311 | 265/18723 | 1.04e-02 | 4.97e-02 | 46 |
| GO:000961518 | Esophagus | ESCC | response to virus | 238/8552 | 367/18723 | 6.65e-14 | 3.32e-12 | 238 |
| GO:00516075 | Esophagus | ESCC | defense response to virus | 171/8552 | 265/18723 | 3.91e-10 | 1.05e-08 | 171 |
| GO:01405465 | Esophagus | ESCC | defense response to symbiont | 171/8552 | 265/18723 | 3.91e-10 | 1.05e-08 | 171 |
| GO:00096155 | Liver | Cirrhotic | response to virus | 126/4634 | 367/18723 | 2.10e-05 | 2.77e-04 | 126 |
| GO:0051607 | Liver | Cirrhotic | defense response to virus | 84/4634 | 265/18723 | 6.02e-03 | 3.00e-02 | 84 |
| GO:0140546 | Liver | Cirrhotic | defense response to symbiont | 84/4634 | 265/18723 | 6.02e-03 | 3.00e-02 | 84 |
| GO:000961511 | Liver | HCC | response to virus | 210/7958 | 367/18723 | 7.32e-09 | 1.86e-07 | 210 |
| GO:00516071 | Liver | HCC | defense response to virus | 151/7958 | 265/18723 | 1.27e-06 | 1.85e-05 | 151 |
| GO:01405461 | Liver | HCC | defense response to symbiont | 151/7958 | 265/18723 | 1.27e-06 | 1.85e-05 | 151 |
| GO:000961515 | Oral cavity | OSCC | response to virus | 215/7305 | 367/18723 | 1.63e-14 | 9.41e-13 | 215 |
| GO:00516074 | Oral cavity | OSCC | defense response to virus | 154/7305 | 265/18723 | 1.96e-10 | 5.63e-09 | 154 |
| GO:01405464 | Oral cavity | OSCC | defense response to symbiont | 154/7305 | 265/18723 | 1.96e-10 | 5.63e-09 | 154 |
| GO:000961516 | Oral cavity | LP | response to virus | 143/4623 | 367/18723 | 7.42e-10 | 3.52e-08 | 143 |
| GO:005160711 | Oral cavity | LP | defense response to virus | 97/4623 | 265/18723 | 9.31e-06 | 1.74e-04 | 97 |
| GO:014054611 | Oral cavity | LP | defense response to symbiont | 97/4623 | 265/18723 | 9.31e-06 | 1.74e-04 | 97 |
| GO:000961521 | Oral cavity | EOLP | response to virus | 81/2218 | 367/18723 | 1.71e-08 | 7.66e-07 | 81 |
| GO:005160721 | Oral cavity | EOLP | defense response to virus | 55/2218 | 265/18723 | 2.16e-05 | 3.35e-04 | 55 |
| Page: 1 2 |
| Pathway ID | Tissue | Disease Stage | Description | Gene Ratio | Bg Ratio | pvalue | p.adjust | qvalue | Count |
| Page: 1 |
Top |
Cell-cell communication analysis |
| Identification of potential cell-cell interactions between two cell types and their ligand-receptor pairs for different disease states |
| Ligand | Receptor | LRpair | Pathway | Tissue | Disease Stage |
| Page: 1 |
Top |
Single-cell gene regulatory network inference analysis |
| Find out the significant the regulons (TFs) and the target genes of each regulon across cell types for different disease states |
| TF | Cell Type | Tissue | Disease Stage | Target Gene | RSS | Regulon Activity |
| ∗The dot plots of a searched regulon are shown for all cell subpopulations in each disease state of each tissue based on the regulon specific score inferred using pySCENIC and by calculating the average expression. |
| Page: 1 |
Top |
Somatic mutation of malignant transformation related genes |
| Annotation of somatic variants for genes involved in malignant transformation |
| Hugo Symbol | Variant Class | Variant Classification | dbSNP RS | HGVSc | HGVSp | HGVSp Short | SWISSPROT | BIOTYPE | SIFT | PolyPhen | Tumor Sample Barcode | Tissue | Histology | Sex | Age | Stage | Therapy Types | Drugs | Outcome |
| IFI44L | SNV | Missense_Mutation | c.1213N>C | p.Ala405Pro | p.A405P | Q53G44 | protein_coding | deleterious(0.02) | possibly_damaging(0.9) | TCGA-D8-A147-01 | Breast | breast invasive carcinoma | Female | <65 | I/II | Chemotherapy | doxorubicine | SD | |
| IFI44L | insertion | Frame_Shift_Ins | novel | c.262_263insTACTTTCAGTGAGTTCTTTATTCACTGACTCAATT | p.Gln88LeufsTer21 | p.Q88Lfs*21 | Q53G44 | protein_coding | TCGA-AR-A0U0-01 | Breast | breast invasive carcinoma | Female | >=65 | I/II | Unknown | Unknown | SD | ||
| IFI44L | SNV | Missense_Mutation | rs768684222 | c.47G>A | p.Arg16His | p.R16H | Q53G44 | protein_coding | deleterious(0) | benign(0.4) | TCGA-A6-2686-01 | Colorectum | colon adenocarcinoma | Female | >=65 | I/II | Unknown | Unknown | SD |
| IFI44L | SNV | Missense_Mutation | rs546691087 | c.377G>A | p.Arg126Gln | p.R126Q | Q53G44 | protein_coding | tolerated(0.64) | benign(0) | TCGA-AA-3510-01 | Colorectum | colon adenocarcinoma | Male | >=65 | I/II | Unknown | Unknown | SD |
| IFI44L | SNV | Missense_Mutation | rs761494321 | c.686N>A | p.Ala229Asp | p.A229D | Q53G44 | protein_coding | deleterious(0) | possibly_damaging(0.883) | TCGA-AA-3861-01 | Colorectum | colon adenocarcinoma | Male | >=65 | I/II | Unknown | Unknown | SD |
| IFI44L | SNV | Missense_Mutation | rs756569805 | c.703N>G | p.Ile235Val | p.I235V | Q53G44 | protein_coding | tolerated(0.52) | benign(0) | TCGA-AM-5820-01 | Colorectum | colon adenocarcinoma | Female | <65 | I/II | Unknown | Unknown | SD |
| IFI44L | SNV | Missense_Mutation | c.1303N>T | p.Asp435Tyr | p.D435Y | Q53G44 | protein_coding | deleterious(0) | probably_damaging(0.992) | TCGA-CA-6718-01 | Colorectum | colon adenocarcinoma | Male | <65 | I/II | Unknown | Unknown | PD | |
| IFI44L | SNV | Missense_Mutation | c.976N>G | p.Asn326Asp | p.N326D | Q53G44 | protein_coding | deleterious(0.01) | benign(0.313) | TCGA-CM-4744-01 | Colorectum | colon adenocarcinoma | Male | >=65 | I/II | Unknown | Unknown | SD | |
| IFI44L | SNV | Missense_Mutation | c.344G>A | p.Arg115His | p.R115H | Q53G44 | protein_coding | tolerated(0.53) | benign(0) | TCGA-CM-6161-01 | Colorectum | colon adenocarcinoma | Female | <65 | I/II | Unknown | Unknown | SD | |
| IFI44L | SNV | Missense_Mutation | c.136N>T | p.Arg46Cys | p.R46C | Q53G44 | protein_coding | tolerated(0.34) | benign(0) | TCGA-AG-3883-01 | Colorectum | rectum adenocarcinoma | Male | >=65 | I/II | Unknown | Unknown | SD |
| Page: 1 2 3 4 5 6 7 8 |
Top |
Related drugs of malignant transformation related genes |
| Identification of chemicals and drugs interact with genes involved in malignant transfromation |
| (DGIdb 4.0) |
| Entrez ID | Symbol | Category | Interaction Types | Drug Claim Name | Drug Name | PMIDs |
| Page: 1 |

Copyright 2023-Present -The University of Texas Health Science Center at Houston |