
|
|||||
|
 | |
| |
| |
| |
| |
| |
|
Gene: IFI35 |
Gene summary for IFI35 |
| Gene information | Species | Human | Gene symbol | IFI35 | Gene ID | 3430 |
| Gene name | interferon induced protein 35 | |
| Gene Alias | IFP35 | |
| Cytomap | 17q21.31 | |
| Gene Type | protein-coding | GO ID | GO:0001775 | UniProtAcc | P80217 |
Top |
Malignant transformation analysis |
| Identification of the aberrant gene expression in precancerous and cancerous lesions by comparing the gene expression of stem-like cells in diseased tissues with normal stem cells |
| Entrez ID | Symbol | Replicates | Species | Organ | Tissue | Adj P-value | Log2FC | Malignancy |
| 3430 | IFI35 | GSM4909307 | Human | Breast | IDC | 4.90e-05 | 2.61e-01 | 0.1569 |
| 3430 | IFI35 | GSM4909308 | Human | Breast | IDC | 2.53e-10 | 3.20e-01 | 0.158 |
| 3430 | IFI35 | GSM4909309 | Human | Breast | IDC | 1.60e-03 | 2.56e-01 | 0.0483 |
| 3430 | IFI35 | GSM4909319 | Human | Breast | IDC | 2.70e-07 | 1.18e-01 | 0.1563 |
| 3430 | IFI35 | GSM4909321 | Human | Breast | IDC | 3.47e-08 | 3.41e-01 | 0.1559 |
| 3430 | IFI35 | NCCBC5 | Human | Breast | DCIS | 1.13e-05 | 3.11e-01 | 0.2046 |
| 3430 | IFI35 | P2 | Human | Breast | IDC | 2.44e-18 | 6.87e-01 | 0.21 |
| 3430 | IFI35 | DCIS2 | Human | Breast | DCIS | 1.02e-09 | 2.17e-02 | 0.0085 |
| 3430 | IFI35 | LZE4T | Human | Esophagus | ESCC | 4.48e-13 | 3.05e-01 | 0.0811 |
| 3430 | IFI35 | LZE7T | Human | Esophagus | ESCC | 4.02e-02 | 1.00e-01 | 0.0667 |
| 3430 | IFI35 | LZE8T | Human | Esophagus | ESCC | 1.34e-14 | 4.13e-01 | 0.067 |
| 3430 | IFI35 | LZE20T | Human | Esophagus | ESCC | 2.89e-10 | 4.24e-01 | 0.0662 |
| 3430 | IFI35 | LZE22T | Human | Esophagus | ESCC | 6.83e-05 | 3.57e-01 | 0.068 |
| 3430 | IFI35 | LZE24T | Human | Esophagus | ESCC | 8.11e-40 | 1.33e+00 | 0.0596 |
| 3430 | IFI35 | LZE21T | Human | Esophagus | ESCC | 2.42e-06 | 5.08e-01 | 0.0655 |
| 3430 | IFI35 | LZE6T | Human | Esophagus | ESCC | 3.34e-15 | 5.09e-01 | 0.0845 |
| 3430 | IFI35 | P1T-E | Human | Esophagus | ESCC | 1.55e-11 | 6.79e-01 | 0.0875 |
| 3430 | IFI35 | P2T-E | Human | Esophagus | ESCC | 4.62e-33 | 6.69e-01 | 0.1177 |
| 3430 | IFI35 | P4T-E | Human | Esophagus | ESCC | 4.77e-25 | 5.96e-01 | 0.1323 |
| 3430 | IFI35 | P5T-E | Human | Esophagus | ESCC | 1.47e-48 | 1.05e+00 | 0.1327 |
| Page: 1 2 3 4 5 6 7 |
| Tissue | Expression Dynamics | Abbreviation |
| Breast |  | IDC: Invasive ductal carcinoma |
| DCIS: Ductal carcinoma in situ | ||
| Precancer(BRCA1-mut): Precancerous lesion from BRCA1 mutation carriers | ||
| Esophagus | 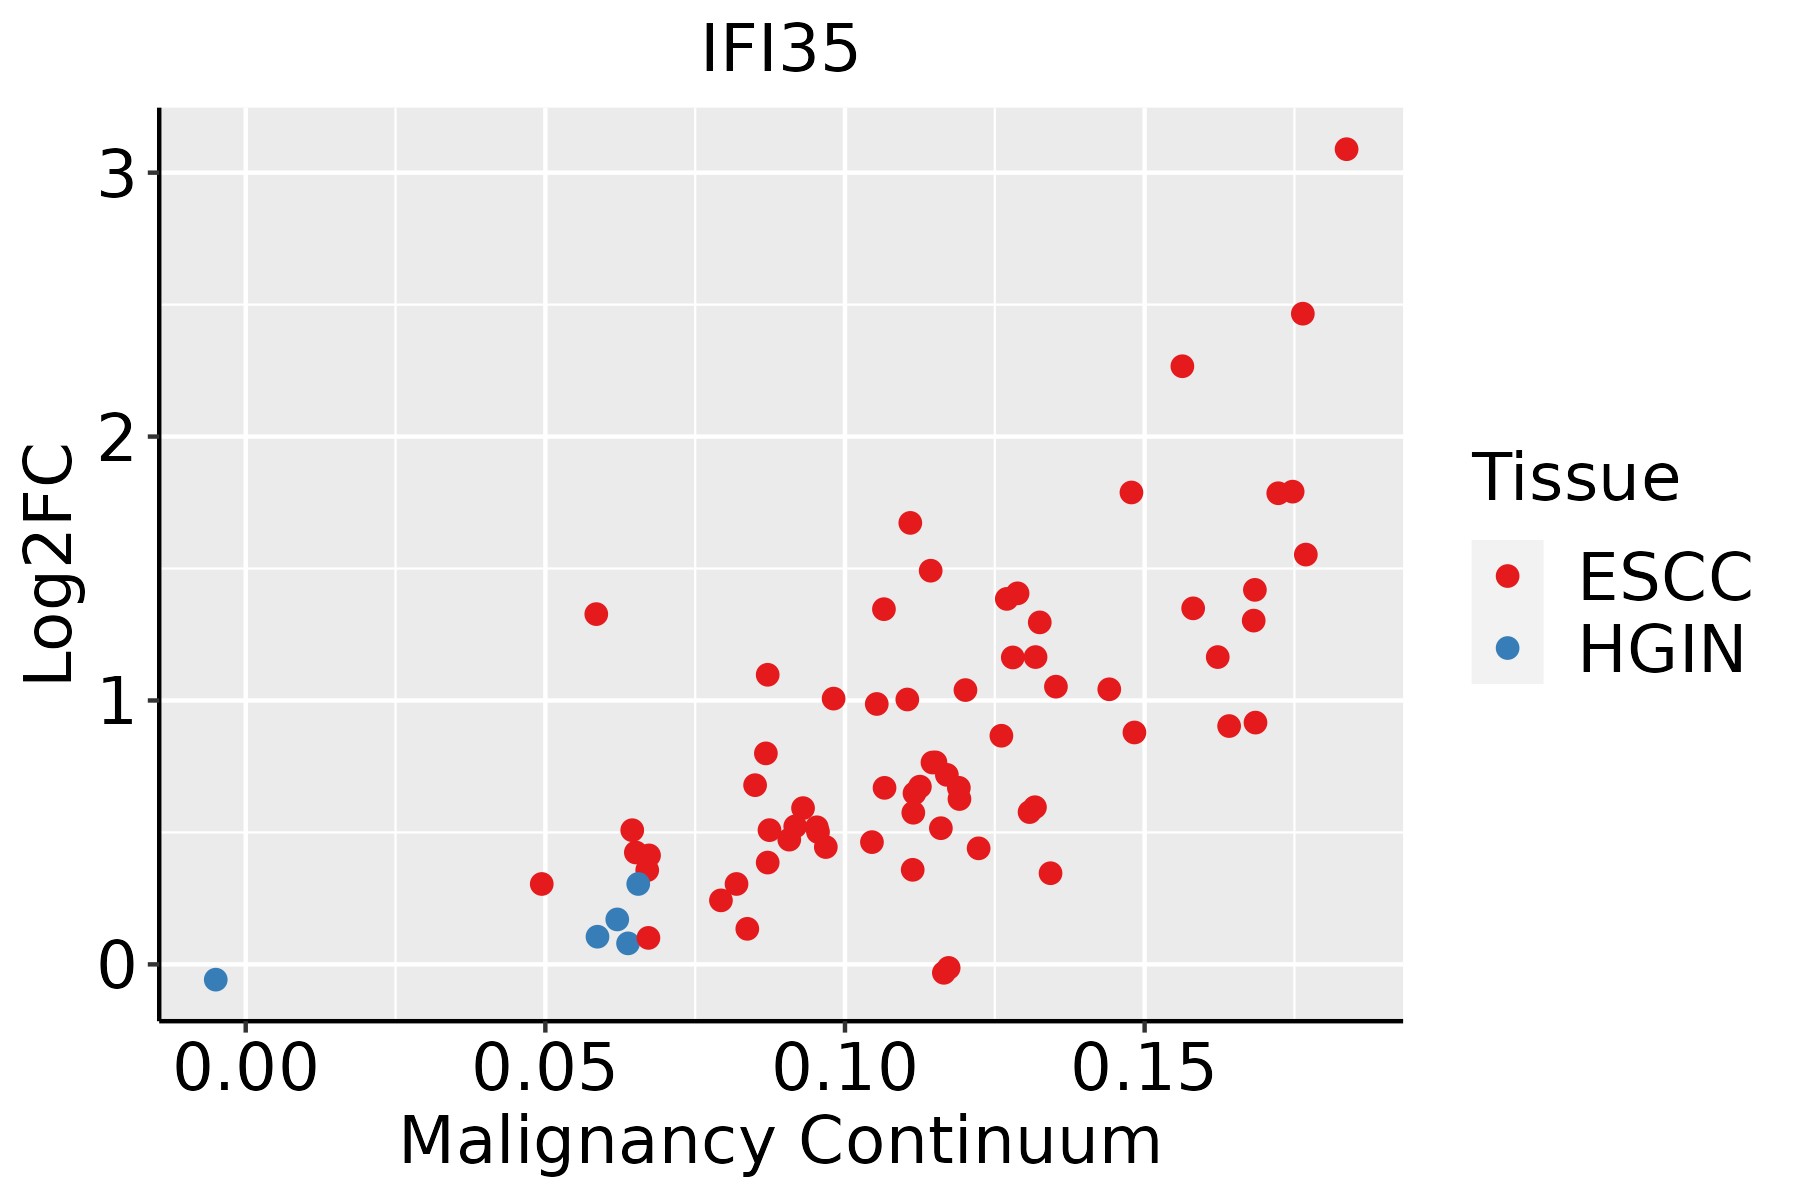 | ESCC: Esophageal squamous cell carcinoma |
| HGIN: High-grade intraepithelial neoplasias | ||
| LGIN: Low-grade intraepithelial neoplasias | ||
| Liver | 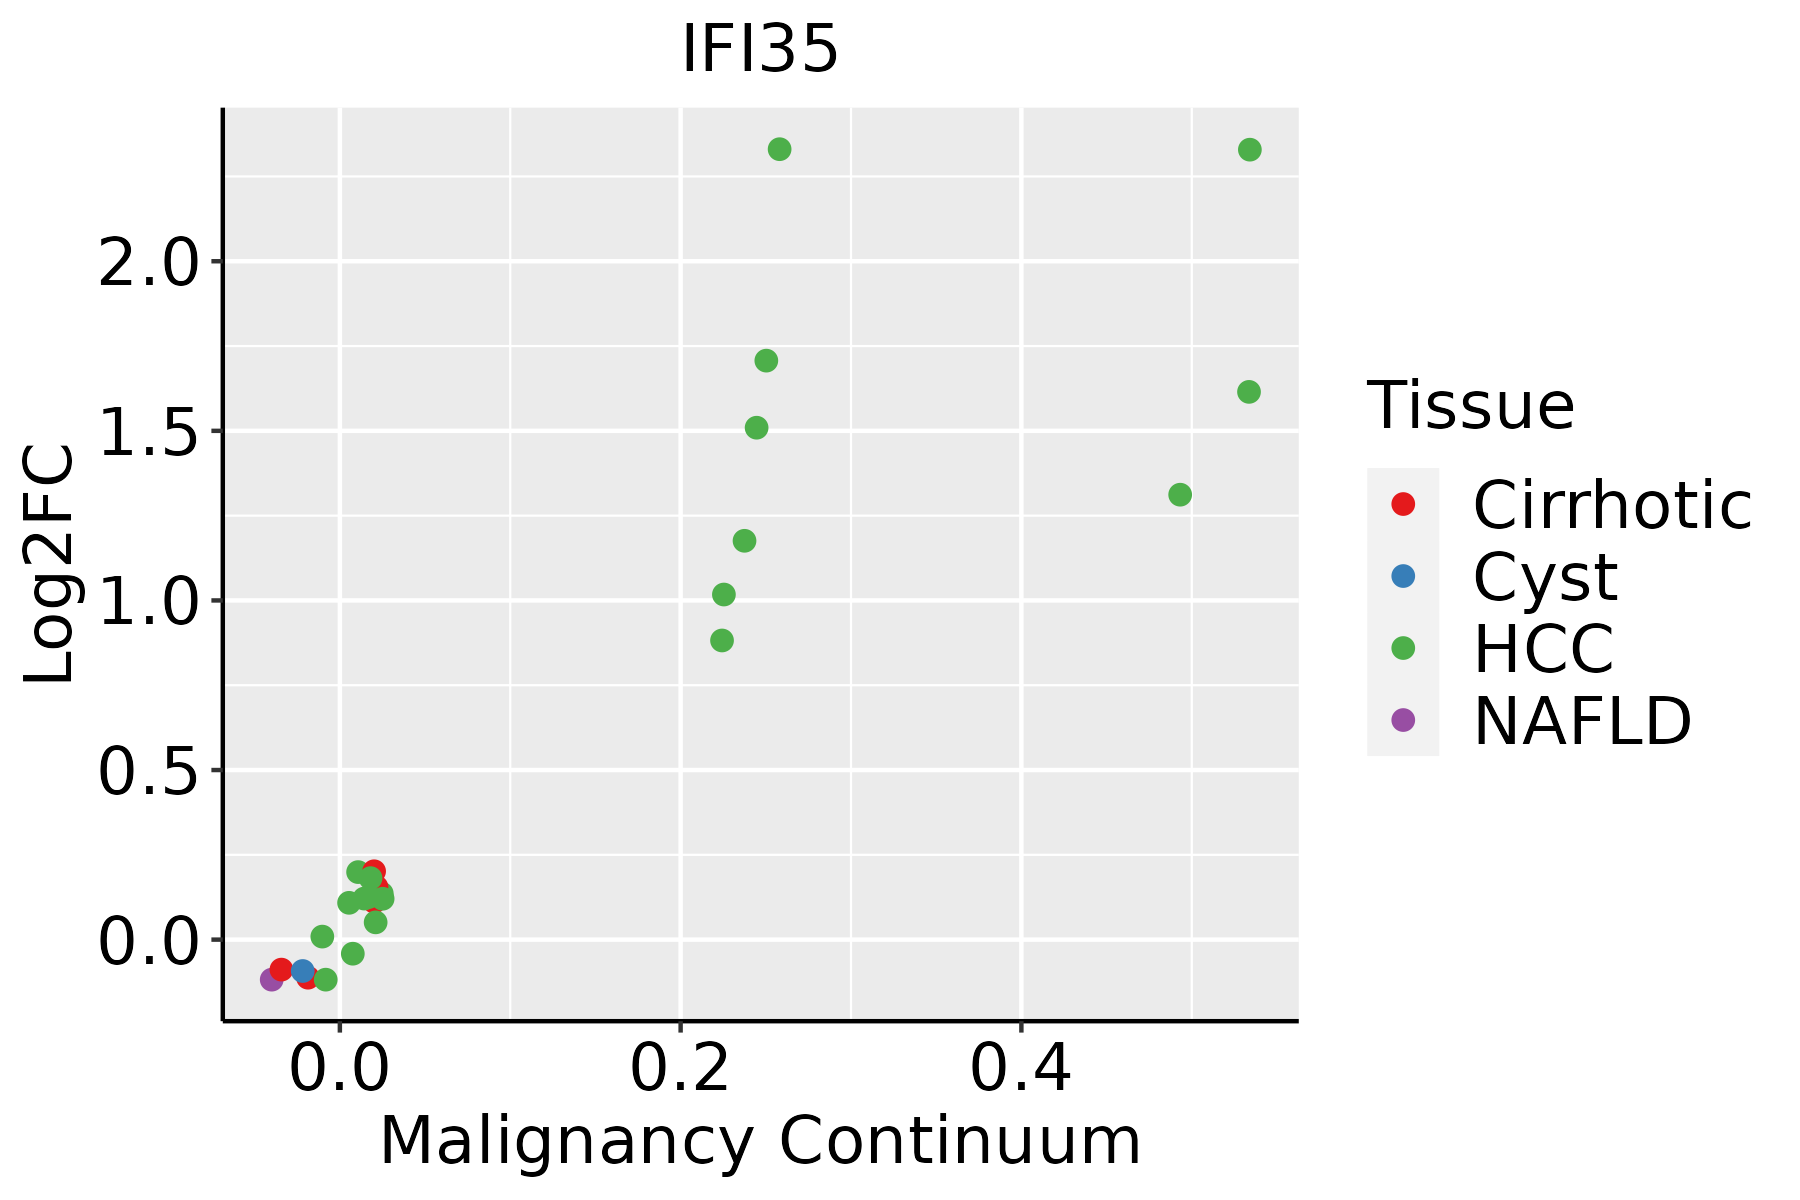 | HCC: Hepatocellular carcinoma |
| NAFLD: Non-alcoholic fatty liver disease | ||
| Oral Cavity |  | EOLP: Erosive Oral lichen planus |
| LP: leukoplakia | ||
| NEOLP: Non-erosive oral lichen planus | ||
| OSCC: Oral squamous cell carcinoma | ||
| Skin | 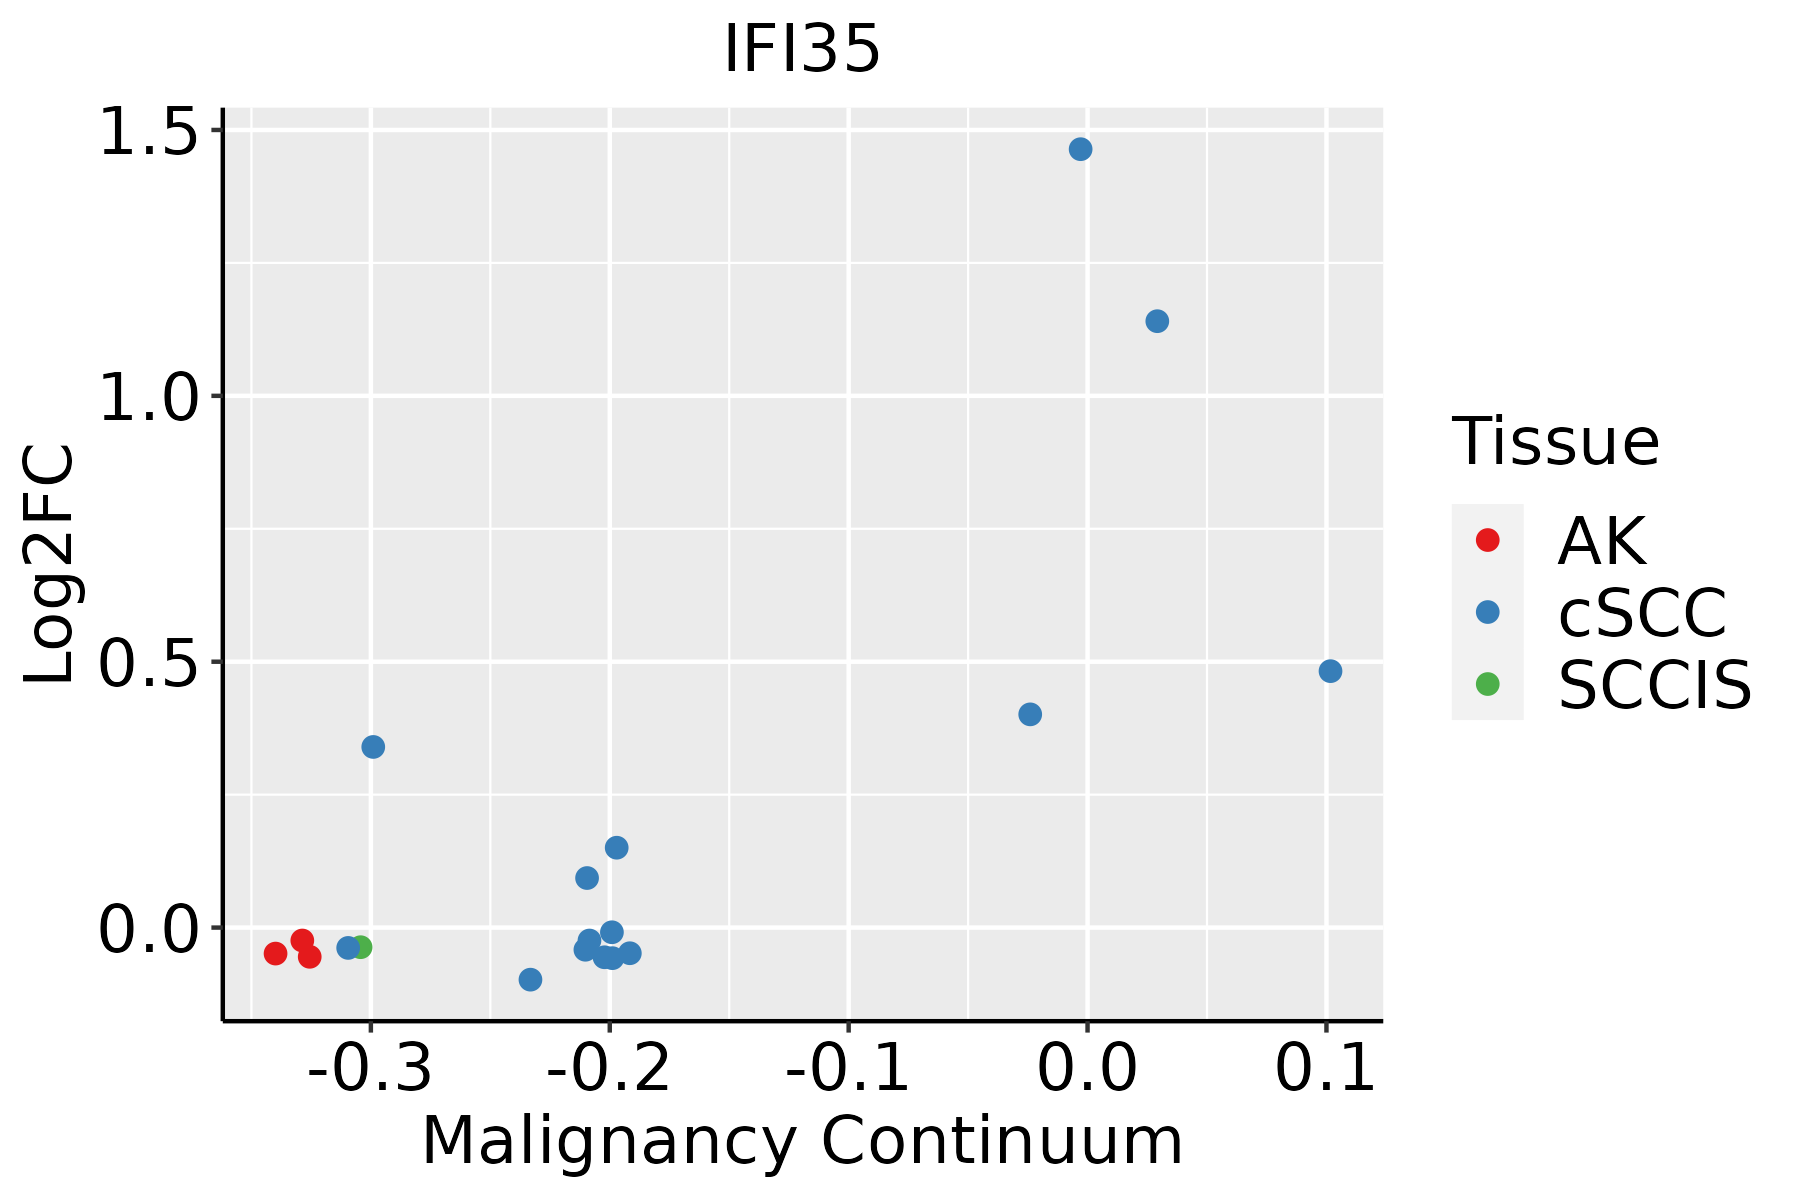 | AK: Actinic keratosis |
| cSCC: Cutaneous squamous cell carcinoma | ||
| SCCIS:squamous cell carcinoma in situ | ||
| Thyroid | 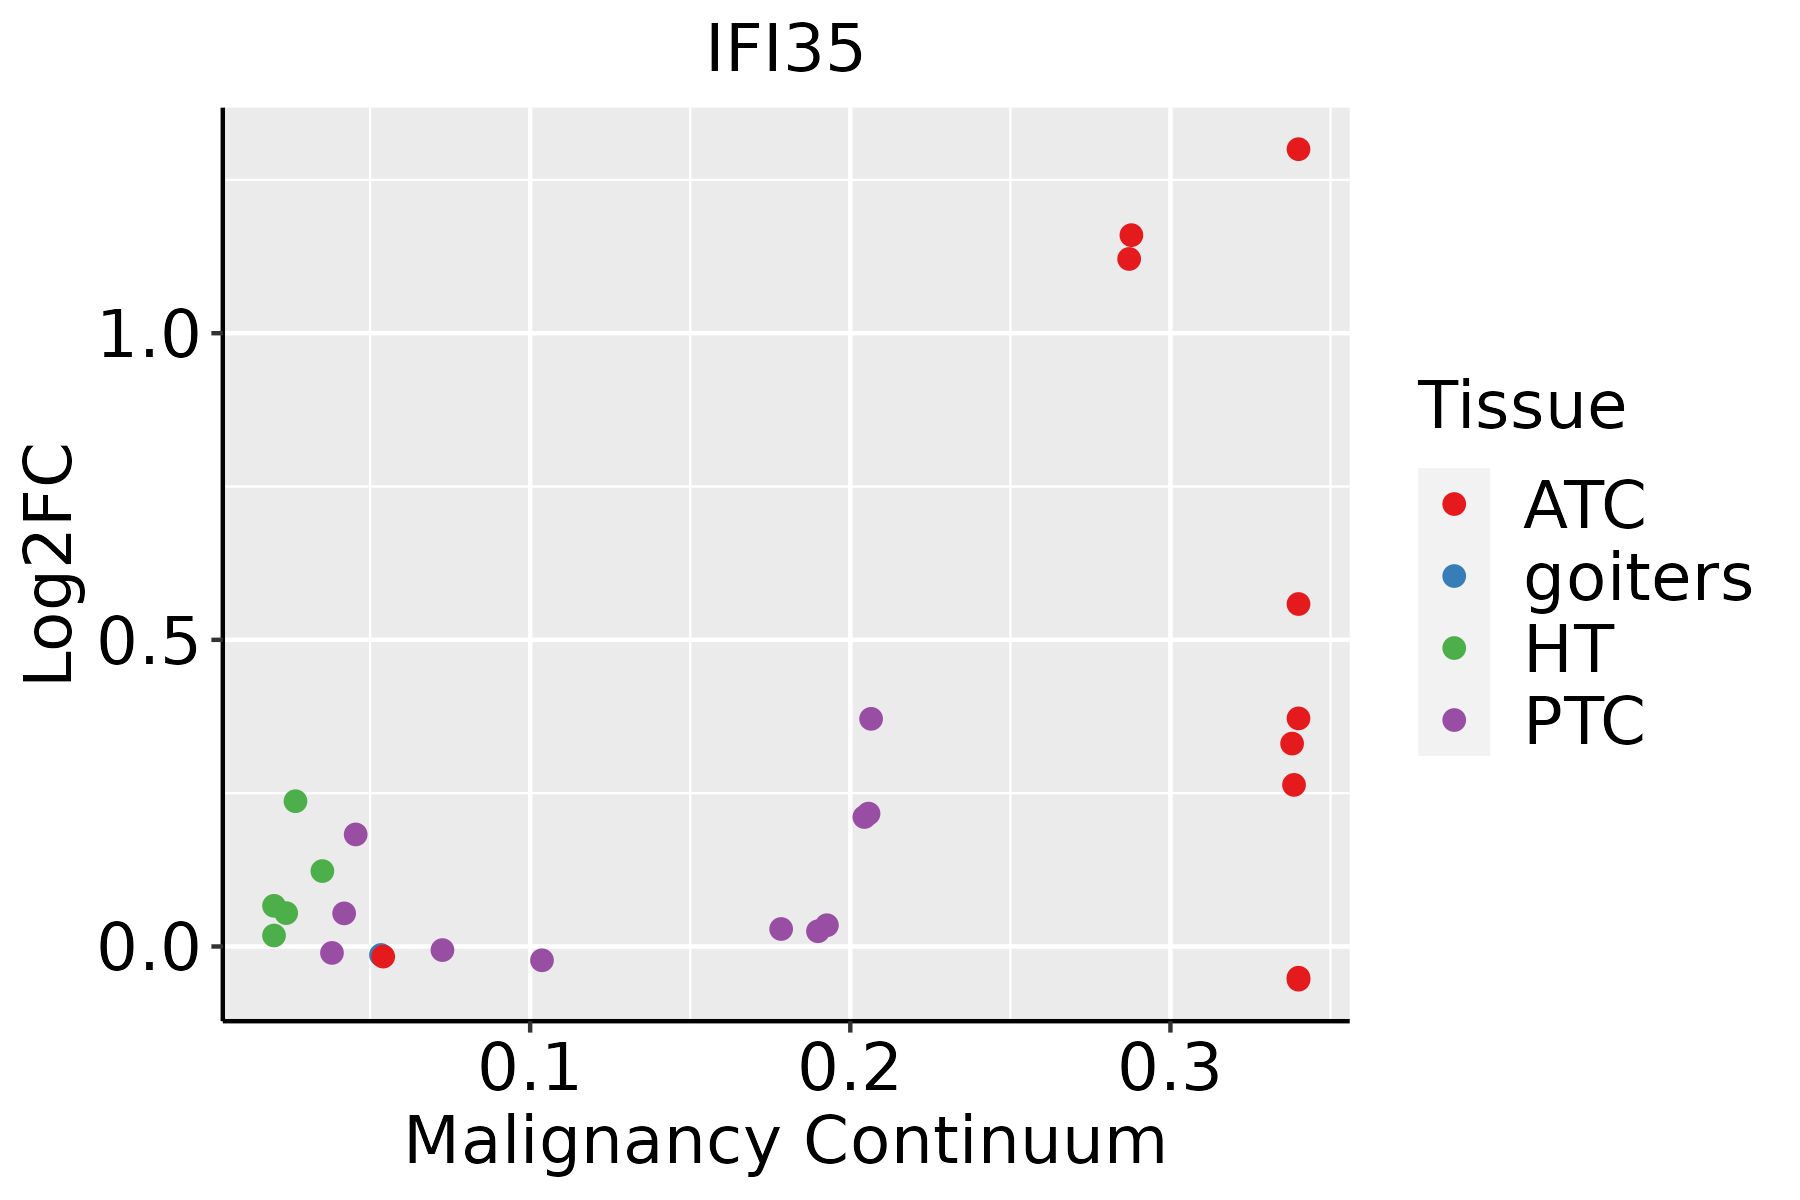 | ATC: Anaplastic thyroid cancer |
| HT: Hashimoto's thyroiditis | ||
| PTC: Papillary thyroid cancer |
| ∗log2FC in expression of this searched gene in stem-like cells from each diseased tissue sample relative to stem-like cells in normal samples in each tissue plotted against the malignancy continuum. Samples are colored based on if they are from different disease stage. |
Top |
Malignant transformation related pathway analysis |
| Find out the enriched GO biological processes and KEGG pathways involved in transition from healthy to precancer to cancer |
| Tissue | Disease Stage | Enriched GO biological Processes |
| Colorectum | AD |  |
| Colorectum | SER |  |
| Colorectum | MSS |  |
| Colorectum | MSI-H |  |
| Colorectum | FAP |  |
| ∗Top 15 enriched GO BP terms are showed in the bar plot of each disease state in each tissue. Each row represents a significant GO biological process which is colored according to the -log10(p.adjust). |
| Page: 1 2 3 4 5 6 7 8 9 |
| GO ID | Tissue | Disease Stage | Description | Gene Ratio | Bg Ratio | pvalue | p.adjust | Count |
| GO:00313491 | Breast | IDC | positive regulation of defense response | 39/1434 | 278/18723 | 1.74e-04 | 2.95e-03 | 39 |
| GO:003210311 | Breast | IDC | positive regulation of response to external stimulus | 54/1434 | 427/18723 | 1.85e-04 | 3.07e-03 | 54 |
| GO:00507291 | Breast | IDC | positive regulation of inflammatory response | 23/1434 | 142/18723 | 4.87e-04 | 6.42e-03 | 23 |
| GO:00507271 | Breast | IDC | regulation of inflammatory response | 48/1434 | 386/18723 | 5.99e-04 | 7.54e-03 | 48 |
| GO:00341231 | Breast | IDC | positive regulation of toll-like receptor signaling pathway | 7/1434 | 28/18723 | 4.31e-03 | 3.35e-02 | 7 |
| GO:006220811 | Breast | IDC | positive regulation of pattern recognition receptor signaling pathway | 9/1434 | 44/18723 | 5.42e-03 | 4.00e-02 | 9 |
| GO:003210321 | Breast | DCIS | positive regulation of response to external stimulus | 54/1390 | 427/18723 | 8.34e-05 | 1.58e-03 | 54 |
| GO:00313492 | Breast | DCIS | positive regulation of defense response | 38/1390 | 278/18723 | 1.91e-04 | 3.08e-03 | 38 |
| GO:00507292 | Breast | DCIS | positive regulation of inflammatory response | 22/1390 | 142/18723 | 7.81e-04 | 9.09e-03 | 22 |
| GO:00507272 | Breast | DCIS | regulation of inflammatory response | 46/1390 | 386/18723 | 9.91e-04 | 1.10e-02 | 46 |
| GO:00341232 | Breast | DCIS | positive regulation of toll-like receptor signaling pathway | 7/1390 | 28/18723 | 3.63e-03 | 2.94e-02 | 7 |
| GO:00022742 | Breast | DCIS | myeloid leukocyte activation | 28/1390 | 223/18723 | 4.37e-03 | 3.41e-02 | 28 |
| GO:006220821 | Breast | DCIS | positive regulation of pattern recognition receptor signaling pathway | 9/1390 | 44/18723 | 4.42e-03 | 3.41e-02 | 9 |
| GO:00421162 | Breast | DCIS | macrophage activation | 16/1390 | 106/18723 | 4.99e-03 | 3.72e-02 | 16 |
| GO:0002833 | Breast | DCIS | positive regulation of response to biotic stimulus | 22/1390 | 168/18723 | 6.61e-03 | 4.62e-02 | 22 |
| GO:00028314 | Breast | DCIS | regulation of response to biotic stimulus | 37/1390 | 327/18723 | 6.86e-03 | 4.75e-02 | 37 |
| GO:00028318 | Esophagus | ESCC | regulation of response to biotic stimulus | 191/8552 | 327/18723 | 2.12e-06 | 2.45e-05 | 191 |
| GO:00450885 | Esophagus | ESCC | regulation of innate immune response | 125/8552 | 218/18723 | 3.34e-04 | 1.96e-03 | 125 |
| GO:190122414 | Esophagus | ESCC | positive regulation of NIK/NF-kappaB signaling | 44/8552 | 69/18723 | 1.86e-03 | 8.42e-03 | 44 |
| GO:00380615 | Esophagus | ESCC | NIK/NF-kappaB signaling | 81/8552 | 143/18723 | 5.33e-03 | 2.00e-02 | 81 |
| Page: 1 2 3 4 |
| Pathway ID | Tissue | Disease Stage | Description | Gene Ratio | Bg Ratio | pvalue | p.adjust | qvalue | Count |
| Page: 1 |
Top |
Cell-cell communication analysis |
| Identification of potential cell-cell interactions between two cell types and their ligand-receptor pairs for different disease states |
| Ligand | Receptor | LRpair | Pathway | Tissue | Disease Stage |
| Page: 1 |
Top |
Single-cell gene regulatory network inference analysis |
| Find out the significant the regulons (TFs) and the target genes of each regulon across cell types for different disease states |
| TF | Cell Type | Tissue | Disease Stage | Target Gene | RSS | Regulon Activity |
| ∗The dot plots of a searched regulon are shown for all cell subpopulations in each disease state of each tissue based on the regulon specific score inferred using pySCENIC and by calculating the average expression. |
| Page: 1 |
Top |
Somatic mutation of malignant transformation related genes |
| Annotation of somatic variants for genes involved in malignant transformation |
| Hugo Symbol | Variant Class | Variant Classification | dbSNP RS | HGVSc | HGVSp | HGVSp Short | SWISSPROT | BIOTYPE | SIFT | PolyPhen | Tumor Sample Barcode | Tissue | Histology | Sex | Age | Stage | Therapy Types | Drugs | Outcome |
| IFI35 | SNV | Missense_Mutation | rs771605420 | c.179N>T | p.Pro60Leu | p.P60L | P80217 | protein_coding | deleterious(0.03) | benign(0) | TCGA-E2-A154-01 | Breast | breast invasive carcinoma | Female | >=65 | I/II | Hormone Therapy | arimidex | SD |
| IFI35 | insertion | In_Frame_Ins | novel | c.529_530insAGG | p.Leu177delinsGlnVal | p.L177delinsQV | P80217 | protein_coding | TCGA-A8-A08H-01 | Breast | breast invasive carcinoma | Female | >=65 | I/II | Unknown | Unknown | SD | ||
| IFI35 | insertion | In_Frame_Ins | novel | c.530_531insGGGAGATCTGGTGTTGTTTGGTAAAAACGAGCTGGCGAG | p.Leu177_Pro178insGlyAspLeuValLeuPheGlyLysAsnGluLeuAlaArg | p.L177_P178insGDLVLFGKNELAR | P80217 | protein_coding | TCGA-A8-A08H-01 | Breast | breast invasive carcinoma | Female | >=65 | I/II | Unknown | Unknown | SD | ||
| IFI35 | insertion | Frame_Shift_Ins | novel | c.316_317insTGCATTCC | p.Glu106ValfsTer24 | p.E106Vfs*24 | P80217 | protein_coding | TCGA-BH-A0BD-01 | Breast | breast invasive carcinoma | Female | <65 | I/II | Chemotherapy | doxorubicin | SD | ||
| IFI35 | SNV | Missense_Mutation | c.306N>G | p.Ile102Met | p.I102M | P80217 | protein_coding | deleterious(0) | possibly_damaging(0.79) | TCGA-FU-A40J-01 | Cervix | cervical & endocervical cancer | Female | <65 | III/IV | Chemotherapy | carboplatin | CR | |
| IFI35 | SNV | Missense_Mutation | c.144N>G | p.Ile48Met | p.I48M | P80217 | protein_coding | tolerated(0.26) | benign(0.159) | TCGA-A6-2677-01 | Colorectum | colon adenocarcinoma | Female | >=65 | III/IV | Ancillary | leucovorin | SD | |
| IFI35 | SNV | Missense_Mutation | rs141921308 | c.233C>T | p.Ala78Val | p.A78V | P80217 | protein_coding | deleterious(0) | benign(0.05) | TCGA-AA-3715-01 | Colorectum | colon adenocarcinoma | Male | >=65 | I/II | Unknown | Unknown | PD |
| IFI35 | SNV | Missense_Mutation | novel | c.259N>T | p.Asp87Tyr | p.D87Y | P80217 | protein_coding | deleterious(0) | possibly_damaging(0.46) | TCGA-AA-A00N-01 | Colorectum | colon adenocarcinoma | Male | >=65 | I/II | Unknown | Unknown | PD |
| IFI35 | SNV | Missense_Mutation | c.799G>T | p.Val267Leu | p.V267L | P80217 | protein_coding | deleterious(0) | benign(0.027) | TCGA-DM-A1D0-01 | Colorectum | colon adenocarcinoma | Female | >=65 | I/II | Unknown | Unknown | SD | |
| IFI35 | SNV | Missense_Mutation | c.93N>C | p.Lys31Asn | p.K31N | P80217 | protein_coding | tolerated(0.05) | benign(0.056) | TCGA-G4-6317-01 | Colorectum | colon adenocarcinoma | Female | <65 | III/IV | Chemotherapy | fluorouracil | PD |
| Page: 1 2 3 |
Top |
Related drugs of malignant transformation related genes |
| Identification of chemicals and drugs interact with genes involved in malignant transfromation |
| (DGIdb 4.0) |
| Entrez ID | Symbol | Category | Interaction Types | Drug Claim Name | Drug Name | PMIDs |
| Page: 1 |

Copyright 2023-Present -The University of Texas Health Science Center at Houston |